
Abstract
Anaplastic thyroid carcinoma (ATC) is a rare type of thyroid cancer that results in fatal clinical outcomes; the pathogenesis of this life-threatening disease has yet to be fully elucidated. This study aims to identify the hub genes of ATC that may play key roles in ATC development and could serve as prognostic biomarkers or therapeutic targets. Two microarray datasets (GSE33630 and GSE53072) were obtained from the Gene Expression Omnibus database; these sets included 16 ATC and 49 normal thyroid samples. Differential expression analyses were performed for each dataset, and 420 genes were screened as common differentially expressed genes using the robust rank aggregation method. Gene Ontology and Kyoto Encyclopedia of Genes and Genomes enrichment analyses were conducted to explore the potential bio-functions of these differentially expressed genes (DEGs). The terms and enriched pathways were primarily associated with cell cycle, cell adhesion, and cancer-related signaling pathways. Furthermore, a protein-protein interaction network of DEG expression products was constructed using Cytoscape. Based on the whole network, we identified 7 hub genes that included CDK1, TOP2A, CDC20, KIF11, CCNA2, NUSAP1, and KIF2C. The expression levels of these hub genes were validated using quantitative polymerase chain reaction analyses of clinical specimens. In conclusion, the present study identified several key genes that are involved in ATC development and provides novel insights into the understanding of the molecular mechanisms of ATC development.
Keywords
Introduction
Anaplastic thyroid carcinoma (ATC) is a rare but devastating type of thyroid cancer that accounts for approximately 2% of all thyroid carcinoma (TC) cases. 1 Despite its low prevalence, ATC is associated with a median overall survival (OS) of 3 to 10 months and is responsible for more than half of TC-related deaths. 2 -4 ATC arises from the follicular cells of the thyroid gland. However, compared to papillary thyroid carcinoma (PTC) and follicular thyroid carcinoma (FTC), ATC cells do not retain any of the biological features of normal follicular cells. 5 Clinically, ATC is characterized by aggressive local disease, high rates of metastasis, and extremely high mortality. 6,7 Based on this, there is an urgent need to further understand the unique biology and pathogenesis underlying this life-threatening disease.
During the last few decades, the clinical and molecular heterogeneity of ATC has been widely recognized, and much effort has been devoted to elucidating the mechanisms underlying this disease. To date, an increasing number of studies have suggested that the tumorigenesis of ATC is a stepwise dedifferentiation that involves the accumulation of somatic pro-carcinogenic mutations in genes such as TP53 and those involved in the PI3K-AKT-mTOR pathway 8,9 ; it has been widely established that BRAF V600E and RAS mutations are common drivers of this disease. 10,11 The current accepted hypothesis is that ATCs are driven from papillary thyroid carcinomas through the acquisition of a discrete number of genomic alterations. 12,13 Overexpression of EGFR and VEGF has been noted in a majority of ATC tissues, which is considered to be an indicator of poor prognosis. 14 -16 Moreover, the aberrant elevation of various tumor-related pathways, such as Notch, Wnt/β-catenin, NF-κB, and JAK/STAT signaling has been observed in a subpopulation of cancer stem-like ATC cells. 17 -20 Although many important drivers have been discovered through genomic and transcriptomic studies, the molecular mechanisms underlying ATC have still not been fully elucidated.
Based on this, we performed a series of bioinformatics analyses in an attempt to identify differentially expressed genes (DEGs) in ATC that are distinct from those in normal thyroid samples by analyzing datasets that were obtained from the Gene Expression Omnibus (GEO) database; we also explored the potential bio-functions through the use of Gene Ontology (GO) and Kyoto Encyclopedia of Genes and Genomes (KEGG) enrichment analyses. Furthermore, a protein-protein interaction (PPI) network was constructed, and 7 hub genes were identified based on this network. The results of our present study may provide new insights into the understanding of the molecular mechanisms of ATC development.
Materials and Methods
Downloading and Processing of GEO Datasets
Microarray datasets were obtained from GEO (URL: http://www.ncbi.nlm.nih.gov/geo) to study the expression profiles of ATC. The inclusion criteria for the microarray datasets were as follows: (a) samples containing ATC and normal thyroid tissues, (b) total RNA samples for transcriptome testing, (c) expression profiling by array as the study type, and (d) Homo sapiens as the organism. Additionally, samples from patients who received preoperative treatment were excluded. Based on the inclusion and exclusion criteria, the microarray datasets GSE33630 21 and GSE53072 22 were selected. GSE33630 consists of 11 ATC and 45 normal thyroid samples, and GSE53072 consists of 5 ATC and 4 normal thyroid samples. The R package programs affy (URL: https://www.bioconductor.org/packages/release/bioc/html/affy.html) and oligo (URL: https://www.bioconductor.org/packages/release/bioc/html/oligo.html) were used to read the original data from the 2 datasets. The probe names in each expression matrix were annotated to Entrez ID according to the platform files (GPL570: Affymetrix Human Genome U133 Plus 2.0 Array; GPL6244, Affymetrix Human Gene 1.0 ST Array).
Differential Expression Analysis
The R package program limma (URL: https://www.bioconductor.org/packages/release/bioc/html/limma.html) was used to perform differential expression analysis to identify DEGs. Background correction and data normalization were performed using the R package programs affy and oligo. Adjusted P-value (Adj.P) < 0.05 and |log2 fold-change (FC)| > 1 were used as thresholds for DEG identification. Furthermore, the robust rank aggregation (RRA) method was used to screen out common DEGs from the 2 datasets.
Functional and Pathway Enrichment Analyses
GO and KEGG enrichment analyses were conducted to explore the potential functions of the identified DEGs. GO analysis was performed under 3 different categories that included biological process (BP), cellular component (CC), and molecular function (MF). Z-scores were calculated for each GO term using the formula z-score = (up-regulated gene count − down-regulated gene count) / (total gene count), as the data generated using this formula could indicate if the biological process (/molecular function/cellular components) is more likely to be decreased (negative value) or increased (positive value) in ATC samples. R package clusterProfiler (https://www.bioconductor.org/packages/release/bioc/html/clusterProfiler.html) was used to perform GO and KEGG analyses.
PPI Network Construction and Hub Gene Identification
A PPI analysis of the identified DEGs was performed according to the Search Tool for the Retrieval of Interacting Genes (STRING; version 11.0, URL: https://string-db.org/) database and visualized using Cytoscape (version 3.7.1, https://cytoscape.org/download.html). Subsequently, to further understand the functions of different clusters obtained from the whole PPI network, the Cytoscape plug-in MCODE (version 1.5, URL: http://apps.cytoscape.org/apps/mcode) was used to identify significant modules. Thereafter, another plug-in, cytohubba (version 0.1, URL: apps.cytoscape.org/apps/cytohubba), was used for hub gene identification. The maximal clique centrality (MCC) method was selected for screening.
Collection of Clinical Specimens
A total of 8 ATC and 30 normal thyroid tissue samples were collected either by biopsy or surgery. The patients used for tissue collection were primarily diagnosed between 2014 and 2019 at the Affiliated Hospital of Jiangnan University. To prevent RNA degradation, all specimens were transferred into liquid nitrogen immediately after removal and subsequently stored at -80°C. Each patient enrolled in this study provided signed informed consent, and this study was approved by the Ethical Committee of the hospital (approval number: LS2019044).
RNA Extraction and Reverse-Transcription PCR (qRT-PCR)
Total RNA was extracted from clinical specimens using the E.Z.N.A Total RNA Kit I (Omega, USA) following the manufacturer’s protocol. Complementary DNA (cDNA) was synthesized using the Prime Script RT Reagent Kit (Takara Bio, Japan). Real-time PCR was performed using a CFX96 Touch Real-Time PCR Detection System (Bio-Rad, USA). The comparative Ct method was used to measure the expression levels of hub genes, with Glyceraldehyde-3-phosphate dehydrogenase (GAPDH) as a normalization control. The primer sequences are listed in Table SI.
Results
Identification of DEGs
A total of 16 ATC and 49 normal thyroid samples derived from 2 microarray datasets were used for differential expression analysis. Figure 1 shows the flow diagram of the bioinformatic analysis performed in this study. The distribution of DEGs identified from each dataset is shown in Figure 2A and 2B. Moreover, the common DEGs were screened using the RRA method; these DEGs included 178 upregulated and 242 downregulated genes (Figure 2C and D). The expression heatmap of the top 10 up and downregulated DEGs is shown in Figure 2E.

Flow diagram of the bioinformatic analyses performed in this study.

Identification of DEGs in 2 ATC datasets according to GEO. (A, B) Volcano plots of the differential expression analysis for GSE33630 and GSE53072. (C, D) Upset plot of the up and downregulated common DEGs derived from the 2 datasets. (E) Expression heatmap of the top 10 up and downregulated DEGs.
Functional and Pathway Enrichment Analyses
GO and KEGG pathway enrichment analyses were employed to characterize the functional roles of the identified DEGs. First, GO analysis was conducted to assess 3 categories. According to category BP, mitotic spindle organization, G1/S transition of the cell cycle, extracellular matrix organization, and inflammatory response were increased in ATC, while thyroid hormone bio-synthetic and single organismal cell adhesion pathways were decreased (Figure 3A). For category CC, the enriched terms were primarily involved in the extracellular space, the cell surface, and the plasma membrane. Moreover, for category MF, the main functions of proteins encoded by the DEGs were integrin binding, cell adhesion molecule binding, and receptor activity (Figure 3B).
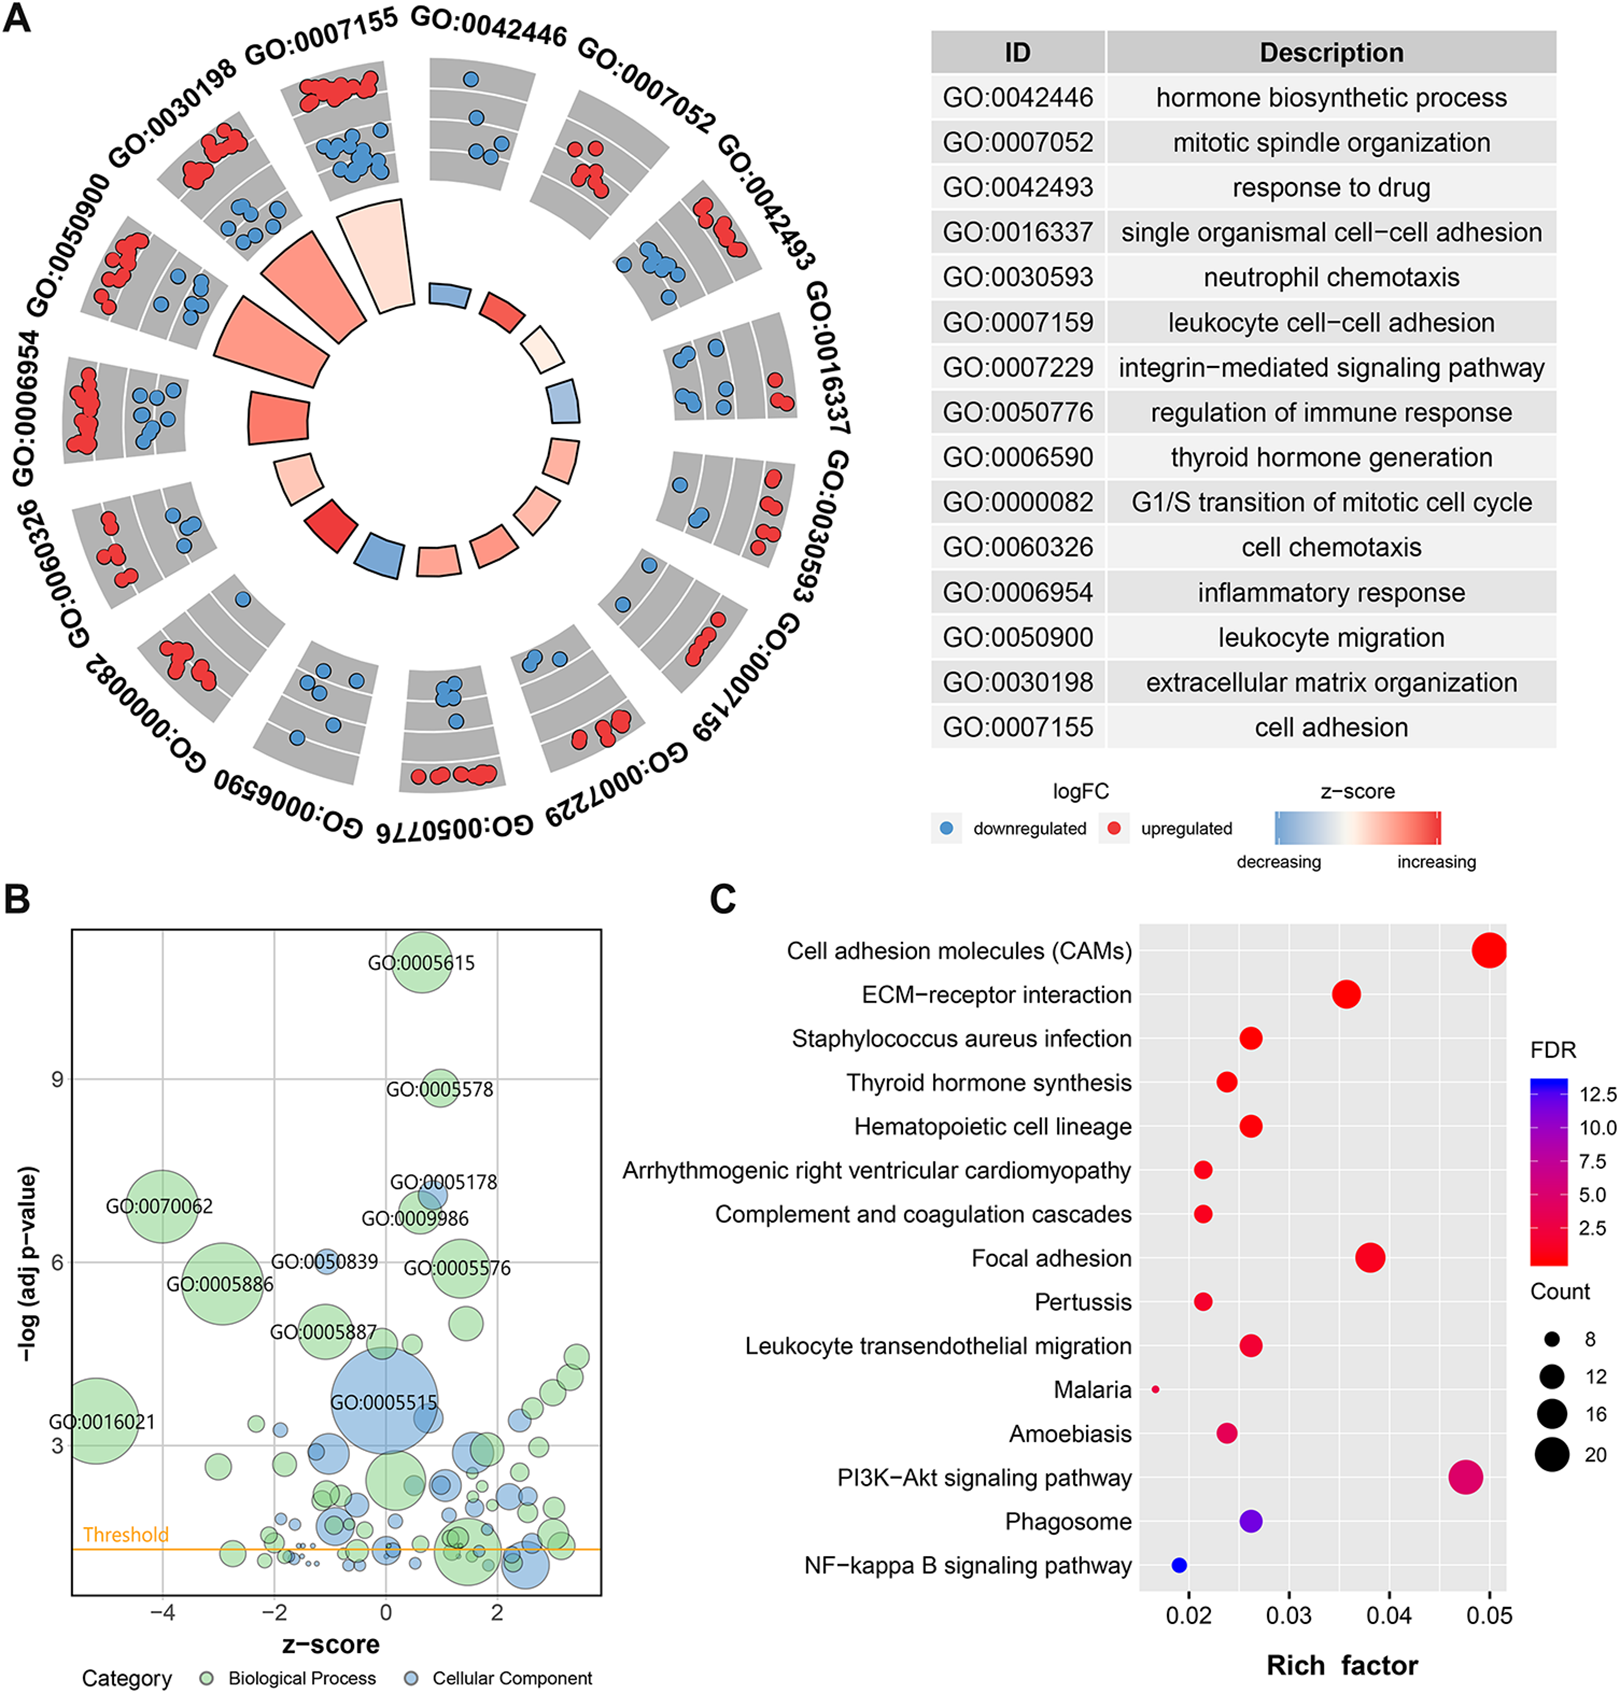
Functional and pathway enrichment analyses for DEGs. (A) Circle plot of GO terms under the BP category. The blue dots indicate downregulated DEGs, and the red dots indicate up-regulated DEGs. (B) Bubble plot of GO terms under the MF and CC categories. (C) Dot plot of the KEGG pathway enrichment analyses. The Rich factor (%) is the ratio of the number of DEGs annotated in a pathway to the number of all genes annotated in this pathway.
According to KEGG analysis, various pathways associated with carcinogenesis, including the extracellular matrix (ECM)-receptor interaction, focal adhesion, PI3K-Akt, and NF-κB signaling pathways, were enriched (Figure 3C).
Construction of the PPI Network and Module Analysis
To further explore the interactions among proteins encoded by the identified DEGs, a PPI network involving 199 nodes and 760 edges (Figure 4A) was constructed according to the STRING database and visualized using Cytoscape. A combined score > 0.7 was used as the cutoff criterion. Subsequently, the Cytoscape plug-in MCODE was used for clustering analysis, and 5 functional modules were identified from the whole network (Figure 4B-F). Moreover, KEGG enrichment analysis was performed for these modules to understand their bio-functions. According to the results, the enriched pathways were primarily associated with cell adhesion, cell cycle function, ECM-receptor interaction, and pathways involved in cancer (Table 1).

PPI network construction and functional module analysis. (A) The entire PPI network. (B) Network of functional module 1. (C) Network of functional module 2. (D) Network of functional module 3. (E) Network of functional module 4. (F) Network of functional module 5.
KEGG Enrichment Analysis of the 5 Modules Identified From PPI Network.
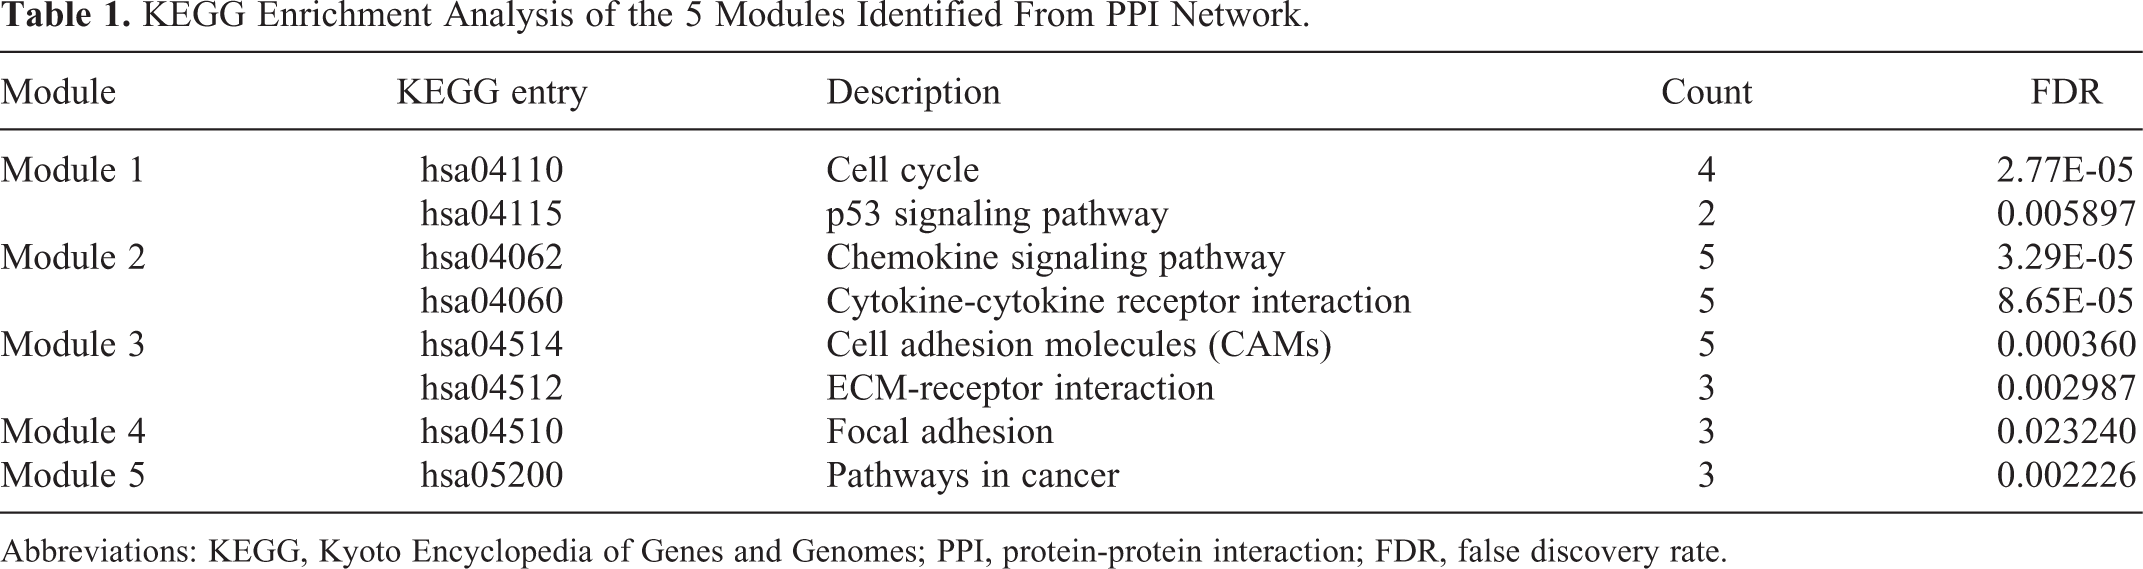
Abbreviations: KEGG, Kyoto Encyclopedia of Genes and Genomes; PPI, protein-protein interaction; FDR, false discovery rate.
Hub Gene Screening and qRT-PCR Validation
The Cytoscape plug-in cytohubba was used to identify hub genes from the whole PPI network. According to the ranking generated using the MMC method (list of the top 50 genes is shown in Supplemental Table 2), 7 hub genes (CDK1, TOP2A, CDC20, KIF11, CCNA2, NUSAP1, and KIF2C) were identified. The sub-network of these genes is shown in Figure 5A.

Identification of Hub genes and qRT-PCR validation. (A) PPI sub-network of the 5 hub genes. (B) The expression levels of the 7 hub genes found in ATC and normal thyroid clinical specimens.
To validate the expression of the identified hub genes, we performed qRT-PCR on 8 ATC and 30 normal thyroid clinical samples. As shown in Figure 5B, the relative expression levels of CDK1, TOP2A, CDC20, KIF11, CCNA2, NUSAP1, and KIF2C in ATC samples were significantly higher than those in normal thyroid samples (P < 0.05), and this result was consistent with the results of the bioinformatics analysis.
Discussion
In the present study, a total of 420 DEGs that included 178 upregulated and 242 downregulated genes were identified from 2 microarray datasets of ATC. The results of GO and KEGG enrichment analyses suggested that the DEGs were strongly associated with cell cycle, cell adhesion, and various cancer-related signaling pathways. According to the STRING database, a PPI network of the proteins encoded by the DEGs was constructed, and module analysis was performed to explore the functional clusters. Thereafter, 7 hub genes (CDK1, TOP2A, CDC20, KIF11, CCNA2, NUSAP1, and KIF2C) were identified from the whole PPI network using the MCC method, and the expression of these hub genes was validated using qRT-PCR on clinical specimens.
During the last few decades, the development and widespread application of high-throughput technologies, such as microarray and RNA-sequencing, have provided a novel understanding of the molecular complexity of ATC. To date, several studies examining DEGs in ATC have been performed. For example, in a study based on 3 GEO datasets of ATC, 10 hub genes were identified, including CDK1, CCNB1, TOP2A, AURKB, CCNA2, BUB1, AURKA, CDC20, MAD2L1, and BUB1B. 23 Among those genes, CDK1, TOP2A, CCNA2, and CDC20 were also identified as hub genes in our study. Another bioinformatics analysis of the ATC transcriptome 24 involved 4 GEO datasets and identified 7 hub genes (CDK1, CCNB2, BUB1B, CDC20, RRM2, CHEK1, and CDC45). However, only CDK1 and CDC20 were present in our results. Taken together, the overlapping hub genes among these studies are more likely to play key roles in ATC tumorigenesis and/or progression; however, validation of their diagnostic and prognostic values is still required. Moreover, in contrast to these similar studies, we employed the RRA method to identify the common DEGs from 2 unique datasets, as this method is more robust in regard to outliers. Moreover, we performed qRT-PCR on clinical specimens to validate the expression of hub genes, ultimately lending more credibility to our results.
It has been demonstrated that the identified hub genes play important roles in various cancer-related biological processes. First, CDK1 has been recognized as a key gene involved in cell cycle regulation. 25 The protein it encodes is a member of the Ser/Thr protein kinase family, and this protein is essential for G1/S and G2/M phase transitions. 26 It has been recognized that CDK1 activity is dysregulated in tumorigenesis and is generally associated with a more aggressive cancer phenotype. 27 For thyroid cancer, it was reported that CDK1 inhibition could induce cell cycle arrest in the G2/M phase and also suppressed TC cell proliferation. 28 Another cell cycle-related hub gene, CCNA2, encodes cyclin A2, which belongs to the highly conserved cyclin family. 29 This protein activates the cyclin-dependent kinases Cdk1 and Cdk2 and is expressed at elevated levels from S phase until early mitosis. 30 Cyclin A2 expression is associated with poor prognosis in acute leukemia, non-small cell lung cancer, breast cancer, hepatocellular carcinoma, thyroid cancer, and other cancers. 31
TOP2A encodes a DNA topoisomerase and is essential for DNA transcription and replication. 32 It has been reported that this topoisomerase could function as a target for anti-cancer therapy, and a variety of mutations in this gene are associated with the development of drug resistance. 33 -35 Moreover, TOP2A is commonly amplified in thyroid cancer according to the COSMIC and cBioPortal databases, and the mutational frequency is approximately 1%. CDC20 encodes a protein that acts as a regulatory factor for multiple mitotic processes 36 ; this protein has been reported in various malignancies and plays a vital role in tumorigenesis and progression. 37 The last 3 hub genes, KIF2C, KIF11, and NUSAP1, encode proteins that function in various mitotic processes, including chromosome segregation, centrosome separation, spindle microtubule organization, and depolymerization. 37 -40 Multiple studies have suggested that these genes promote cell proliferation and are correlated with poor prognosis in various malignancies such as esophageal squamous cell carcinoma, breast cancer, renal cell carcinoma, cervical carcinoma, and colon cancer. 41 -45 According to existing studies, the identified hub genes are all recognized as oncogenes that promote cell proliferation primarily by regulating the cell cycle and mitosis. In combination with the above observations, we consider these genes as potential key genes involved in ATC development.
To the best of our knowledge, our study is the first to perform a combined bioinformatics analysis of multiple transcriptome microarray datasets from ATC using the RRA method. This algorithm is parameter-free and robust to outliers, noise, and errors. Therefore, the results of our study are interfered with less by confounding factors and are more credible. In contrast, our study does have several limitations. First, comparisons are made between ATC and normal thyroid tissues. It is more appropriate to perform differential expression analysis between ATC and well-differentiated thyroid cancer specimens; however, we could not obtain suitable microarray datasets to date. Further validation is required. Second, as the GEO database does not provide survival data, the prognostic values of the hub genes were not evaluated. Moreover, the hub genes were primarily identified using bioinformatics analysis, and based on this, wet-lab experiments should be performed to validate the function of these genes in vitro and in vivo.
Conclusions
Our study identified 7 hub genes from the PPI network, and we validated their expression in clinical samples. The present study provides a novel understanding of ATC development, and further studies are urgently needed to elucidate the underlying mechanisms of these hub genes.
Supplemental Material
Supplemental Material, Supplementary_Table_1 - Identification of Hub Genes in Anaplastic Thyroid Carcinoma: Evidence From Bioinformatics Analysis
Supplemental Material, Supplementary_Table_1 for Identification of Hub Genes in Anaplastic Thyroid Carcinoma: Evidence From Bioinformatics Analysis by Liqi Li, Mingjie Zhu, Hu Huang, Junqiang Wu and Dong Meng in Technology in Cancer Research & Treatment
Supplemental Material
Supplemental Material, Supplementary_Table_2 - Identification of Hub Genes in Anaplastic Thyroid Carcinoma: Evidence From Bioinformatics Analysis
Supplemental Material, Supplementary_Table_2 for Identification of Hub Genes in Anaplastic Thyroid Carcinoma: Evidence From Bioinformatics Analysis by Liqi Li, Mingjie Zhu, Hu Huang, Junqiang Wu and Dong Meng in Technology in Cancer Research & Treatment
Footnotes
Abbreviations
Declaration of Conflicting Interests
The author(s) declared no potential conflicts of interest with respect to the research, authorship, and/or publication of this article.
Ethics approval and consent to participate
All procedures performed in studies involving human participants were in accordance with the 1964 Helsinki declaration and its later amendments or comparable ethical standards. Each patient enrolled in this study has signed informed consent, and this study was approved by the ethical committee of the Affiliated Hospital of Jiangnan University.
Funding
The author(s) received no financial support for the research, authorship, and/or publication of this article.
Supplemental Material
Supplemental material for this article is available online.
References
Supplementary Material
Please find the following supplemental material available below.
For Open Access articles published under a Creative Commons License, all supplemental material carries the same license as the article it is associated with.
For non-Open Access articles published, all supplemental material carries a non-exclusive license, and permission requests for re-use of supplemental material or any part of supplemental material shall be sent directly to the copyright owner as specified in the copyright notice associated with the article.