
Abstract
This study was designed to identify novel circular RNAs and the related regulatory axis to provide research targets for the diagnosis and treatment of breast cancer. The circular RNA expression microarray “GSE101123” related to breast cancer was downloaded from the Gene Expression Omnibus database. The differentially expressed circular RNAs between tumor and normal samples were screened using Limma package. The targeted microRNAs of the differentially expressed circular RNAs and the targeted messenger RNAs of the microRNAs were predicted using miRanda and miRWalk, respectively, and a circular RNAs–microRNAs–messenger RNAs network was constructed. Then, functional enrichment analysis, protein–protein interaction network construction, and drug–gene interaction analysis were conducted for the messenger RNAs. A total of 11 differentially expressed circular RNAs were identified between the breast cancer and normal samples, of which 3 were upregulated, while 8 were downregulated. The circular RNA–microRNA–messenger RNA network contained 1 circular RNA (hsa_circ_0000376), 2 microRNAs (miR-1285-3p and miR-1286), and 353 messenger RNAs. The protein–protein interaction network contained 150 nodes and 240 interactions. The hub genes in the protein–protein interaction network were all targeted messenger RNAs of miR-1285-3p that were significantly enriched in the ubiquitin–proteasome system, apoptosis, cell cycle arrest–related pathways, and cancer-related pathways involving SMAD specific E3 ubiquitin protein ligase 1, β-transducin repeat containing E3 ubiquitin protein ligase, tumor protein P53 among others. Twenty-two drugs were predicted to target 4 messenger RNAs, including tumor protein P53. A novel circular RNA, hsa_circ_0000376, was identified in breast cancer that may act as a sponge targeting miR-1285-3p expression which through its target genes, SMURF1, BTRC, and TP53, may further regulate tumorigenesis.
Keywords
Introduction
Circular RNA (circRNA) is a kind of endogenous RNA without a 5′ cap or 3′ poly (A) tail that forms a closed continuous loop structure through covalent bonds. 1 Recently, with the advances in high-throughput sequencing and bioinformatics, abundant circRNAs have been identified in the eukaryotic transcriptome that plays crucial roles in the regulation of gene expression at transcriptional and posttranscriptional levels through binding to microRNAs (miRNAs) or other RNA-associated proteins. 2 Circular RNAs are derived from exons or introns through a back splicing process and are characterized as being conserved and stable. 3 Circular RNAs are implicated in the development of various cancers through a competing endogenous RNA (ceRNA) mechanism in which the circRNAs serve as miRNA sponges. 2 For example, circ_0067934 acts as a sponge inhibiting miR-1324 expression which regulates its target gene, frizzled class receptor 5 (FZD5), to further regulate the progression of hepatocellular carcinoma. 4
Breast cancer is the most common cancer in women and is considered as a great public health problem worldwide. 5 The incidence and mortality of breast cancer presents an increasing trend, and breast cancer–related mortality has increased by nearly 18% since 2008. 6 Recently, increasing number of studies have demonstrated that circRNAs play a crucial role in breast cancer. Circular RNAs can provide promising diagnostic value in breast cancer. 7 Liang et al reported overexpression of circABCB10 in breast cancer that accelerates tumor progression by targeting miR-1271. 8 In addition, circAGFG1 was found to be upregulated in triple-negative breast cancer (TNBC) and accelerates tumor progression through the circAGFG1–miR-195-5p–cyclin E1 regulatory axis, and the level of circAGFG1 was related to the tumor stage, grade, and unfavorable prognosis. 9 Nevertheless, there are several uncharacterized circRNAs that still need to be investigated. Therefore, we intended to identify novel circRNAs and the related regulatory axis to further provide research targets and theoretical basis for the diagnosis and treatment of breast cancer. In our study, we used the circRNA expression microarray data set “GSE101123” (contributed by Xu and Chen in July 2018). We first screened the differentially expressed circRNAs (DE-circRNAs) between the tumor and normal samples that were then used to predict the targeted interactions to further construct the DE-circRNAs–miRNAs–messenger RNA (mRNA) regulatory network. Finally, functional enrichment analysis, protein–protein interactions (PPI) network construction, and drug–gene interaction analysis were performed for the mRNA.
Materials and Methods
Microarray Data
The circRNA expression microarray data set “GSE101123” related to breast cancer was downloaded from the Gene Expression Omnibus database (http://www.ncbi.nlm.nih.gov/geo/) and contained 8 breast cancer tissue samples and 3 normal mammary gland tissue samples. The platform used was GPL19978 Agilent-069978 Arraystar Human CircRNA microarray V1.
Data Preprocessing and Identification of DE-circRNAs
The raw data were read using the Limma package 10 (Version 3.10.3, http://www.bioconductor.org/packages/2.9/bioc/html/limma.html), and the data were preprocessed using robust multi-array average method, including background correction, normalization, and expression calculation. The probes were matched to gene symbols based on the annotation files from the platform, in which, the probes were removed without the corresponding gene symbol, while the mean expression value was considered as the final expression value of this circRNA when multiple probes matched the gene symbol. The classical Bayes test in limma package was used to perform the DE analysis, and the DE-circRNAs were identified using the threshold of adjusted P value <0.05 and |log fold changes (FC)| >2. Differentially expressed circRNAs were converted into universal name based on circBase, heatmaps, and volcano plots of the DE-circRNAs were constructed using the matrix data.
Differentially Expressed circRNA–miRNA–Target Regulatory Associations
The targeted miRNAs of DE-circRNAs were predicted using miRanda (Version: 3.3a, https://omictools.com/miranda-tool) with the parameter setting of score >170 and energy <−30. Then, the targeted genes of the miRNAs above were predicted using miRWalk2.0 11 (http://zmf.umm.uni-heidelberg.de/apps/zmf/mirwalk 2 /) with the following parameter setting (species: human; other databases: miRWalk, miRanda, miRDB, miRMap, Pictar2, RNA22, and Targetscan; retrieval relation: AND). The target genes that emerged in more than 6 databases were selected. Finally, the DE-circRNA–miRNA–target regulatory network was constructed based on the DE-circRNA–miRNA regulatory pairs and miRNA–target regulatory pairs.
Functional Enrichment Analysis of Target Genes
The functional enrichment analysis of target genes was performed using Database for Annotation, Visualization, and Integrated Discovery (DAVID; Version 6.8, https://david-d.ncifcrf.gov/), including biological processes in Gene ontology (GO) terms and Kyoto Encyclopedia of Genes and Genomes (KEGG) signaling pathways. The enrichment genes count was set as ≥2, and the P value <0.05 were selected to identify the significantly enriched results.
Protein–Protein Interaction Network of Target Genes
The interactions pairs between target genes were retrieved from the search tool for the retrieval of interacting genes (STRING) database (Version: 10.0, http://www.string-db.org/) with PPI score setting as 0.4 (median confidence). Then, based on the interactions pairs, the PPI network was visualized using Cytoscape (version 3.2.0, http://www.cytoscape.org/), and the topological properties of PPI network were analyzed using CytoNCA plugin 12 (Version 2.1.6, http://apps.cytoscape.org/apps/cytonca), with the parameter setting of “without weight.” The hub genes were identified based on the degree score of the nodes in the network. In addition, the functional enrichment analysis was performed for the top 10 hub genes using the method mentioned above.
Drug–Gene Interaction Analysis
The drug–gene interaction database (DGIdb) is an open public information platform of known and potential drug–gene interactions. Here, the drug–gene interactions were predicted for the top 10 hub genes mentioned above using DGIdb 2.0 13 (http://www.dgidb.org/) with default parameters, and the databases were limited to DrugBank and Food and Drug Administration. Then, based on the drug–gene interactions, the network was visualized using Cytoscape.
Tissue Samples and Quantitative Polymerase Chain Reaction
Ten luminal A breast cancer samples, 10 TNBC samples, and 10 nontumor breast samples were collected from The First Affiliated Hospital of China Medical University (April 2019 to October 2019). The nontumor breast samples were obtained from a minimum of 5 cm distance from the tumor. All samples were confirmed by histopathology and none of the patients had received neoadjuvant chemotherapy before the surgery. The samples were approved by the Ethics Committee of First Affiliated Hospital of Chinese University of Science.
Total RNA was extracted using TRIzol reagent. The TaKaRa PrimeScript RT reagent Kit with gDNA Eraser was used to reverse transcribe the RNA. The reactions were run in an Applied Biosystems 7500 Real-Time PCR System (Thermo Fisher Scientific). U6 was chosen as the reference gene. The sequences of primers used for miR-1285-3p were Forward 5′-GCGTCTGGGCAACAAAGTG-3′, Reverse 5′-AGTGCAGGGTCCGAGGTATT-3′, and RT-GTCGTATCCAGTGCAGGGTCCGAGGTATTCGCACTGGATACGACAGGTCT. The sequences of the primers used for miR-1286 were Forward 5′-CGCGTGCAGGACCAAGATG-3′, Reverse 5′-AGTGCAGGGTCCGAGGTATT-3′, and RT-GTCGTATCCAGTGCAGGGTCCGAGGTATTCGCACTGGATACGACAGGGCT. Quantitative polymerase chain reaction (qPCR) data were analyzed using relative quantification or ΔΔCt method based on mRNA copy number ratio (R) of target gene versus reference genes U6 in each tumor sample relative to another reference sample.
Results
Identification of DE-circRNAs
We first performed principal component analysis on the standardized matrix data, and the tumor sample (T04) that seriously deviated was removed in the following analysis (Figure 1A). A total of 11 DE-circRNAs were identified between tumor and normal samples, including 3 upregulated and 8 downregulated DE-circRNAs. As shown in the heatmaps and volcano plot of the DE-circRNAs in Figure 1B and C, the DE-circRNAs could clearly distinguish the samples, suggesting that it was significant for further analysis.

The results of differential expression analysis. A, PCA before and after data standardization preprocessing; B, Heatmaps of the DE-circRNAs; C, Volcano plot of the DE-circRNAs. DE-circRNAs indicates differentially expressed circRNAs; PCA, principal component analysis.
Differentially Expressed circRNA–miRNA–Target Regulatory Network
In all, 14 DE-circRNA–miRNA interaction pairs and 349 miRNA–target interaction pairs were obtained. A total of 351 DE-circRNA–miRNA–target regulatory associations were included based on the overlapped miRNAs, including 2 DE-circRNA–miRNA interaction pairs and 349 miRNA–target interaction pairs. The DE-circRNA–miRNA–target regulatory network was constructed based on the 351 DE-circRNA–miRNA–target regulatory associations (Figure 2), and there were 356 nodes in the network, including 1 DE-circRNA (hsa_circ_0000376), 2 miRNAs (miR-1285-3p and miR-1286), and 353 target genes.

The circRNAs–miRNAs–mRNA regulatory network. Green squares represent circRNAs; red triangles represent miRNAs; yellow circles represent mRNAs. circRNA indicates circular RNA; miRNA, microRNA; mRNA, messenger RNA.
Functional Enrichment Analysis of Target Genes
Functional enrichment analysis was performed to further explore the biological processes (BPs) and pathways of target genes involved using DAVID. A total of 30 GO_BPs and 9 KEGG pathways were significantly enriched for the target genes of miR-1285-3p, such as, “GO:0045944 ∼ positive regulation of transcription from RNA polymerase II promoter,” “GO:0043161 ∼ proteasome-mediated ubiquitin-dependent protein catabolic process,” and “hsa04144: Endocytosis.” Similarly, 10 GO_BPs and 1 KEGG pathways were significantly enriched for the target genes of miR-1286, such as “GO:0006396 ∼ RNA processing,” “GO:0007399 ∼ nervous system development,” and “hsa04022: cGMP-PKG signaling pathway.” The top 10 significantly enriched Gene ontology–biological processes (GO-BPs) and KEGG pathways are listed in Table 1.
The Results of Functional Enrichment Analysis for the Target Genes.

Abbreviations: BP, biological process; BTRC, β-transducin repeat containing E3 ubiquitin protein ligase; GO, Gene ontology; GSK3, glycogen synthase kinase 3; KEGG, Kyoto Encyclopedia of Genes and Genomes; mRNA, messenger RNA; PIK3R1, phosphoinositide-3-kinase regulatory subunit 1; PML, promyelocytic leukemia; SMURF1, SMAD specific E3 ubiquitin protein ligase 1; TP53, tumor protein P53.
Protein–Protein Interaction Network of Target Genes
The PPI network contained 150 nodes and 240 interactions (Figure 3). The top 10 hub nodes with high degrees were all target genes of miR-1285-3p (Table 2). Ubiquitin A-52 residue ribosomal protein fusion product 1 (UBA52) had the highest degree in the PPI network, followed by tumor protein P53 (TP53) and glycogen synthase kinase 3 beta (GSK3B).
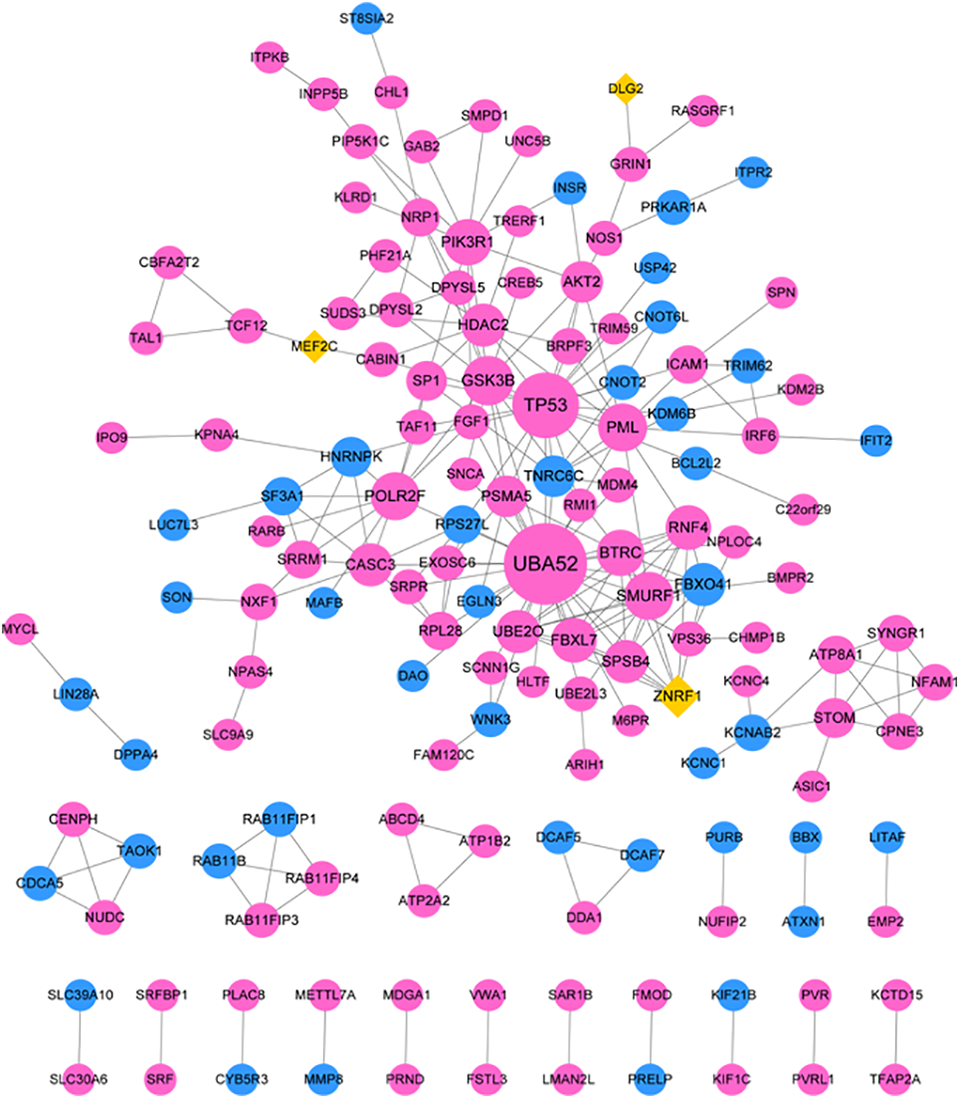
The PPI network of mRNAs. Blue circles represent the targeted mRNAs of miR-1286; purple circles represent the targeted mRNAs of miR-1285-3p; yellow rhombuses represent the overlapping targeted mRNAs of miR-1285-3p and miR-1286. mRNA indicates messenger RNA; PPI, protein–protein interaction.
The Top 10 Nodes in the PPI Network Ranked by Degree.
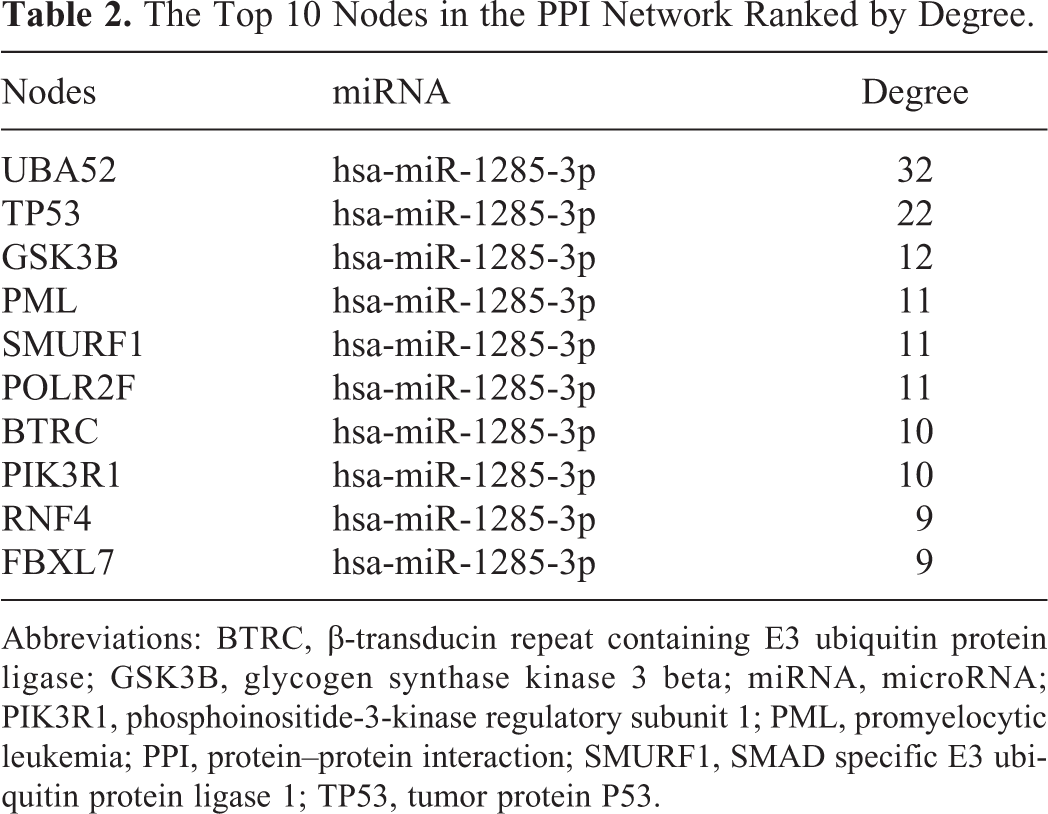
Abbreviations: BTRC, β-transducin repeat containing E3 ubiquitin protein ligase; GSK3B, glycogen synthase kinase 3 beta; miRNA, microRNA; PIK3R1, phosphoinositide-3-kinase regulatory subunit 1; PML, promyelocytic leukemia; PPI, protein–protein interaction; SMURF1, SMAD specific E3 ubiquitin protein ligase 1; TP53, tumor protein P53.
Functional enrichment analysis was performed to further explore the functions of the top 10 hub genes. A total of 14 KEGG pathways and 37 GO-BPs were significantly enriched for the top 10 hub genes in PPI network, and the top 10 significantly enriched GO-BPs and KEGG pathways are listed in Table 3. Beta-transducin repeat containing E3 ubiquitin protein ligase (BTRC), promyelocytic leukemia (PML), and SMAD specific E3 ubiquitin protein ligase 1 (SMURF1) were significantly enriched in “hsa04120: Ubiquitin mediated proteolysis,” while BTRC, GSK3B, and TP53 were significantly enriched in “hsa04310: Wnt signaling pathway.” In addition, it was observed that GSK3B, TP53, and phosphoinositide-3-kinase regulatory subunit 1 (PIK3R1) were significantly enriched in various cancers or diseases. In addition, “GO:0043161 ∼ proteasome-mediated ubiquitin-dependent protein catabolic process” was the most significant enriched GO_BP, involving GSK3B, SMURF1, TP53, among others.
The Results of Functional Enrichment Analysis for the Top 10 Hub Genes in PPI Network.

Abbreviations: BP, biological process; BTRC, β-transducin repeat containing E3 ubiquitin protein ligase; GO, Gene ontology; GSK3B, glycogen synthase kinase 3 beta; KEGG, Kyoto Encyclopedia of Genes and Genomes; PIK3R1, phosphoinositide-3-kinase regulatory subunit 1; PML, promyelocytic leukemia; PPI, protein–protein interaction; SMURF1, SMAD specific E3 ubiquitin protein ligase 1; TP53, tumor protein P53.
Drug–Gene Interaction Analysis
In addition, 22 drugs were predicted to be implicated with the 4 target genes of miR-1285-3p using DGIdb, including GSK3B, PIK3R1, TP53, and PML (Figure 4, Table 4). Isoprenaline and SF-1126 were predicted to be an agonist and inhibitor of PIK3B, respectively. Aspirin was predicted to regulate the acetylation of TP53, while alsterpaullone was an inhibitor of GSK3B.

The results of drug–gene interaction analysis. Purple ellipses represent targeted mRNAs of miR-1285-3p; gray squares represent the predicted drugs. mRNA indicates messenger RNA.
The Results of Drug–Gene Interaction Analysis.

Abbreviations: FDA, Food and Drug Administration; GSK3B, glycogen synthase kinase 3 beta; NA, not available; PIK3R1, phosphoinositide-3-kinase regulatory subunit 1; PML, promyelocytic leukemia; TP53, tumor protein P53.
Evaluation of Genes by qPCR
Quantitative polymerase chain reaction was used to detect the expression of miR-1285-3p and miR-1286 in cancer tissues and normal tissues. As shown in Figure 5, the expression level of miR-1285-3p in the tumor tissue was significantly lower than in the control (P < .05). The expression of miR-1286 in luminal A breast tissue and triple-negative tumor tissue was significantly lower than in the control (P < .05).

Relative expression level of miRNAs in tissues. A, Relative expression level of miR-1285-3p in tissues; B, Relative expression level of miR-1286 in tissues. Control represents the nontumor breast tissues; LA indicates luminal A breast tissues; TC, triple-negative breast cancer tissues. miRNA, microRNA.
Discussion
In the current study, 11 DE-circRNAs were screened between breast cancer samples and normal samples, while only one circRNA was identified in the circRNA–miRNA–mRNA regulatory network, that was hsa_circ_0000376, a novel circRNA found to be downregulated in breast cancer. MiR-1285-3p and miR-1286 are hsa_circ_0000376 targets, and the targeted mRNAs of miR-1285-3p were the hub genes in PPI network that were significantly enriched in ubiquitin–proteasome system, apoptosis, and cell cycle arrest–related pathways and cancer-related pathways, involving SMURF1, BTRC, TP53, and other genes. In addition, the drugs including SF-1126 and aspirin were predicted to target PIK3B and TP53, and these drugs had been reported in the treatment of breast cancer in previous studies. 2 For example, Deng et al indicated that a combination of SF1126 and gefitinib triggered apoptosis in TNBC cells through the PI3K/AKT-mTOR pathway. 14
MiR-1285 was first identified from a massive parallel sequencing of human embryonic stem cells. 15 It was reported that the expression of tumor suppressor p53 was repressed by miR-1285 ectopic expression, while its expression decreases upon depletion of miR-1285 in the cells of human neuroblastoma, hepatoblastoma, and breast cancer. 16 Gao et al indicated that downregulation of miR-1285 was observed in stage I lung squamous cell carcinoma and could be considered as a promising diagnostic biomarkers. 17 In addition, the proliferation, migration, and invasion of pancreatic cancer cells were significantly inhibited by miR-1285 through targeting Yes Associated Protein 1, showing a tumor suppressor role. 18 Further, a previous study revealed that miR-1285-3p expression was decreased in the plasma of hepatocellular carcinoma and could be used to predict the prognosis of patients receiving transarterial chemoembolization. Meanwhile, miR-1285-3p can also inhibit the expression of v-jun avian sarcona virus 17 oncogene homolog (JUN) oncogene in hepatocellular carcinoma cells, which suggests that it has a tumor suppressive effect. 19 However, few studies have reported the functions of miR-1285-3p in breast cancer. In our study, miR-1285-3p was the target of hsa_circ_0000376, and we speculated that hsa_circ_0000376 might be involved in the progression of breast cancer by targeting miR-1285-3p. In this study, we have detected the expression of miR-1285-3p and miR-1286 in cancer and normal tissues, and the result indicates that these 2 miRNAs showed lower expression level in cancer tissues than normal tissue.
Notably, the targeted mRNAs of miR-1285-3p were significantly enriched in ubiquitin–proteasome system, apoptosis, and cell cycle arrest–related pathways. Vriend and Reiter reported in a review that BRCA1, a susceptibility gene, served as an ubiquitin ligase, and suggested that ubiquitin–proteasome system was associated with the regulation of breast cancer susceptibility. 20 In addition, several studies have reported the role of ubiquitin–proteasome system in breast cancer. 2 In our study, SMURF1, BTRC, and TP53 were enriched in ubiquitin–proteasome system-related BPs and pathways. SMURF1 encodes an E3 ubiquitin ligase that regulates SMAD ubiquitination and degradation. 21 Fukunaga et al revealed that SMURF1 expression was improved by SMURF2 knockdown that in turn increased cell migration and bone metastasis in breast cancer. 22 Yu et al indicated that the increased expression of SMURF1 by SND1 caused the ubiquitinated and degradation of RhoA which destroyed F-actin cytoskeletal structure and further accelerated metastasis in breast cancer. 23 Beta-transducin repeat containing E3 ubiquitin protein ligase, also called as β-TrCP1, is an E3-ubiquitin ligase receptor subunit that mediates protein stability and acts as a tumor inhibitor or oncogene. 24 It was reported that β-TrCP1 expression was downregulated in TNBC cells, and β-TrCP1 knockdown repressed cell proliferation, suggesting that it could be a potential target in the treatment of TNBC. 25 TP53 encodes a tumor suppressor protein which plays a crucial role in monitoring following DNA damage, and it triggers damage repair or apoptosis. 26 Reportedly, TP53 mutation was commonly found in the tumorigenesis of various cancers, including breast cancer, and TP53 germline mutation is associated with highly increased risk of developing breast cancer. 27 TP53 polymorphisms are related to the risk and type of breast cancer and could be a prognostic biomarker. 28 Hereby, we concluded that hsa_circ_0000376 could target the expression of miR-1285-3p to further regulate cell proliferation, metastasis, and tumorigenesis of breast cancer. The target genes of miR-1285-3p are SMURF1, BTRC, and TP53. A novel circRNA, hsa_circ_0000376, and its related ceRNA mechanism were identified in our study; however, experimental verification is needed to further confirm the role of this circRNA and its related regulatory mechanism in breast cancer. In addition, there are many target genes of miR-1285-3p. Further experiments are also needed to screen and identify the regulatory mechanisms. In addition, the predicted drugs that were not reported needed to be tested experimentally.
In conclusion, we identified a novel circRNA, hsa_circ_0000376, and its related ceRNA mechanism in breast cancer. hsa_circ_0000376 might be a sponge, firstly targeted the expression of miR-1285-3p which mediates its target genes, SMURF1, BTRC, and TP53, to further regulate cell proliferation, metastasis, and tumorigenesis of breast cancer.
Footnotes
Abbreviations
Authors’ Note
Not applicable. Our study did not contain human or animal trials.
Declaration of Conflicting Interests
The author(s) declared no potential conflicts of interest with respect to the research, authorship, and/or publication of this article.
Funding
The author(s) disclosed receipt of the following financial support for the research, authorship, and/or publication of this article: This work was supported by National Natural Science Foundation of China (grant number 81773163).