
Abstract
Background:
Rhabdomyosarcoma is the most common soft tissue tumor in children. Rhabdomyosarcoma commonly results in pain and bleeding caused by tumor compression and is prone to early metastasis and recurrence, which can seriously affect the therapeutic outcomes and long-term prognosis. Up to 37.7% of rhabdomyosarcomas may metastasize. Therefore, the molecular mechanisms underlying rhabdomyosarcoma must be explored to identify an effective target for its early diagnosis and specific treatment.
Methods:
A dataset of 18 rhabdomyosarcoma tissue samples and 6 healthy skeletal muscle samples was downloaded. Differentially expressed genes between rhabdomyosarcoma and healthy tissue samples were identified by GEO2R. Kyoto Encyclopedia of Genes and Genomes and gene ontology pathway enrichment analyses were performed. A protein–protein interaction network was constructed, and hub genes were identified. Expression and survival analyses of hub genes were performed. Additionally, 30 patients with rhabdomyosarcoma were recruited, and overall survival information and samples were collected. Reverse transcription quantitative real-time polymerase chain reaction assays were performed to verify the expression of MYBPC2 and MYL1 in rhabdomyosarcoma tumor tissues. The Kaplan–Meier method was used to explore overall survival based on our clinical data.
Results:
In total, 164 genes were up-regulated and 394 were down-regulated in rhabdomyosarcoma tumor tissues. Gene ontology analysis revealed that variations were predominantly enriched in the cell cycle, muscle contraction, muscle system processes, cytoskeleton, nucleotide binding, and cytoskeletal protein binding. The protein–protein interaction network revealed 3274 edges, and 441 nodes were constructed. Ten hub genes were identified; of these, MYBPC2 and MYL1 were significantly up-regulated in rhabdomyosarcoma. Compared with the healthy group, patients with rhabdomyosarcoma exhibiting high expression of MYBPC2 and MYL1 exhibited significantly worse overall survival.
Conclusions:
We found differentially expressed genes between rhabdomyosarcoma and healthy tissue samples. MYBPC2 and MYL1 may be involved in the pathogenesis of rhabdomyosarcoma and therefore deserve further exploration.
Keywords
Introduction
Rhabdomyosarcoma is a malignant soft tissue tumor originating in rhabdomyocytes or myoblast satellite cells. It is the most common soft tissue sarcoma in children. 1 The symptoms of rhabdomyosarcoma mainly depend on the location of the disease and the type of tissue and can include pain and bleeding caused by tumor compression. 2 The incidence of rhabdomyosarcoma is about 6 cases per million people per year, accounting for about half of all soft tissue sarcomas in children and 2% of adult soft tissue sarcomas. 3,4 The outcome of rhabdomyosarcoma is often worse in adults than in children. 5 However, the pathogenesis of rhabdomyosarcoma remains controversial. Genetic, environmental, and other factors are thought to be involved in the occurrence and development of rhabdomyosarcoma. 6 The incidence of rhabdomyosarcoma in patients with multiple neurofibroma is 20 times higher than that in the general population, suggesting that these diseases may have common pathophysiological changes. 7 Furthermore, Gasparini et al. 8 suggested that multiple microRNAs may be involved in the occurrence and development of rhabdomyosarcoma by regulating the function of skeletal muscle cells. These microRNAs can also be used as targets for early diagnosis and treatment. 8 Surgical resection is the main treatment for rhabdomyosarcoma. Because the tumor is prone to recurrence, chemotherapy and radiotherapy are also necessary. Monoclonal antibodies, such as bevacizumab and temsirolimus, may also improve the prognosis of patients with rhabdomyosarcoma. 9 In fact, the cure rate of localized rhabdomyosarcoma under combined therapy in children is higher than 70%. 10 However, patients with rhabdomyosarcoma are prone to develop metastases to the bone, lungs, and distant lymph nodes. A retrospective study showed that up to 37.7% of rhabdomyosarcomas may metastasize. 11 Therefore, it is clinically important to further explore the molecular mechanisms underlying rhabdomyosarcoma to identify a more effective target for its early diagnosis and specific treatment.
Cooper et al. 12 found that the expression levels of MyoD1 and myogenin in rhabdomyosarcoma were positively correlated with the degree of tumor malignancy (P < 0.05). Higher degrees of rhabdomyosarcoma malignity were associated with greater expression of MyoD1 and myogenin. The expression of MyoD1 and myogenin significantly differs between childhood rhabdomyosarcoma and other small cell malignant tumors; therefore, it can be inferred that MyoD1 and myogenin might be used to assist in the differentiation between these two types of tumors and that they may serve as important molecular markers for the pathological diagnosis of rhabdomyosarcoma. 13,14 The MyoD1 and myogenin expression levels in rhabdomyosarcoma are significantly correlated with its prognosis. One study showed that among patients with rhabdomyosarcoma, these expression levels were significantly higher in those with a poor prognosis than in those with a better prognosis, and increased MyoD1 and myogenin expression levels were significantly correlated with a poor prognosis for rhabdomyosarcoma. 15 However, none of this research was based on the matrix method, a type of bioinformatics analysis.
Bioinformatics analysis is a reliable means of identifying targets for diagnosis and treatment. It is widely used to find genetic changes involved in the processes of tumorigenesis and development. Zhang et al. 16 analyzed whole-genome miRNA microarray data of patients with gastric cancer and found the most related molecules were miR-19b-3p and miR-16-5p, providing new avenues for the diagnosis and treatment of gastric cancer. In another study using bioinformatics analysis, Zhang et al. 17 found abnormally expressed genes in patients with melanoma, and further verification showed that molecules such as CXCL8 and hsa-miR-375 were involved in the occurrence and development of melanoma, providing new clues for the study of melanoma. Stewart et al. 18 used transcriptomics and proteomics to identify several abnormally expressed molecules in patients with rhabdomyosarcoma. Further analysis showed that the WEE1 kinase targeting the G2/M pathway may be a potential therapeutic target for rhabdomyosarcoma. 18 Searching for prognostic biomarkers of rhabdomyosarcoma can provide the basis for individualized and targeted therapies, leading to improvement in the long-term prognosis of patients. 19 Li et al. 20 found that CCNB1 and CDK1 may be used as early diagnostic biomarkers for rhabdomyosarcoma, providing evidence for the early diagnosis and treatment of rhabdomyosarcoma. However, little research has focused on rhabdomyosarcoma biomarkers.
In the present study, we used bioinformatics analysis to screen differentially expressed genes (DEGs) of rhabdomyosarcoma relative to peritumoral healthy tissues. Gene ontology (GO) analysis and Kyoto Encyclopedia of Genes and Genomes (KEGG) analysis of DEGs were performed. A protein–protein interaction (PPI) network of the DEGs was then constructed. In addition, data from The Cancer Genome Atlas (TCGA) database were downloaded, and the expression of hub genes and their effects on the prognosis of patients with sarcoma were analyzed. We also collected tissue samples from patients with rhabdomyosarcoma and sequenced them to verify the expression of related hub genes. Finally, we performed a preliminary analysis of the role of DEGs in rhabdomyosarcoma.
Materials and Methods
Access to Public Data
The Gene Expression Omnibus (GEO) (http://www.ncbi.nlm.nih.gov/geo) is an open source platform for the storage of genetic data. 21 An expression profile dataset [GSE28511 (GPL6947 platform)] was downloaded from the GEO database. The dataset included 18 rhabdomyosarcoma tissue samples and 6 healthy skeletal muscle samples. If the sample size in each group is more than 3, then repeatability is satisfied. If the sample size in each group is more than 6, the error value is small. Therefore, in this study, 18 rhabdomyosarcoma tissue samples were selected in the experimental group and 6 healthy skeletal muscle samples were selected in the healthy group. All samples in the dataset were selected for this study. Although the sample size was small, the analysis used was rigorous, and the TCGA database was used to verify the impact of the hub genes on the long-term prognosis of rhabdomyosarcoma.
DEGs Identified Using GEO2R
GEO2R (https://www.ncbi.nlm.nih.gov/geo/geo2r/) is an interactive online tool used to identify DEGs in datasets from the GEO. 22 GEO2R can also be used to distinguish DEGs between rhabdomyosarcoma and healthy tissue samples. Volcano diagrams were delineated using SangerBox software, a tool based on the R package (http://sangerbox.com/).
Functional Annotation of DEGs Using KEGG and GO Pathway Enrichment Analyses
The Database for Annotation, Visualization, and Integrated Discovery (DAVID), version 6.8 (https://david.ncifcrf.gov/home.jsp) is an online suite of analysis tools with integrated discovery and annotation functions. 23 The GO resource is widely used in bioinformatics and covers 3 aspects of biology: biological processes, cellular components, and molecular functions. KEGG (https://www.kegg.jp/) is one of the most frequently used biological information databases worldwide. The DAVID online tool was used to perform GO and KEGG analyses of DEGs. The pathway and process enrichment analyses were performed using Metascape (http://metascape.org/gp/index.html).
Construction of PPI Network
The Search Tool for the Retrieval of Interacting Genes (http://string.embl.de/), an open source online tool, was used to construct a PPI network of the identified DEGs, and Cytoscape visualization software version 3.6.1 was used to display the network. 24 A confidence score of >0.4 was considered to be the criterion of judgment.
Identification and Analysis of Hub Genes
Molecular Complex Detection (MCODE) version 1.5.1, a Cytoscape plug-in, was used to identify the most important modules in the network map. The criteria of the MCODE analysis were as follows: degree of cutoff = 2, MCODE score > 5, maximum depth = 100, node score cutoff = 0.2, and k-score = 2. Next, cytoHubba, a free Cytoscape plug-in, was used to identify hub genes when the degrees were ≥10. The hub genes were excavated, and functional annotation of the genes was performed using KEGG and GO analyses in DAVID. The pathway and process enrichment analyses were performed using Metascape.
Expression Analysis of Hub Genes and Survival Analysis
UCSC Xena (https://xena.ucsc.edu/welcome-to-ucsc-xena/) was used to integrate public genomic datasets to analyze and visualize the expression levels of hub genes. Clustering analysis of the expression levels of hub genes was then performed using heatmaps. GEPIA is a web server for cancer and healthy gene expression profiling and interactive analyses (http://gepia.cancer-pku.cn/). 25 Survival analysis was performed using GEPIA to analyze the effect of the hub genes on overall survival (OS) in patients with sarcoma (P < 0.05). The expression of hub genes in tumors was verified by GEPIA. The expression on box plots |Log2FC| cutoff (where FC is the fold change) was 1, the P-value cutoff was 0.01, and the jitter size was 0.4. The median expression of tumor and healthy samples in bodymap was determined using GEPIA.
Reverse Transcription Quantitative Polymerase Chain Reaction (RT-qPCR) Verification
RT-qPCR assays were performed to verify the expression of hub genes in rhabdomyosarcoma tumor tissues. Thirty individuals were recruited. Following surgery, rhabdomyosarcoma tissues and adjacent mucosa tissues were obtained. This research conformed to the standards set by the Declaration of Helsinki and was authorized by the Human Ethics and Research Ethics Committees of the Hangzhou Fuyang District First People’s Hospital, China. Written informed consent was obtained from all participants.
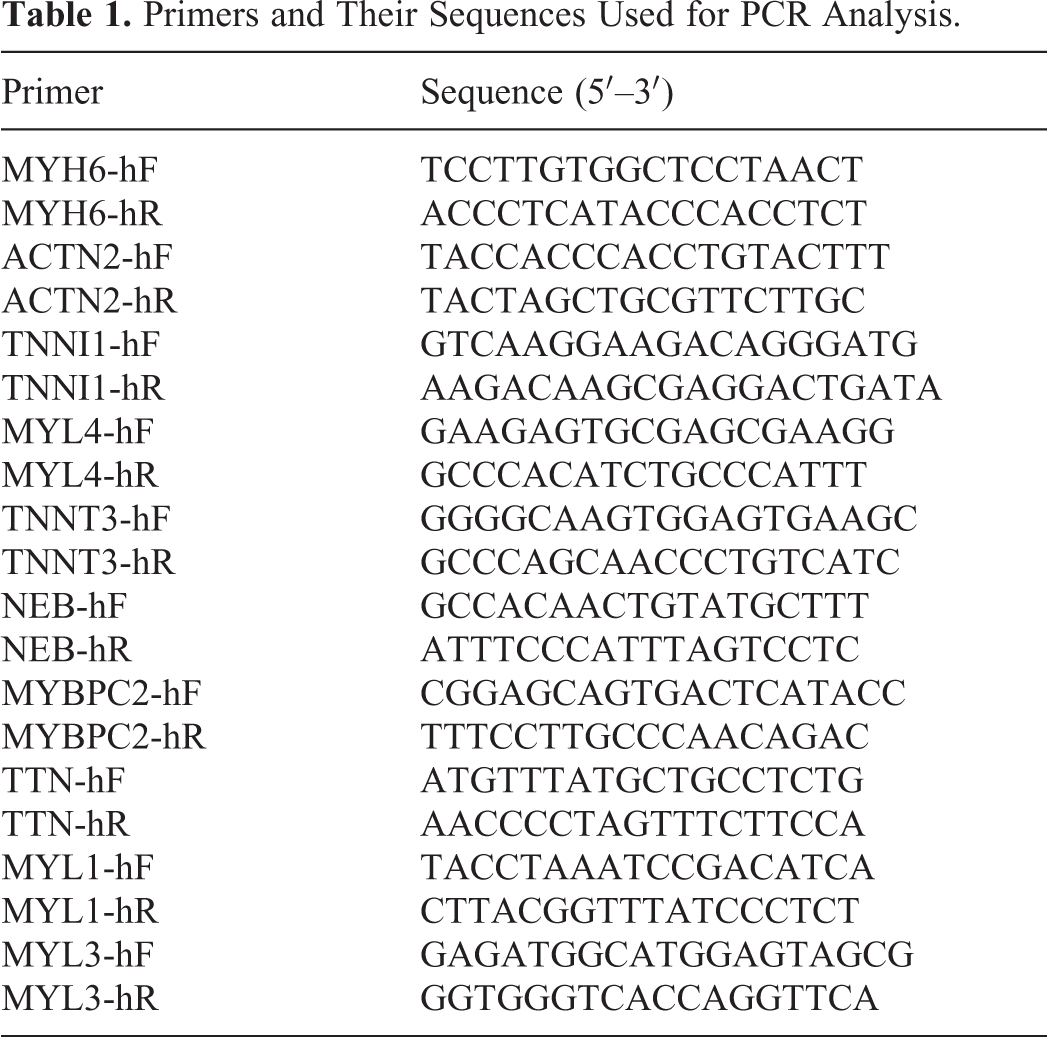
Total RNA was extracted using the RNAiso Plus (TRIzol) kit (Thermo Fisher Scientific, Waltham, MA, USA) and reverse-transcribed into cDNA. RT-qPCR was performed in a Light Cycler® 4800 System (Roche, Basel, Switzerland) with a specific set of primers (Table 1). The relative quantification units (RQ = 2−ΔΔCq, where Ct represents the quantification cycle values) of each sample were calculated and presented as fold changes in gene expression relative to the control group. Glyceraldehyde 3-phosphate dehydrogenase was used as an endogenous control.
Primers and Their Sequences Used for PCR Analysis.
Survival Analysis of Patients With Rhabdomyosarcoma
We collected clinical data from 30 patients with rhabdomyosarcoma. We then performed an OS analysis of the patients based on their MYBPC2 and MYL1 gene expression.
Statistical Analysis
P-values of the DEGs were obtained using a Bayes test based in the limma package. Values were considered statistically significant if P < 0.05 and the fold change was >2 or <−2. P-values of the DAVID analysis were obtained using Fisher’s exact test. Values were considered statistically significant if P < 0.05. The survival analysis of hub genes in GEPIA was performed based on the Cox proportional hazards model, log-rank test, and Mantel–Cox test. The PCR data are expressed as a percentage of the total and mean ± standard deviation. When 2 groups were compared, Student’s t-test was used to determine statistical significance. The least significant difference was used for the post hoc test. We used the Kaplan–Meier method to explore OS based on our own clinical data. All statistical analyses were conducted using SPSS software, version 23.0 (IBM Corp., Armonk, NY, USA). A P-value of <0.05 was considered statistically significant.
Results
Screening of DEGs Between Rhabdomyosarcoma and Healthy Tissues
Volcano diagrams were used to show the DEGs; 164 genes were up-regulated and 394 were down-regulated in rhabdomyosarcoma tumor tissues (Figure 1).
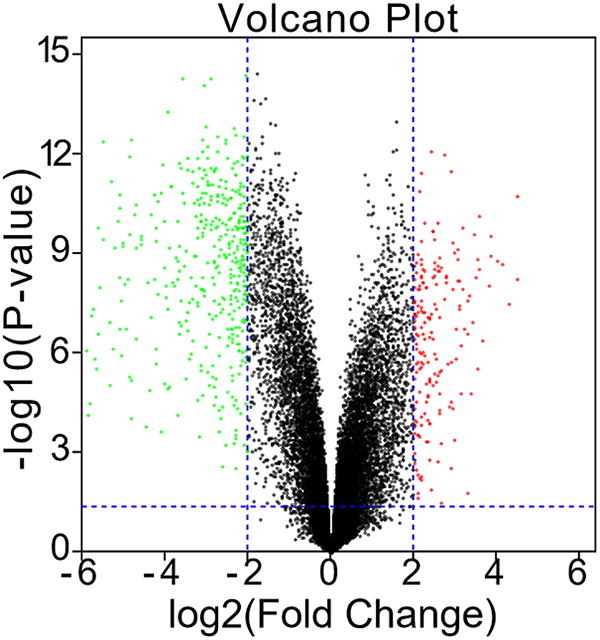
Identification of DEGs between rhabdomyosarcoma tissue samples and healthy skeletal muscle samples in the GSE28511 dataset.
Functional Annotation of DEGs Using KEGG and GO Analyses
The results of the GO analysis revealed that variations in biological processes were predominantly enriched in the cell cycle, muscle contraction, muscle system processes, cytoskeleton organization, and muscle organ development. Changes in cellular components were primarily enriched in intracellular non-membrane-bounded organelles, non-membrane-bounded organelles, the cytoskeleton, cytoskeletal parts, and mitochondria. Variations in molecular functions were enriched in nucleotide binding, cytoskeletal protein binding, purine nucleotide binding, purine ribonucleotide binding, and ribonucleotide binding (Table 2). KEGG analysis demonstrated that DEGs were largely enriched in pathways in cardiac muscle contraction, dilated cardiomyopathy, hypertrophic cardiomyopathy, Alzheimer’s disease, and tight junctions (Table 2). Pathway and process enrichment analysis by Metascape showed that the DEGs were mainly enriched in muscle contraction, muscle structure development, myofibril assembly, muscle tissue morphogenesis, skeletal muscle contraction, skeletal muscle adaptation, and cell division (P < 0.05) (Figure 2).
GO and KEGG Pathway Enrichment Analyses of DEGs in Rhabdomyosarcoma Samples.

GO, gene ontology; KEGG, Kyoto Encyclopedia of Genes and Genomes; DEGs, differentially expressed genes
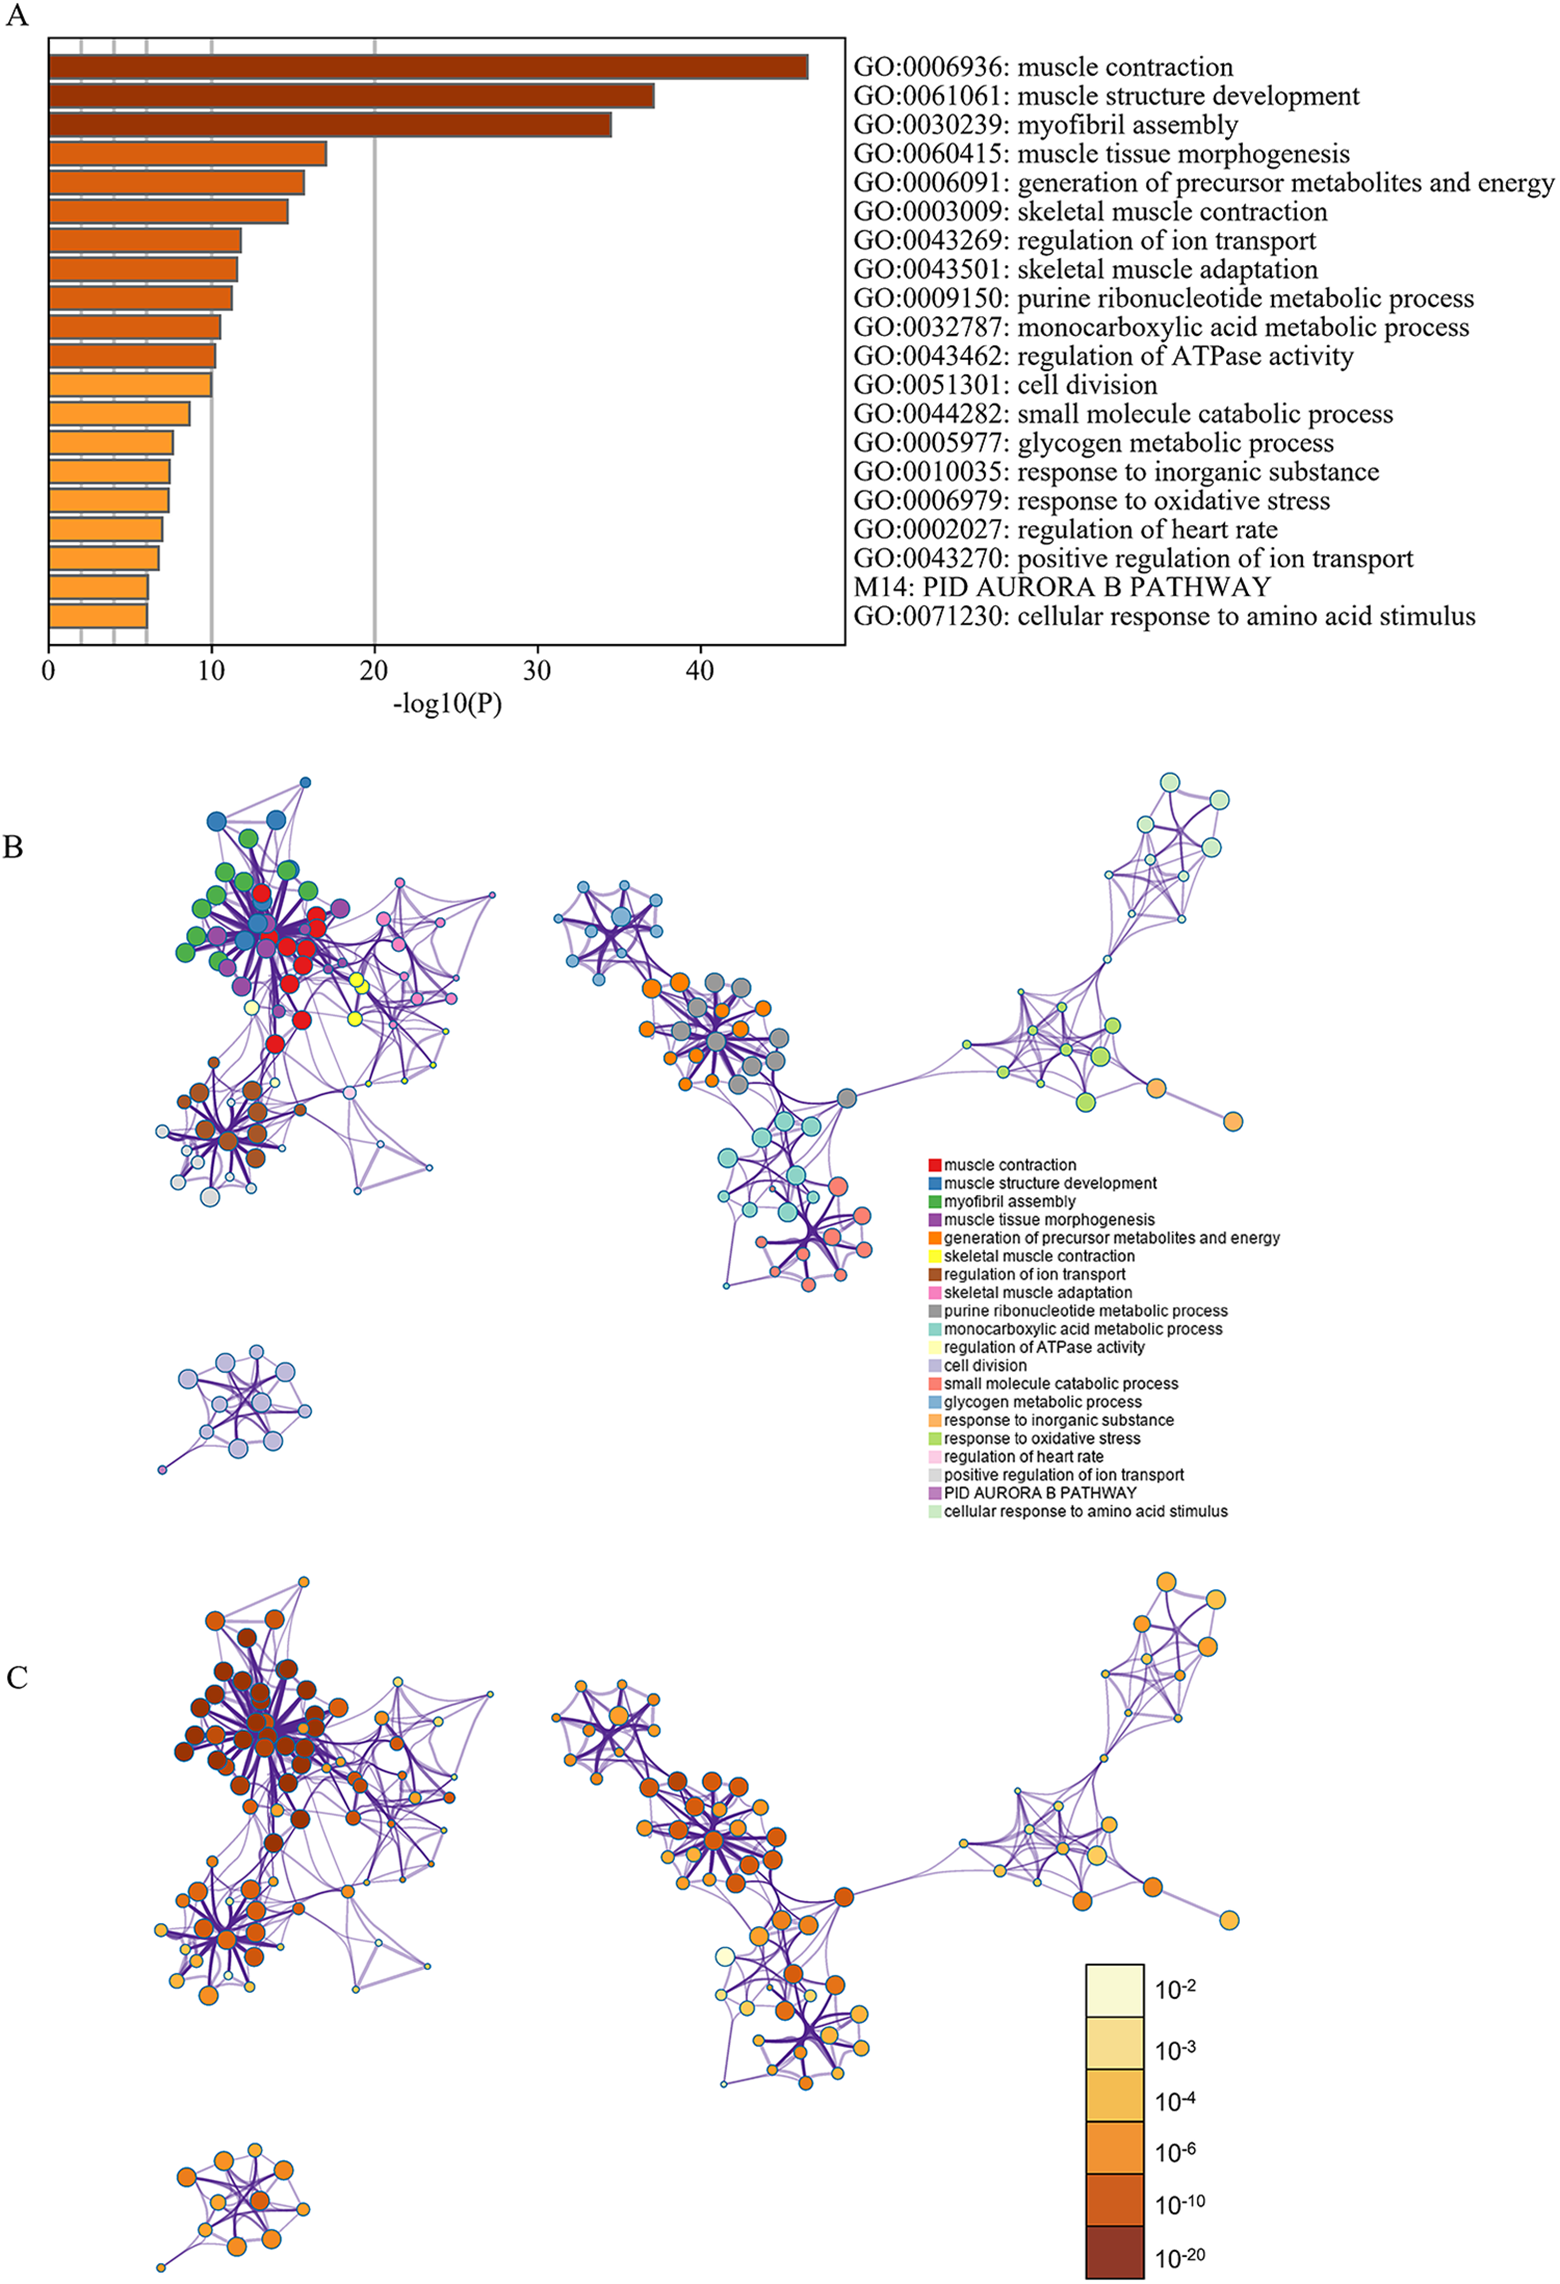
Enrichment analysis of DEGs using DAVID and Metascape. (A) Heatmap of enriched terms across input differently expressed gene lists, colored by P-values, via Metascape. (B) Network of enriched terms colored by cluster identity. (C) Network of enriched terms colored by P-value, where terms containing more genes tend to have a more significant P-value.
Construction of PPI Network
Construction of the PPI network revealed 3274 edges and 441 nodes (Figure 3A). The network possessed significantly more interactions than expected, highlighting a greater number of interactions between DEGs than would be expected for a random set of proteins of similar size from the same genome. Such enrichment indicates that the identified proteins were at least partially associated.

PPI network of DEGs and significant MCODE module. (A) The PPI network consisted of 3274 edges and 441 nodes. (B) The significant MCODE module.
Hub Gene Selection and Functional Annotation
The most important module of the network map is shown in Figure 3B.
Ten hub genes (MYH6, ACTN2, TNNI1, MYL4, TNNT3, NEB, MYBPC2, TTN, MYL1, and MYL3) were identified using Cytoscape (Figure 4A). The pathway and process enrichment analyses performed using Metascape showed that the hub genes were mainly enriched in striated muscle contraction (Figure 4B–D).

Hub genes network and analysis. (A) The 10 hub genes. (B–D) Pathway and process enrichment analysis of the hub genes.
Analysis of Hub Genes
The hub gene expression levels and the clustering analysis of the hub gene expression levels indicated that some hub genes were highly expressed in sarcoma tumor tissues; however, some hub genes were highly expressed in healthy tissues. In particular, compared with healthy samples, MYBPC2 and MYL1 were up-regulated in rhabdomyosarcoma tumor samples (Figure 5A and B).

Expression analysis of hub genes in UCSC. (A, B) Some hub genes were highly expressed in sarcoma tumor tissues.
Analysis of OS
The OS analysis for sarcoma over 50, 100, and 150 months is shown in Figure 6A to I. No correlation was found between the expression of ACTN2 and OS of patients with rhabdomyosarcoma (Figure 6A). The expression of MYBPC2 was negatively correlated with the OS rate in patients with sarcoma (P < 0.01) (Figure 6B). No correlation was present between the expression of MYH6 and the OS of patients with rhabdomyosarcoma (P > 0.05) (Figure 6C). When the expression of MYL1 was up-regulated, the OS of patients with rhabdomyosarcoma was reduced (P < 0.05) (Figure 6D). When the expression of MYL3 was up-regulated, the OS of patients with rhabdomyosarcoma was reduced (P < 0.05) (Figure 6E). When the expression of MYL4 was down-regulated, the OS of patients with rhabdomyosarcoma was reduced (P < 0.05) (Figure 6F). When the expression of NEB was up-regulated, the OS of patients with rhabdomyosarcoma was reduced (P < 0.05) (Figure 6G). No correlations were found between the expression of TNNI1 and TNNT3 and the OS of patients with rhabdomyosarcoma (P > 0.05) (Figure 6H and I).
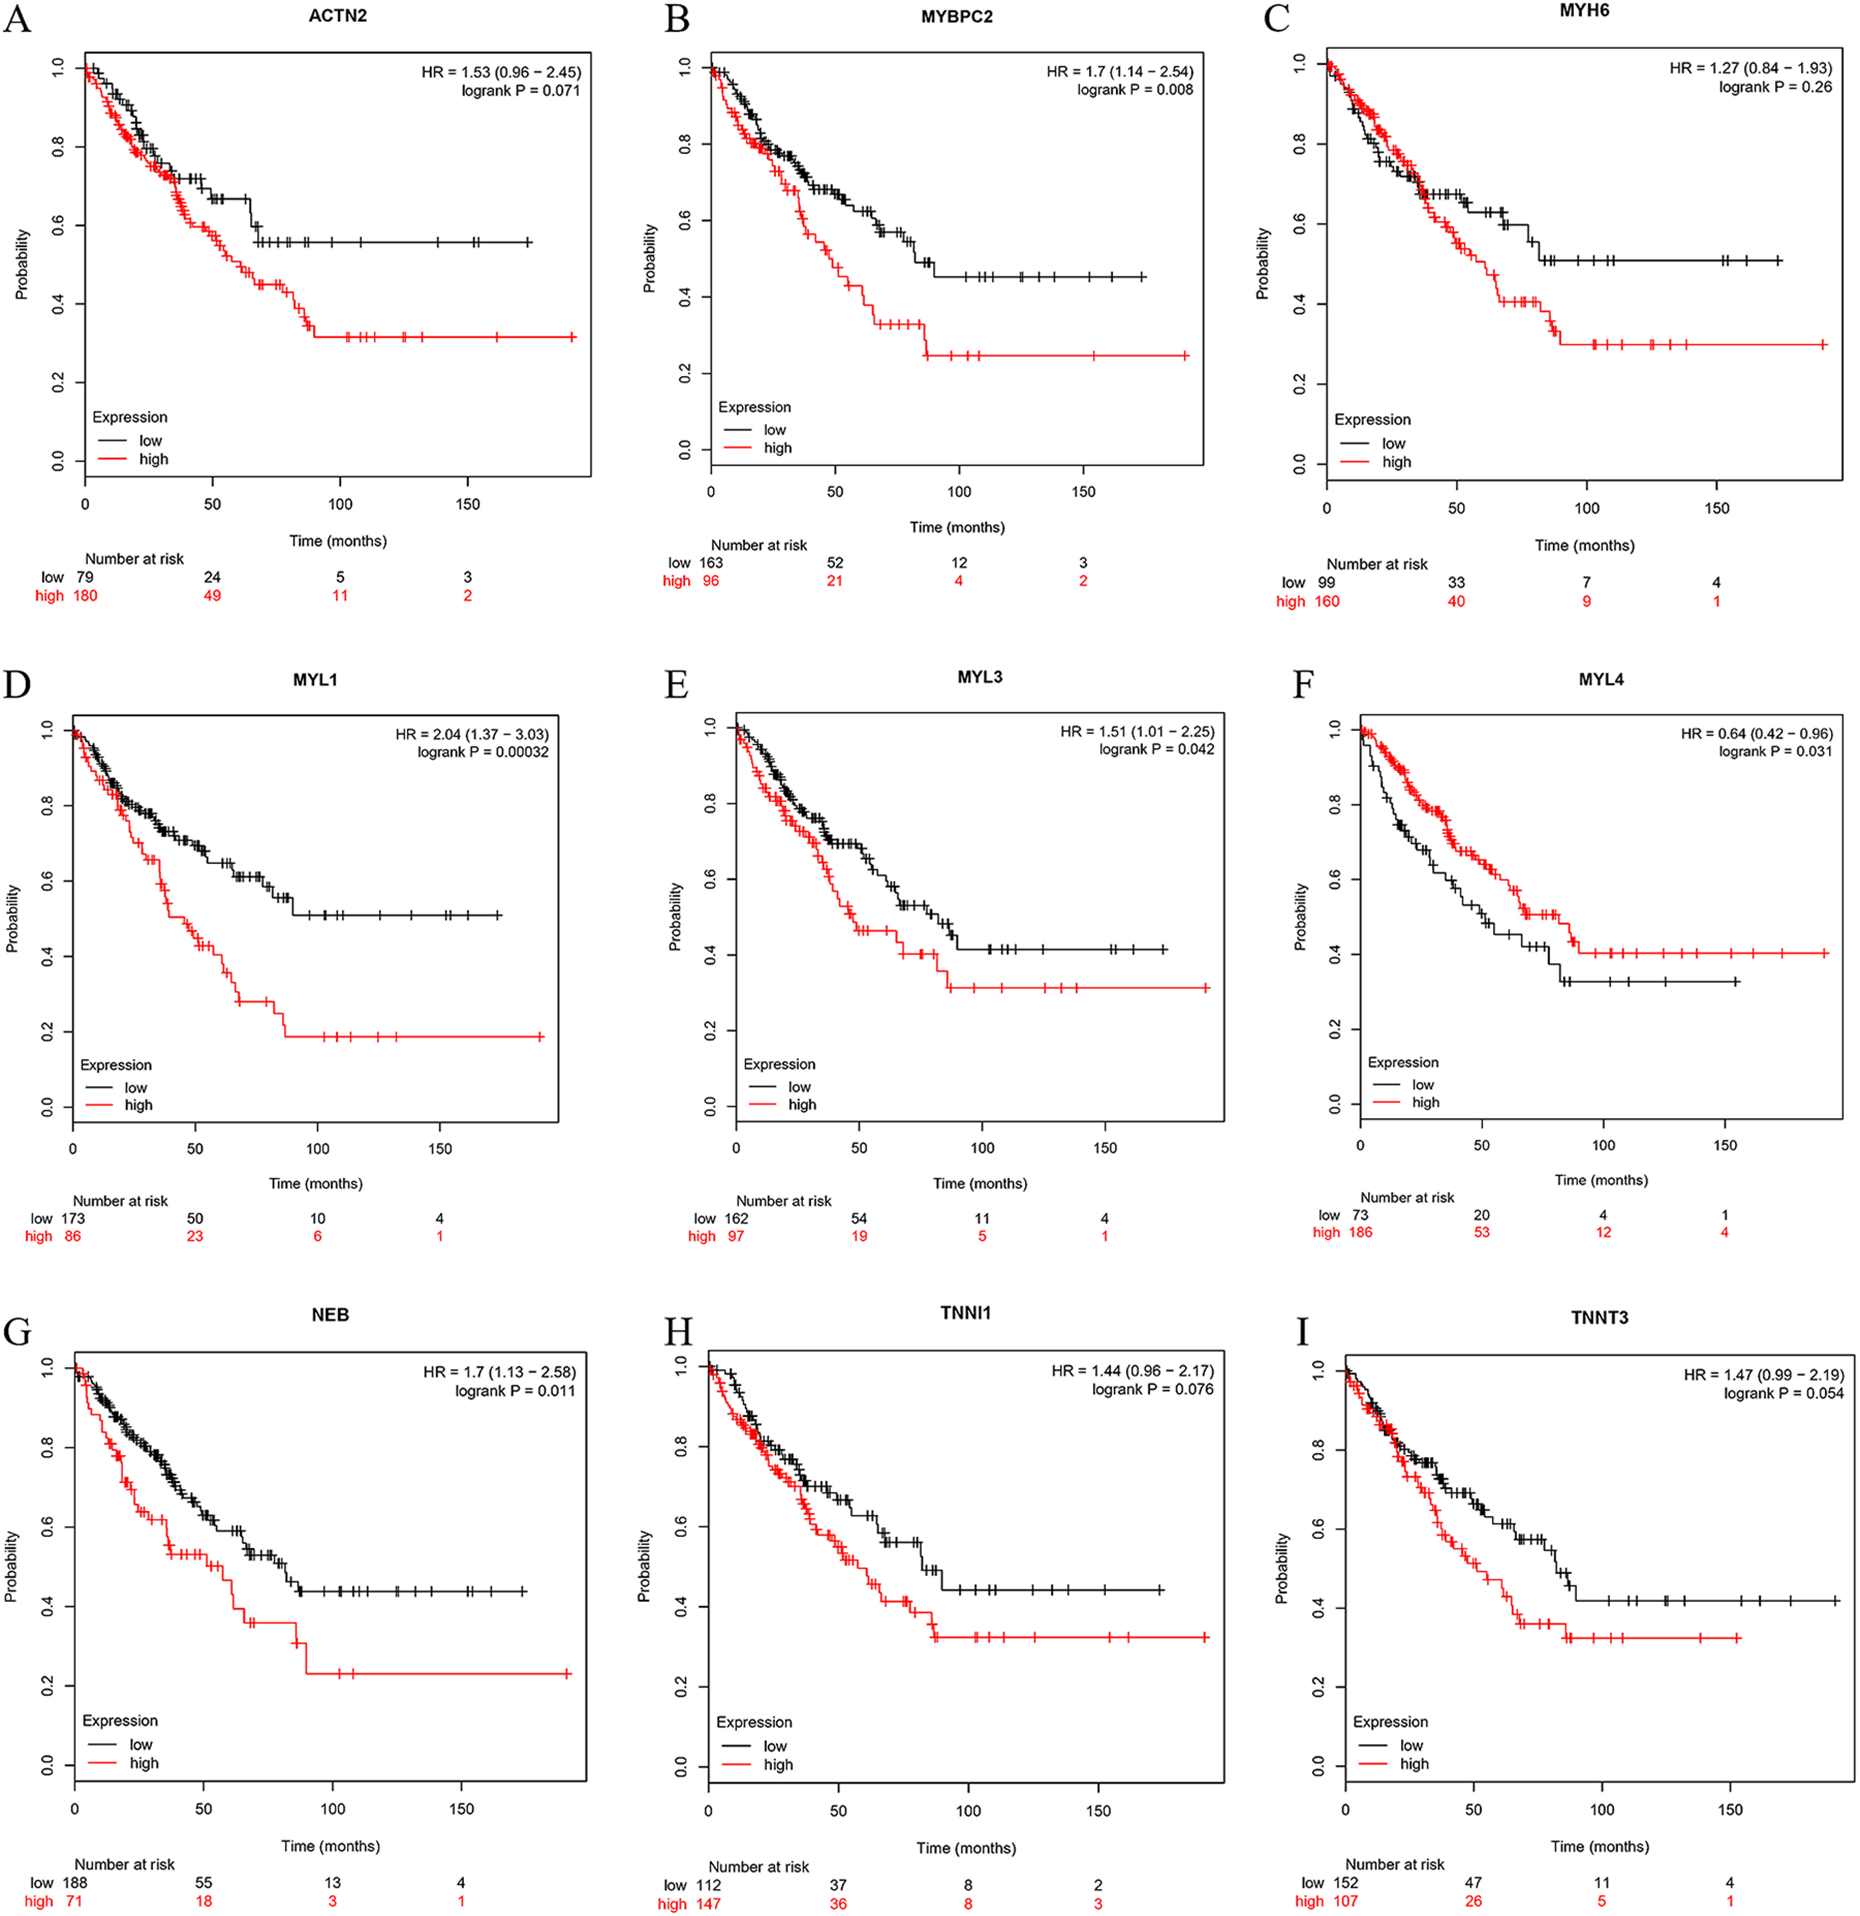
Overall survival analysis. (A) ACTN2, (B) MYBPC2, (C) MYH6, (D) MYL1, (E) MYL3, (F) MYL4, (G) NEB, (H) TNNI1, (I) TNNT3.
Further Analysis of Key Genes
The expression of hub genes in sarcoma tissues and healthy tissues were verified again by GEPIA (Figure 7A–I). MYBPC2 and MYL1 were highly expressed in tumor samples (Figure 7B and D). In addition, the median expression of tumor and healthy samples in bodymap showed the expression of MYBPC2, MYL3, MYL4, and NEB (Figure 8A–D).
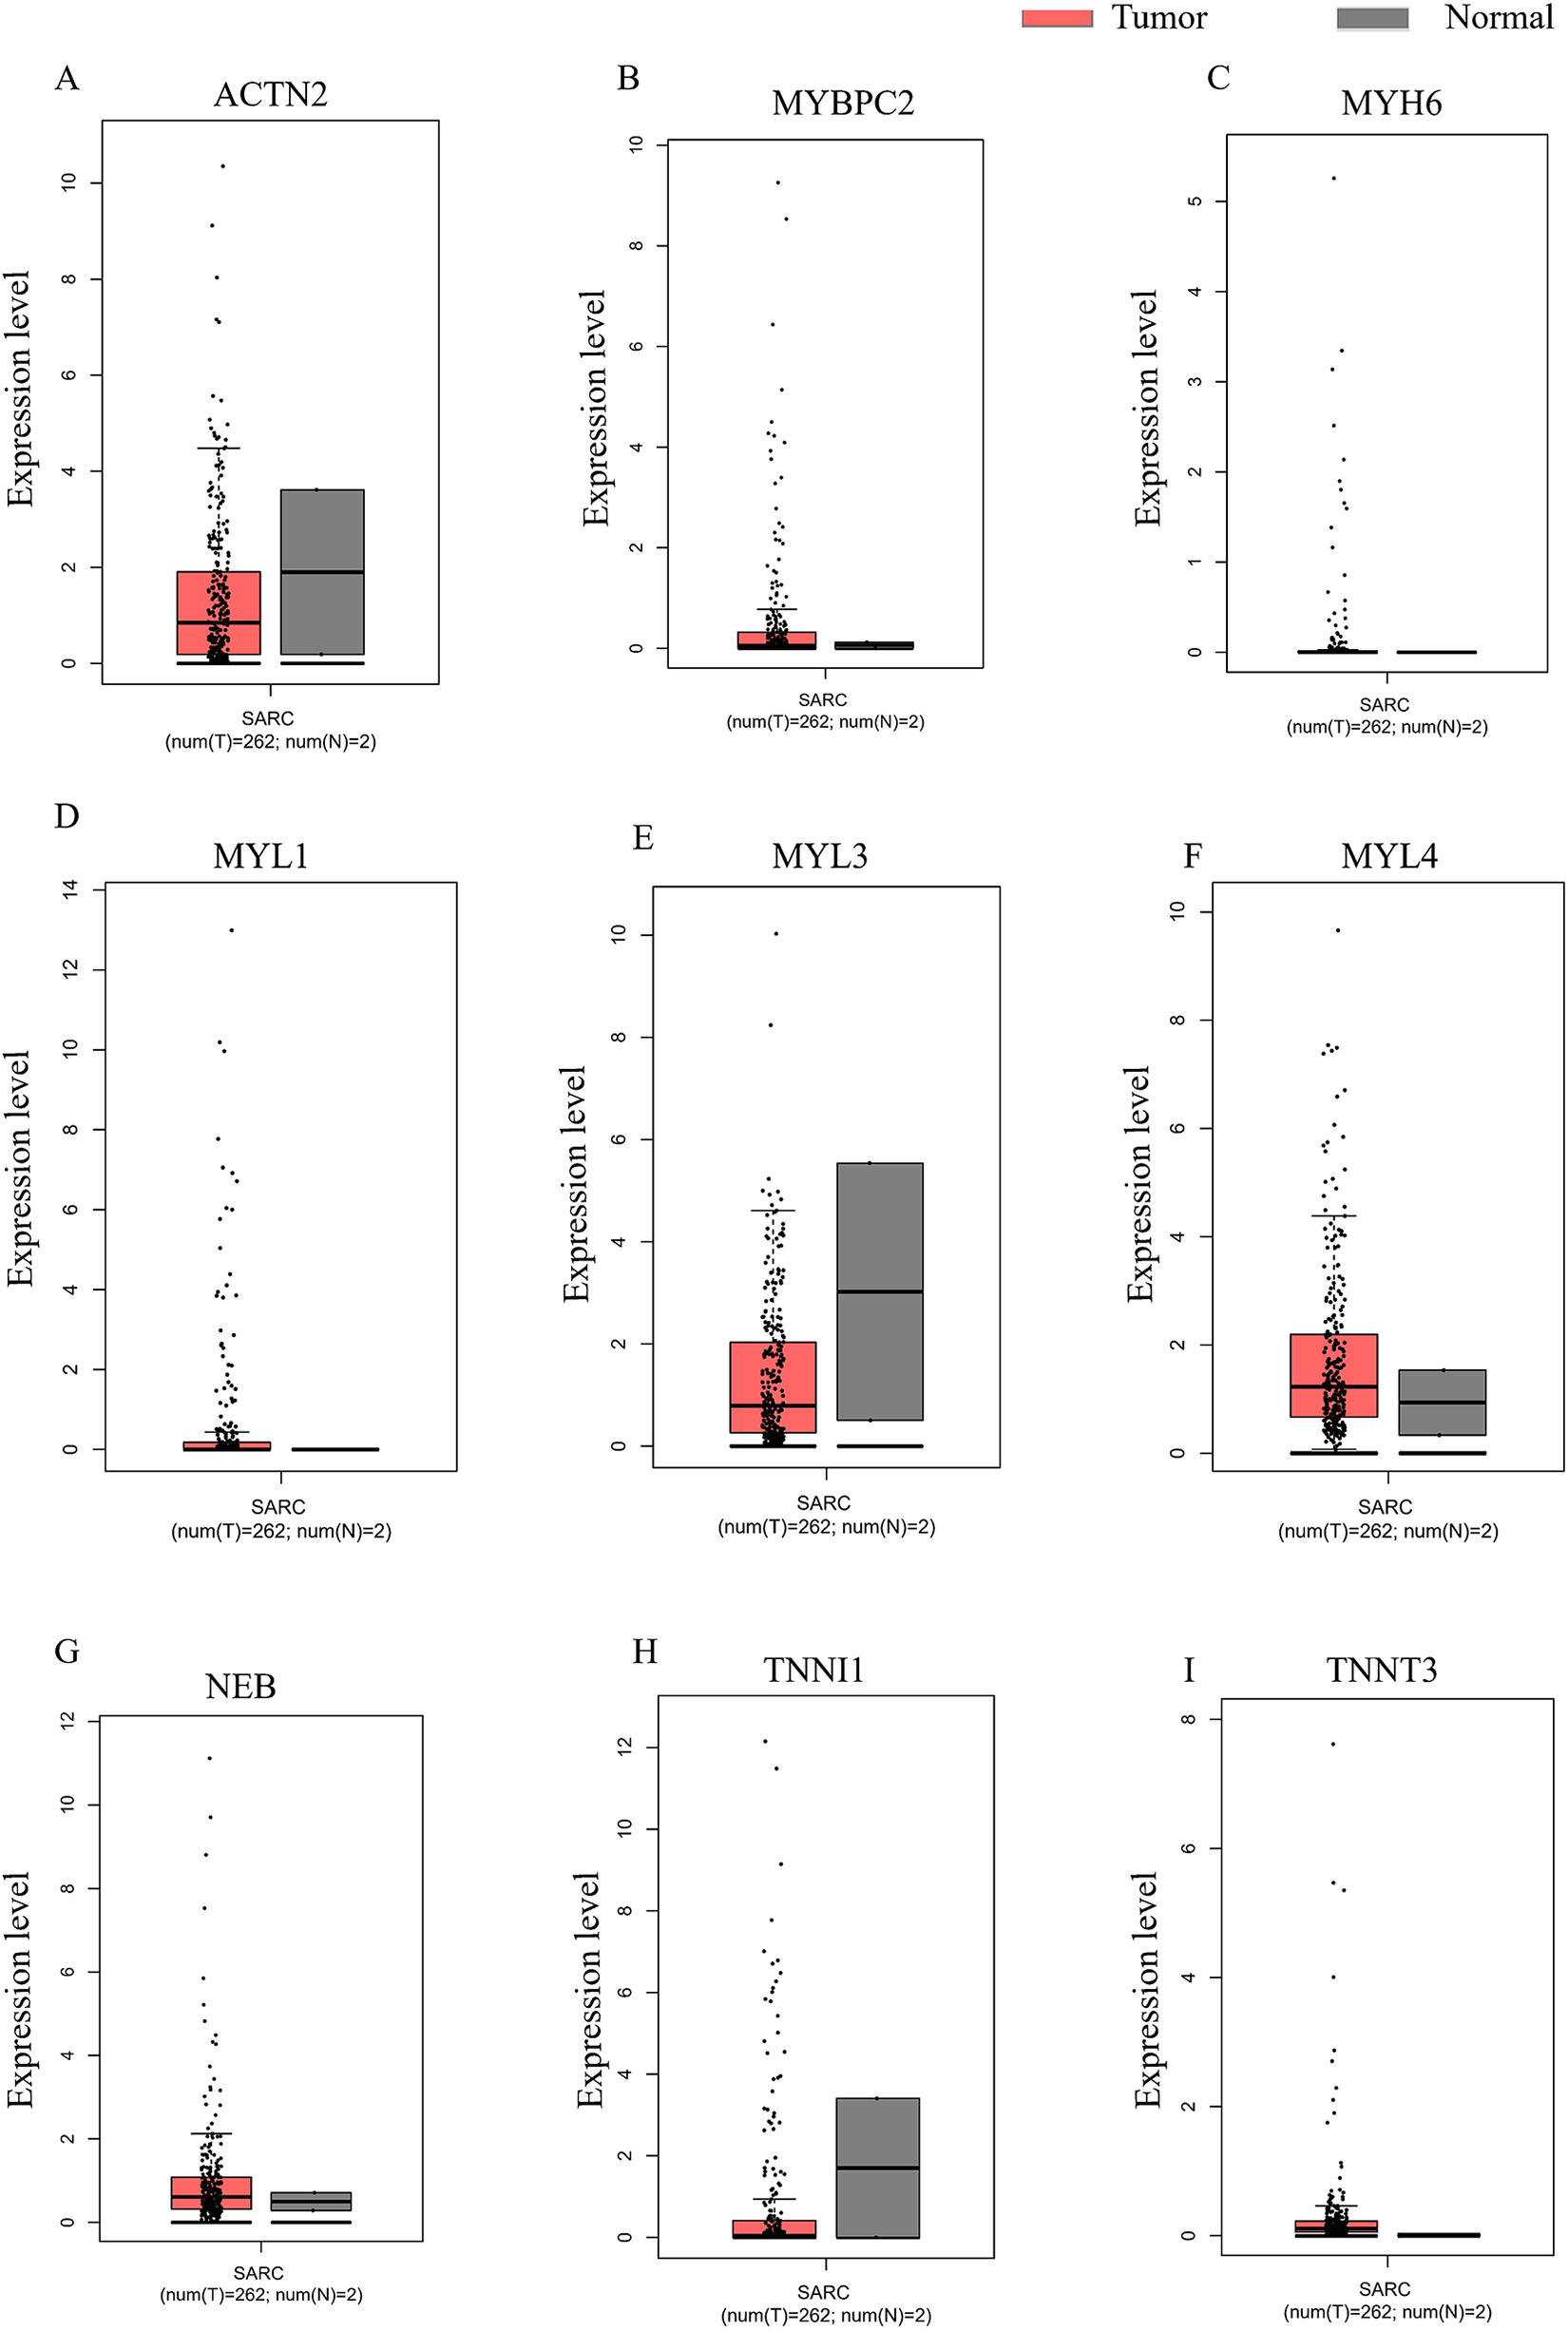
Expression of hub genes verified by GEPIA. (A) ACTN2, (B) MYBPC2, (C) MYH6, (D) MYL1, (E) MYL3, (F) MYL4, (G) NEB, (H) TNNI1, (I) TNNT3.
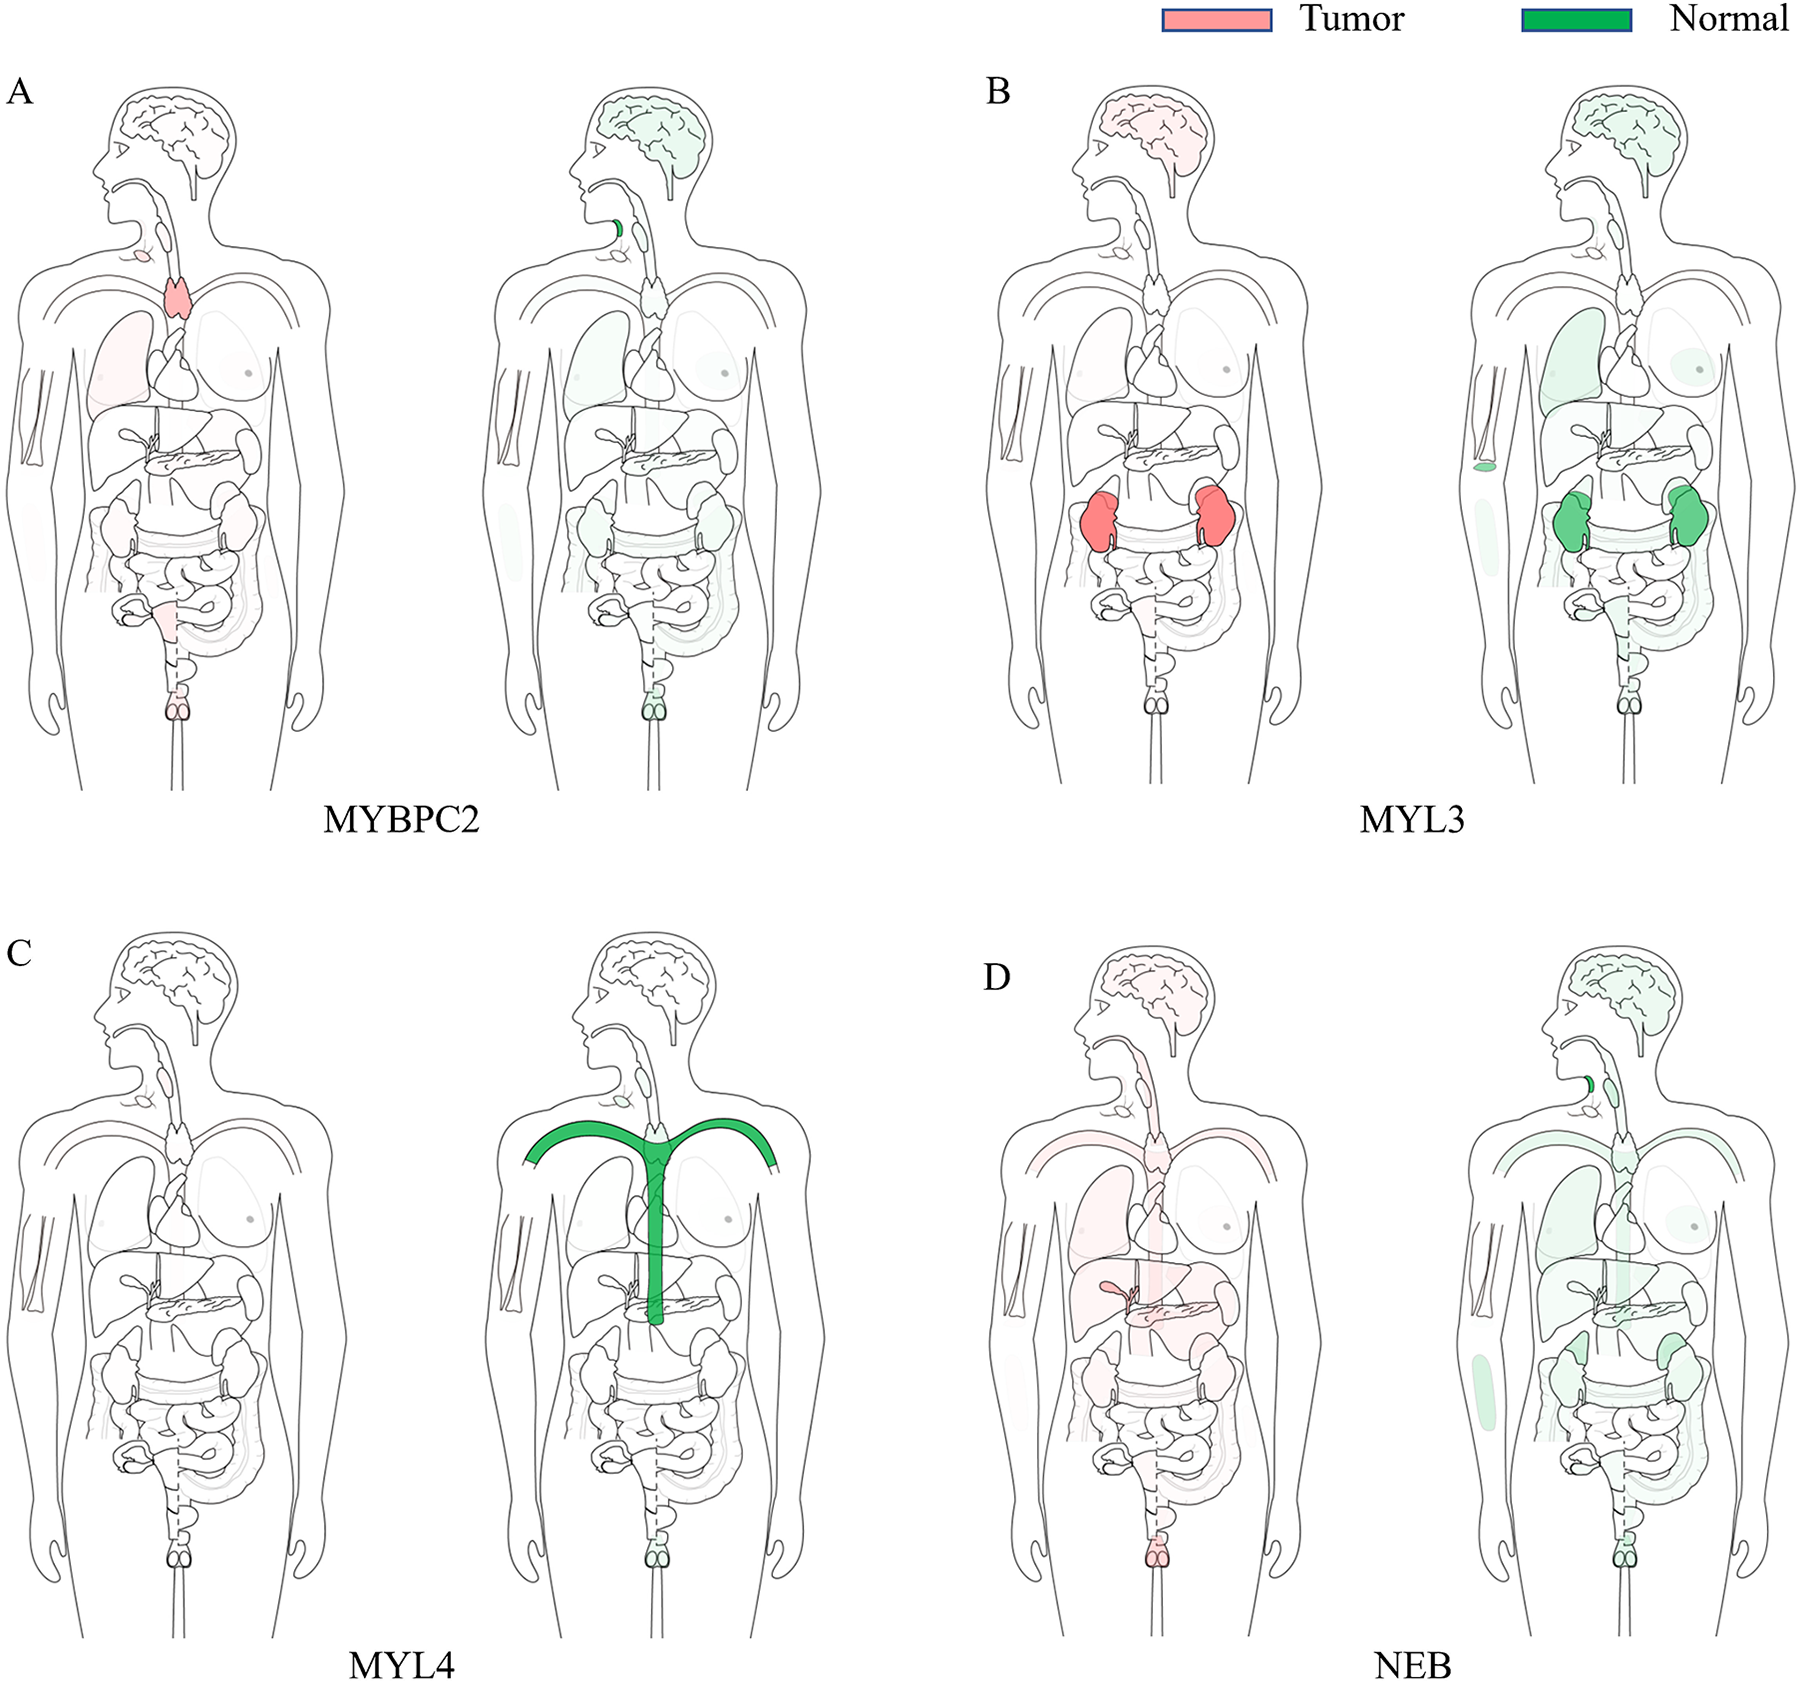
Median expression of genes in tumor and healthy samples in bodymap. (A) MYBPC2, (B) MYL3, (C) MYL4, (D) NEB.
Relative Expression of Hub Genes via RT-qPCR
Compared with their expression in the control group, MYBPC2 and MYL1 were significantly up-regulated in rhabdomyosarcoma tumor tissues (P < 0.05). However, the expression of other hub genes was not significantly different between the healthy and rhabdomyosarcoma tissues (Figure 9).

Relative expression of hub genes between healthy and rhabdomyosarcoma tissues via PCR. (A) MYH6, (B) ACTN2, (C) TNNI1, (D) MYL4, (E) TNNT3, (F) NEB, (G) MYBPC2, (H) TTN, (I) MYL1, (J) MYL3.
Survival Analysis in Patients with Rhabdomyosarcoma
MYBPC2 and MYL1 expression were significantly associated with survival in patients with rhabdomyosarcoma. Compared with the healthy group, patients with rhabdomyosarcoma showing high expression of MYBPC2 and MYL1 had reduced OS (P < 0.05) (Figure 10).
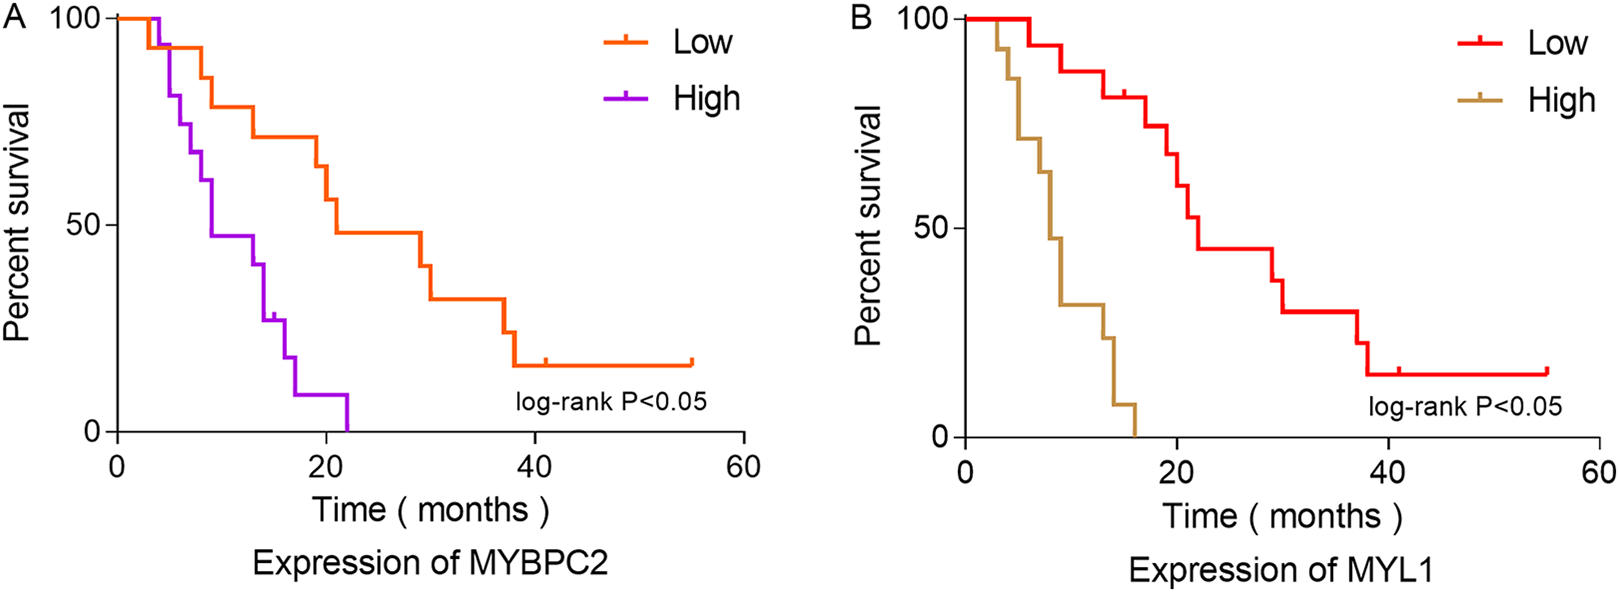
Overall survival analysis of MYBPC2 and MYL1 expression in 30 patients with rhabdomyosarcoma. (A) MYBPC2, (B) MYL1.
Discussion
Rhabdomyosarcoma is the most common soft tissue tumor in children 1 and includes embryonic rhabdomyosarcoma, acinar rhabdomyosarcoma, and pleomorphic rhabdomyosarcoma. 26,27 Embryonic rhabdomyosarcoma is most common in children and adolescents; its average age at onset is 5 years, and it accounts for about 2% of all rhabdomyosarcomas. 28 Acinar rhabdomyosarcoma is more common in males than in females. In addition, acinar rhabdomyosarcoma is prone to blood metastasis and lymph node metastasis in its early stages. 29 Pleomorphic rhabdomyosarcoma mainly occurs in the biceps and quadriceps femoris of adults. 30 Rhabdomyosarcoma often induces pain and bleeding caused by tumor compression. 2 Furthermore, rhabdomyosarcoma is prone to early metastasis, which seriously affects the therapeutic outcome and long-term prognosis. 11 Therefore, it is of great value to explore the molecular mechanisms underlying the occurrence and development of rhabdomyosarcoma and to realize its early diagnosis and targeted treatment. In this study, bioinformatics techniques were used to screen hub genes from a dataset of rhabdomyosarcoma samples; these hub genes can potentially be used as therapeutic targets and biomarkers for rhabdomyosarcoma. Ten hub genes were identified: MYH6, ACTN2, TNNI1, MYL4, TNNT3, NEB, MYBPC2, TTN, MYL1, and MYL3. Among them, MYBPC2 and MYL1 deserve the most attention.
MYBPC2 (myosin-binding protein C2) is mainly involved in regulating actin binding, protein binding, structural constituents of muscles, cell adhesion, and muscle filament sliding. Abnormal expression of MYBPC2 may be involved in the occurrence and development of many diseases. Using gene sequencing analysis of patients with degenerative joint diseases, Bayram et al. 31 identified several genes that were significantly related to degenerative joint disease. Further analysis suggested that MYBPC2 may participate in the occurrence and development of degenerative joint diseases by affecting the normal functioning of muscles. MYBPC2 may be a potential therapeutic target for joint degeneration. 31 Salinas-Torres et al. 32 found that multiple genes are coordinated to promote the development of gastroschisis, in which MYBPC2 plays an important role. In addition, Ding et al. 33 studied the relationship between FHL1 protein deletion and the progression of hereditary myopathy; they found that autophagy plays an important role in the development of hereditary myopathy and that MYBPC2 may be involved in its regulation. Autophagy may also be involved in the regulation of drug tolerance when rhabdomyosarcoma is treated with temozolomide and can impact the therapeutic effect. 34 Furthermore, Wang et al. 35 found that PFK15 can down-regulate the AMPK signaling pathway and inhibit autophagy and proliferation of rhabdomyosarcoma cells, suggesting that the regulation of autophagy can improve the tumor prognosis. Similar to previous studies, we found that MYBPC2 was highly expressed in patients with rhabdomyosarcoma. Our survival analysis showed that patients with rhabdomyosarcoma showing high expression of MYBPC2 had a poor prognosis. We also verified high expression of MYBPC2 in patients with sarcoma using data from TCGA in UCSC and GEPIA, and we used RT-qPCR to verify the significantly higher expression of MYBPC2 in patients with rhabdomyosarcoma. We speculate that MYBPC2 may be involved in the occurrence and development of rhabdomyosarcoma by affecting protein binding, structural constituents of muscles, cell adhesion, muscle filament sliding, and autophagy. The molecular mechanism underlying how MYBPC2 participates in rhabdomyosarcoma is worthy of further study.
MYL1 (myosin light chain 1) is mainly involved in regulating calcium ion binding, structural constituents of muscles, muscle contraction, and muscle filament sliding. Cellular components include cytosol, muscle myosin complex, and sarcomeres. The abnormal expression of MYL1 is involved in a variety of pathophysiological processes. MYL1 is involved in zebrafish muscle fiber differentiation and is an early marker of rapid muscle cell differentiation. 36 Ravenscroft et al. 37 found that abnormal MYL1 may cause structural and functional abnormalities of myosin, which in turn may lead to congenital myopathy, suggesting that MYL1 may be a potential target for the diagnosis and treatment of congenital myopathy. Using bioinformatics analysis, Lin and Lin 38 found that MYL1 may participate in the occurrence and development of steroid-induced necrosis of the femoral head by regulating muscle function, suggesting that MYL1 may be a potential therapeutic target. In addition, Chen et al. 39 found several regulatory factors that regulate muscle differentiation, among which MYL1 and long non-coding RNA Filip1 may play an important role in maintaining normal muscle differentiation and function. Similarly, Blackburn et al. 40 found abnormal expression of MYL1 in the muscle fibers of aged mice using a single-myofiber RNA-Seq analysis approach, suggesting that MYL1 may be beneficial for the normal functioning of muscle fibers by regulating metabolism and stabilizing their structure. Finally, Sun et al. 41 analyzed the gene sequence data of patients with prostate cancer and found that MYL1 was highly expressed in these patients; they suggested that MYL1 may be involved in the occurrence and development of prostate cancer by regulating muscle contraction, growth, and metabolism, and may be a potential therapeutic target. Similar to the findings of these previous studies, we found that MYL1 was highly expressed in patients with rhabdomyosarcoma. Our survival analysis showed that the prognosis of patients with high expression of rhabdomyosarcoma was poor. We also verified high expression of MYL1 in patients with sarcoma using the TCGA data in UCSC and GEPIA and verified high expression of MYL1 in patients with rhabdomyosarcoma by RT-qPCR. Overall, our results suggest that MYL1 is involved in the onset and development of rhabdomyosarcoma by regulating the normal differentiation of muscles and the structural constituents of muscles. MYL1 may be a molecular target for the early diagnosis and treatment of rhabdomyosarcoma.
Despite our rigorous bioinformatics analysis, this study still has some limitations. First, the sample size was small. Second, this study only included a small number of clinical samples for verification; this should be comprehensively verified by larger numbers of clinical samples and animal experiments. Overall, before drawing any conclusions with high confidence, this study requires further validation in larger cohorts.
Conclusions
Bioinformatics techniques can be used to explore the pathogenesis of rhabdomyosarcoma. We identified DEGs between rhabdomyosarcoma and healthy tissues. Several trends suggested that MYBPC2 and MYL1 may be involved in the pathogenesis of rhabdomyosarcoma, and these genes deserve further exploration.
Supplemental Material
Supplementary_materials_1 - MYBPC2 and MYL1 as Significant Gene Markers for Rhabdomyosarcoma
Supplementary_materials_1 for MYBPC2 and MYL1 as Significant Gene Markers for Rhabdomyosarcoma by Zihang Chen, Xing-yu Li, Peng Guo and Dong-lai Wang in Technology in Cancer Research & Treatment
Footnotes
Abbreviations
Authors’ Note
Zihang Chen analyzed the data and was the major contributor to performing the experiments and writing the manuscript. Zihang Chen and Peng Guo were involved in critically revising the manuscript for important intellectual content. Zihang Chen and Dong-lai Wang made substantial contributions to conceiving the research and designing the draft of the research process. Xing-yu Li made substantial contributions to writing the content related to Myod1 and myogenin, searching for references, and improving the manuscript. Xing-yu Li contributed to writing the manuscript. All authors read and approved the final manuscript. The datasets used and/or analyzed during the current study are available from the corresponding author on reasonable request. The data for this research were downloaded from the GEO database, a public website. All institutional and national guidelines for the care and use of participants were followed. The research conformed to the standards set by the Declaration of Helsinki and was authorized by the Human Ethics and Research Ethics Committees of the Hangzhou Fuyang District First People’s Hospital. Written informed consent was obtained from all participants.
Declaration of Conflicting Interests
The authors declare no potential conflicts of interest with respect to the research, authorship, and/or publication of this article.
Funding
The authors received no financial support for the research, authorship, and/or publication of this article.
Supplemental Material
Supplemental material for this article is available online.
References
Supplementary Material
Please find the following supplemental material available below.
For Open Access articles published under a Creative Commons License, all supplemental material carries the same license as the article it is associated with.
For non-Open Access articles published, all supplemental material carries a non-exclusive license, and permission requests for re-use of supplemental material or any part of supplemental material shall be sent directly to the copyright owner as specified in the copyright notice associated with the article.