
Abstract
Aim:
Thyroid cancer is the most common endocrine cancer, the incidence rate has continuously increased worldwide. However, there are still lack of effective molecular biomarkers for the diagnosis and treatment of the disease. The study was conducted to identify driver genes that may serve as potential biomarkers for the disease.
Methods:
The computational tools oncodriveCLUST, oncodriveFM, icages and drgap were used to detect driver genes in thyroid cancer using somatic mutations from The Cancer Genome Atlas database. Integrated analyses were performed on the driver genes using multiomics data from the TCGA database.
Results:
A set of 291 driver genes were identified in thyroid cancer. BRAF, NRAS, HRAS, OTUD4, EIF1AX were the top 5 frequently mutated genes in thyroid cancer. The weighted gene co-expression network analysis identified 4 coexpression modules. The modules 1-3 were significantly associated with patients’ tumor size, residual tumor, cancer stage, distant metastasis and multifocality. SEC24B, MET and ITGAL were the hub genes in the modules 1-3 respectively. Hierarchical clustering analysis of the 20 driver genes with the most frequent copy number changes revealed 3 clusters of PRAD patients. Cluster 1 tumors exhibited significantly older age, tumor size, cancer stages, and poorer prognosis than cluster 2 and 3 tumors. 16 genes were significantly associated with number of lymph nodes, tumor size and pathologic stage, such as IL7 R, IRS1, PTK2B, MAP3K3 and FGFR2.
Conclusions:
The set of cancer genes and subgroups of patients shed insight on the tumorigenesis of thyroid cancer and open up avenues for developing prognostic biomarkers and driver gene-targeted therapies in thyroid cancer.
Keywords
Introduction
Thyroid cancer is the fifth most common cancer in women in the US, and an estimated 62 000 new cases occurred in 2015. 1 The incidence of thyroid cancer continues to increase worldwide, mostly because of the increased use of diagnostic imaging and surveillance. Thyroid cancer can be classified into 4 main histologic subtypes: papillary, follicular, anaplastic, and medullary thyroid cancer. Papillary thyroid cancer is the most prevalent subtype and shows the best overall prognosis. Thyroid cancer most commonly metastasizes to cervical lymph nodes and less commonly to the lungs. Treatments for thyroid cancer include surgery, radioactive iodine and targeted therapy. 2
Cancer is initiated by the accumulation of driver mutations in cancer genes, which confers a proliferation advantage to cancer cells. 3 Genes carrying these driver mutations are critical to tumorigenesis. 4 -8 The common approach for detecting driver genes involves the search for significantly mutated genes across a cohort of cancer samples and a comparison with the background mutation rate. 9,10 The Cancer Genome Atlas (TCGA) contains sequencing data of 496 thyroid cancer samples, and by examining these samples, we found that thyroid cancer tumors are dominated by somatic mutations affecting the RTK-RAS-RAF pathway. These mutations are primarily in 4 genes (BRAF, NRAS, KRAS and RET). Many driver genes such as EIF1AX, CHEK2 and PPMID have been found to be mutated at a low frequency in the thyroid cancer genome. 8 Chai et al analyzed the somatic mutation data from the TCGA database using OncodriveFM and Dendrix and found 53 driver genes and pathways with low mutation frequencies. 11 These studies provided insight into the genomic basis of thyroid cancer.
Despite the tremendous progress that has been achieved, the molecular mechanism underlying the development of thyroid cancer has not been completely characterized. In this study, we performed integrated analyses on the driver genes detected in 405 thyroid cancer samples using multiomics data from the TCGA database (Supplementary Figure 1). This study revealed a list of new driver genes and 3 clusters of thyroid cancer patients, which provided a better understanding of this disease and suggested potential therapeutic targets in thyroid cancer.
Methods and Materials
Classification of Somatic Mutations in Thyroid Cancer
7,458 somatic mutations of 405 pairs of thyroid cancer tumor/normal samples were accessed from TCGA database(http://gdac.broadinstitute.org/). 8 Ensembl Variant Effect Predictor (VEP) was used to assess the functional impact of somatic mutations 12 and then mutations were divided into 8 groups based on their functional impact, including frame shift insertions and deletions (indels), in frame indels, missense, nonsense, nonstop, RNA, silent and splice site mutations.
Prediction of Driver Genes and Pathways in Thyroid Cancer
Prediction of driver genes was performed with 4 computational methods, including OncodriveCLUST v0.4.1, 13 oncodriveFM v0.0.1 14 (https://www.intogen.org), icages 15 (http://icages.wglab.org) and drgap v0.1.0 16 (https://code.google.com/archive/p/drgap). All parameters were set to default values for the software. Driver genes or pathways were determined based on the following criteria: (1) q values of genes are less than 0.05 (OncodriveCLUST and OncodriveFM), (2) genes are predicted as drivers by icages and have icagesGeneScores above 0.5, (3) P values of genes or pathways are smaller than 0.05 (drgap).
Functional Enrichment Analysis in Thyroid Cancer
Gene ontology (GO) and Kyoto Encyclopedia of Genes and Genomes (KEGG) pathway enrichment analyses were performed on the homepage of GO 17 (http://geneontology.org) and the Search Tool for the Retrieval of Interacting Genes/Proteins (STRING) 18 (http://string.embl.de), respectively, to characterize the functional enrichment of all driver genes. Driver genes were considered significantly enriched in GO terms and KEGG pathways with the cutoffs of a false discovery rate (FDR)-adjusted P value or a false discovery rate less than 0.05, respectively.
Coexpression Network Analyses in Thyroid Cancer
Of 291 driver genes, 279 genes had nonzero expression values in more than 90% of thyroid cancer patients and were included in the coexpression network analysis. The read counts were divided by the 75th percentile and multiplied by 1000 to generate the normalized read counts. Soft-thresholding power values were screened out in the construction of coexpression modules by the weighted gene coexpression network analysis (WGCNA) algorithm. The optimal power value was determined when the scale-free fit index was above 0.8. The minimum number of genes was set as 10. Then, the coexpression modules were constructed by the R package of WGCNA in R3.2.0. 19 Moreover, information on the corresponding genes of the coexpression modules was extracted. The clinical traits of 501 thyroid cancer samples were obtained from the TCGA database. Module-trait associations were analyzed using the correlation between the module eigengenes and the clinical traits. The genes with maximum intramodular connectivity were regarded as intramodular hub genes. 20 The interested modules and hub genes were visualized by Integrative Visual Analysis Tool for Biological Networks and Pathways (VisANT) 21 software.
Protein-Protein Interaction Network Analysis in Thyroid Cancer
A protein-protein interaction (PPI) network was constructed with the online STRING tool using default parameters. 18 The PPI network was imported to Cytoscape for visualization and calculation of degree values for each node. Degree centrality, which was defined as the number of connections one node has to another, was analyzed by Cytoscape software. 22 Hub nodes had the highest degree of connection to most adjacent proteins in the PPI network. Moreover, Molecular Complex Detection (MCODE) was utilized to detect hub clustering modules in the PPI network with default parameters in Cytoscape. 23
Copy Number Variation Analyses in Thyroid Cancer
Focal copy number variations (CNVs) and genes with significant gains and losses in 499 thyroid cancer samples were detected using the GISTIC algorithm 24 and were accessed at the Broad Institute. 8 Unsupervised hierarchical clustering of 20 driver genes with copy-number alterations at the highest frequency was conducted using the function heatmap.2 of the R package of gplots. 25 Clinical factors were compared among patients in 3 clusters using the Wilcoxon sum rank test. Kaplan-Meier curves were plotted using the R package of survival, 26 and survival rates were compared among patients in the 3 clusters using the log-rank test. P < 0.05 was predefined as statistically significant.
Analyses of Clinical Features of Thyroid Cancer
The clinical features of 501 thyroid cancer patients were downloaded at the Broad Institute and included patient outcome, number of lymph nodes, tumor size and pathologic stage. For survival rates, the log-rank test after a univariate Cox regression analysis with a proportional hazards model 27 was used to estimate the P values comparing quantile intervals using the “coxph” function in R. For the number of lymph nodes and tumor size, Spearman’s rank correlation was conducted between each feature type and gene expression (log2 normalized count) using the “cor.test” function in R. For pathologic stage, the Kruskal-Wallis test was used to compare the driver gene expression (log2 normalized count) across multiple cancer stages. Driver genes were considered significantly associated with each feature at P values < 0.05 and Q values < 0.3.
Results
General Characteristics of 501 Thyroid Cancer Patients
The age of the 501 thyroid cancer patients ranged from 15 to 89 years (mean, 47.26 years). In all, 283, 51, 110 and 55 patients were diagnosed with stage I, II, III and IV disease, respectively. Moreover, 225 and 9 patients showed lymph node and distant metastases, respectively. The average tumor size, number of metastatic lymph nodes and residual tumors were 2.98 cm, 3.66, and 0.14, respectively. Overall, 226 and 255 patients had multifocality and unifocality, respectively, and 305 cancer samples were derived from patients who received radiation therapies, while 17 samples had radiation exposure. On the last day of follow-up, 16 patients were deceased and 485 were alive.
Somatic Mutations in Thyroid Cancer
In all, 7,458 somatic mutations were detected in 405 different thyroid cancer samples, with an average mutation density of 0.5 somatic mutations per megabase per sample, which is lower than in other cancer types, such as melanoma and lung cancer. 9 The somatic mutations comprised 4,763 missense, 1,816 silent, 252 splice-site, 262 nonsense, 61 RNA, and 5 nonstop mutations, 218 reading frame deletions, 38 reading frame insertions, 37 in- frame deletions and 6 in-frame insertions (Supplementary Figure 2A). C>T/G>A, A>G/T>C and C>G/G>C were the 3 predominant transitions, with mutation rates of 45.8%, 16.9% and 10.9%, respectively, in thyroid cancer (Supplementary Figure 2B).
Driver genes and Pathways in Thyroid Cancer
Overall, 4,976 genes were mutated in at least one thyroid cancer sample. In addition, 27, 81, 99 and 104 driver genes were predicted by OncodriveCLUST, OncodriveFM, iCAGES and DrGaP, respectively. The 4 tools identified a total of 291 unique driver genes with different algorithms; no driver gene was detected by the 4 methods and the majority of predicted driver genes were method-specific (Supplementary Figure 3). Of 291 driver genes, BRAF, NRAS, HRAS, OTUD4, and EIF1AX were the top 5 recurrently mutated genes in thyroid cancer, with mutation rates of 60%, 8.4%, 3.5%, 2%,1.5%, respectively, across all thyroid cancer samples (Figure 1). The majority of driver genes were mutated at a low frequency in thyroid cancer, with an average mutation rate of 0.7%. In addition to the list of driver genes, DrGapP also reported 36 driver pathways in thyroid cancer, such as the chemokine signaling pathway, Jak-STAT signaling pathway, P53 signaling pathway, MAPK signaling pathway, Toll-like receptor signaling pathway and the cell cycle.

The mutation rates of the top 20 most frequently mutated driver genes in 405 thyroid cancer samples. The left figure shows the mutation rates of driver genes in thyroid cancer samples, while the figure above represents the synonymous and nonsynonymous mutation densities in 405 thyroid cancer samples. The main figure represents the distribution of mutations, which were colored by the coding consequence of the mutation in a given gene.
GO Term and KEGG Pathway Enrichment Analyses
The enrichment of GO terms and KEGG pathways was analyzed for 291 driver genes with gene ontology and STRING. GO enrichment analysis indicated that driver genes were significantly overrepresented and underrepresented in 1296 and 4 biological processes, respectively. The top 5 GO terms enriched for driver genes were negative regulation of plasma membrane long-chain fatty acid transport, regulation of plasma membrane long-chain fatty acid transport, regulation of response to gamma radiation, negative regulation of transcription from RNA polymerase II promoter during mitotic cell cycle, negative regulation of transcription during mitotic cell cycle (Supplementary Table 1, FDR-adjusted P value < 0.05). In contrast, detection of stimulus, detection of stimulus involved in sensory perception, detection of chemical stimulus and detection of chemical stimulus involved in sensory perception were the 4 GO terms most negatively enriched for driver genes (FDR-adjusted P value < 0.05). STRING also revealed 126 KEGG pathways significantly enriched for driver genes, such as pathways in cancer, PI3K-Akt signaling pathway, thyroid cancer, glioma, renal cell carcinoma, mTOR signaling pathway and VEGF signaling pathway (Supplementary Table 2, FDR < 0.05).
Construction of Coexpression Modules and Analysis of Module-Trait Associations in Thyroid Cancer
When the power value was greater than 6, the scale-free fit index was larger than 0.8 and the mean connectivity degree was higher. Therefore, the soft-thresholding power value was set to 7 (Supplementary Figure 4). The WGCNA algorithm identified 4 distinct gene coexpression modules shown in different colors (Modules 1-4, Figure 2). The number of genes in the 4 modules differed largely, with 89, 30, 29 and 10 genes in module 1 (turquoise), module 2 (blue), module 3 (brown) and module 4 (yellow), respectively (Figure 2, Table 1). Module-trait associations were analyzed with the correlation between the module eigengene and clinical traits. As shown in Figure 3, module 1 (turquoise) was positively correlated with tumor size and residual tumor (P value < 0.05 for all cases, Figure 3, Table 1). Module 2 (blue) was significantly negatively associated with multifocality (P value = 0.003, Figure 3, Table 1). Module 3 (brown) showed a statistically significant positive correlation with cancer stage and distant metastasis (P value < 0.05 for all cases, Figure 3, Table 1). Module 4 (yellow) showed a significant positive correlation with cancer stage and multifocality (P value < 0.05 for all cases, Figure 3, Table 1). The modules were visualized using VisANT software. The genes with the highest intramodular connectivity were considered intramodular hub genes. SEC24B, MET and ITGAL were the hub genes in modules 1, 2 and 3, respectively (Supplementary Figure 5, Table 1).

Clustering results of 4 coexpression modules in thyroid cancer. Genes in modules are marked with different colors; the gray color represents no genes in any of the modules.
The co-Expression Modules and Hub Genes in the WGCNA Co-Expression Network.


The coexpression module-trait associations. Each row corresponds to a module eigengene, and each column corresponds to a trait. Each cell contains the corresponding correlation coefficient and p-value. The right red-to-blue bar shows the negative (blue) to positive (red) correlations between coexpression modules and clinical traits.
PPI Network Analysis in Thyroid Cancer
We applied STRING to construct a PPI network for driver genes to characterize the interactions of driver genes at the protein level. The PPI network comprised 256 nodes and 1633 edges, with an average node degree of 12.8 (Supplementary Figure 3A). The PPI network revealed significantly more interactions than expected for a random set of proteins of similar size (PPI enrichment P value < 0.0001). The nodes with high degrees possess intensive interactions with other nodes and may act as key nodes in the PPI network. Seven candidate hub nodes, the degree of which was greater than 9 times the corresponding median values, were identified: AKT1, TP53, HRAS, PTEN, SRC, MYC, and KRAS (Supplementary Figure 6A). Moreover, we performed a module analysis and obtained the top 3 modules with high scores using MCODE (Supplementary Figures 6B, C, and D). The 9 candidate hub nodes were contained in the 3 modules.
Copy Number Variation Analyses in Thyroid Cancer
We also obtained focal CNVs for 499 thyroid cancer samples from the Broad Institute. CHEK2, SEC14L2, SEC14L4, ANKRD54, CARD10, CLTCL1, DGCR8, ABL1, CNTRL and CTNNAL1 were the 10 most frequently deleted driver genes, while FH, HEATR1, NUP133, DSTYK, LAMC1, DAP3, SHC1, SPTA1, BRAF, and TRIO were the 10 most frequently amplified driver genes in thyroid cancer (Supplementary Figure 7). Hierarchical clustering analysis of these 20 genes revealed 3 subgroups of thyroid cancer patients: those with substantial amplifications (cluster1), those with rare CNVs (cluster2), and those with substantial deletions (cluster3) (Supplementary Figure 4). Cluster 1 tumors were significantly associated with older age, tumor size, and cancer stages than those in cluster2 or 3 (P values < 0.05 for all cases, Wilcoxon sum rank test, Figure 4A, B, and C). Moreover, patients in the highly amplified cluster1 exhibited significantly poorer survival rates than patients in the cluster2 and cluster3 (P value = 0.05 for all cases, log-rank test, Figure 4D).
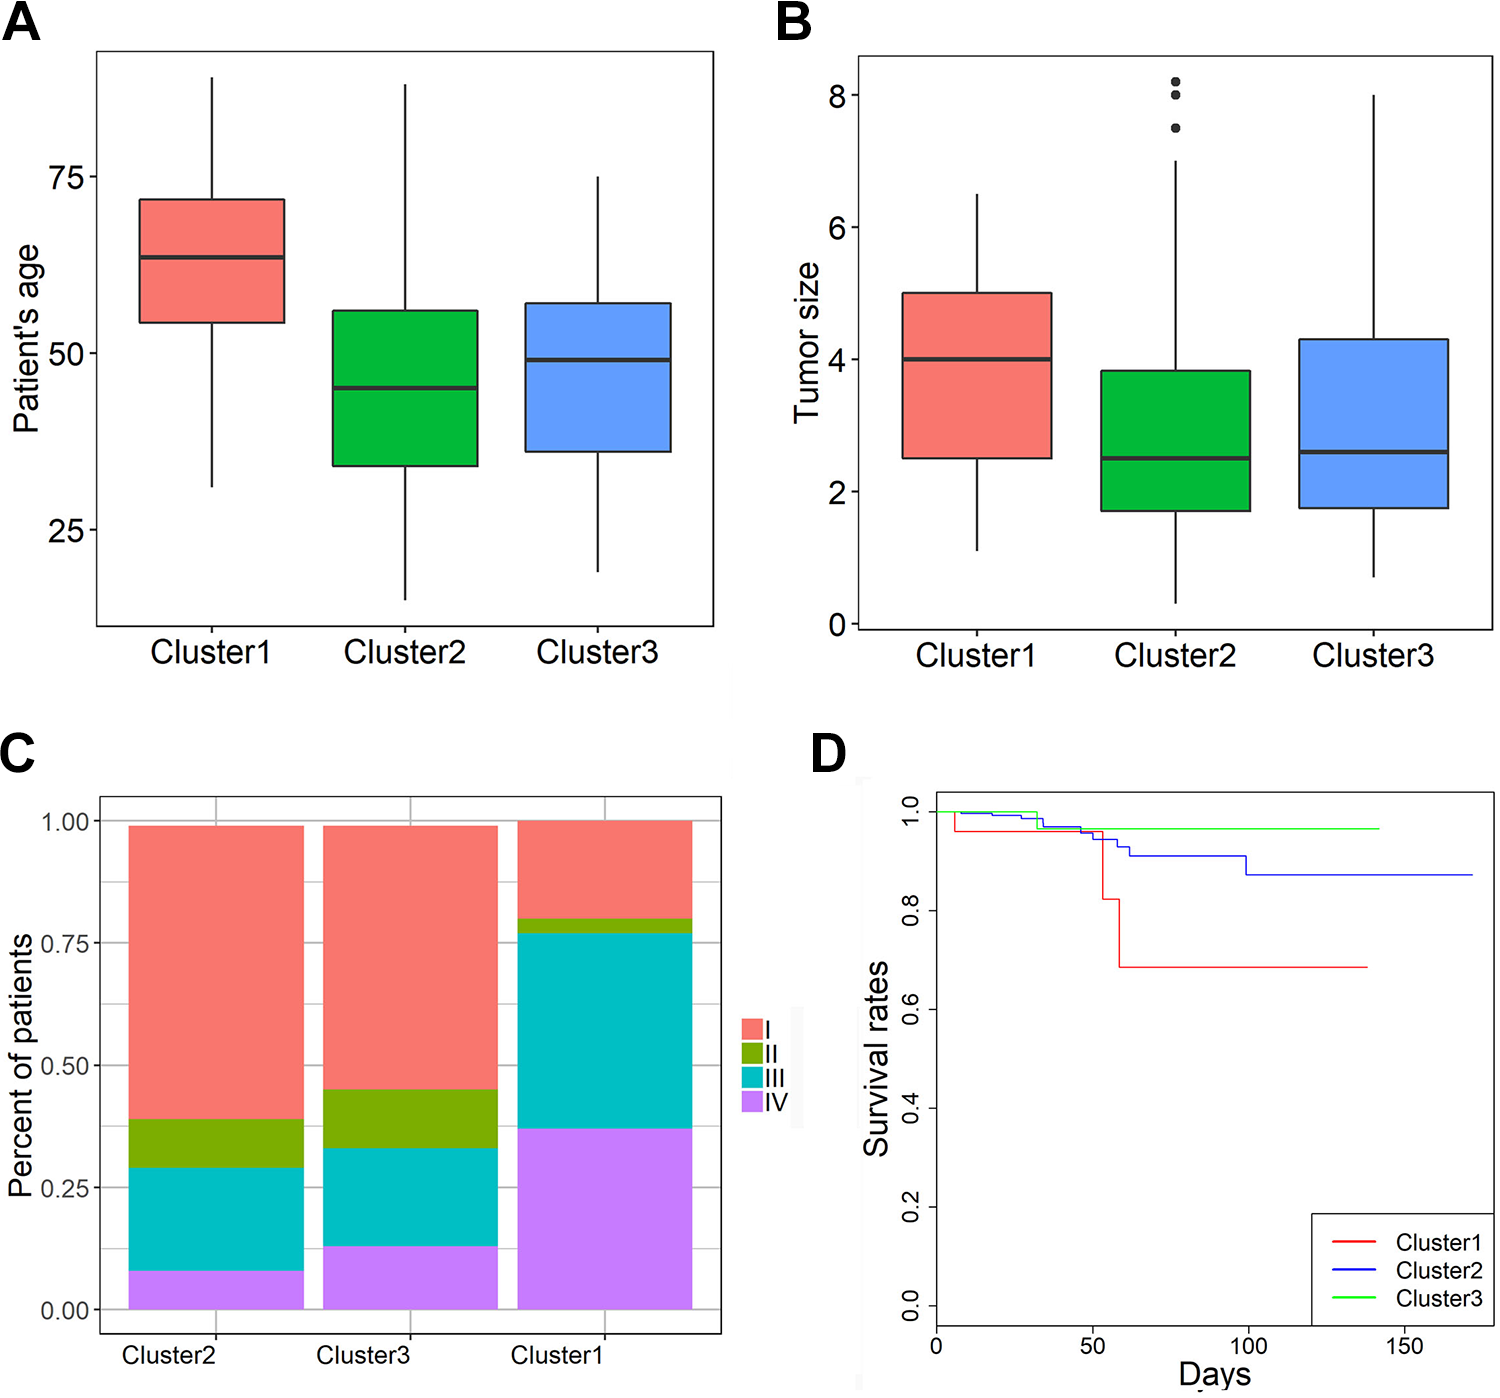
Differences in patient age (A), tumor size (B), cancer stage (C) and survival rates (D) among the 3 clusters of thyroid cancer patients (1–3).
Analyses of Clinical Features in Thyroid Cancer
We acquired RNAseq and clinical features data from the TCGA database to evaluate the associations of driver gene mRNA expression and clinical features of thyroid cancer patients. Overall, no driver genes were significantly correlated with patient outcome (Q value > 0.3, Cox regression test). However, many driver genes were negatively correlated with the number of metastatic lymph nodes (35 genes) and tumor size (47 genes) and positively correlated with the number of metastatic lymph nodes (73 genes) and tumor size (11 genes) (Supplementary Tables 3 and 4). The high expression of 69 genes was associated with a higher pathologic stage, while high expression of the other 64 genes was associated with a lower pathologic stage (Supplementary Table 5). Sixteen genes, including IL7 R, IRS1, PTK2B, MAP3K3 and FGFR2, were significantly associated with the number of metastatic lymph nodes, tumor size and pathologic stage (Figure 5), which suggests that these genes might be potential druggable targets in thyroid cancer patients in the future.

Clinical features analyses of the driver gene FGFR2 in thyroid cancer. A. A missense mutation was observed in the immunoglobulin I-set (I-set) domain (264-359 amino acids), which causes the amino acid change K296 N; B. The negative correlation between FGFR2 expression and the number of metastatic lymph nodes in thyroid cancer patients (correlation coefficient -0.15, p value = 0.003); C. the negative correlation between FGFR2 expression and tumor size in thyroid cancer patients (correlation coefficient -0.13, p value = 0.008); D. the distribution of FGFR2 expression across pathologic stages in thyroid cancer patients (kruskal-wallis test, p value = 0.0002).
Discussion
Driver genes are well recognized as mutated genes which confer a selective advantage to cancer cells. Modern large-scale sequencing of human cancers seeks to comprehensively discover driver genes. As there is no generally accepted gold standard of driver genes, several computational algorithms have been developed to find genes that drive cancer based on their patterns of mutation in large patient cohorts. OncodriveFM 14 compares the functional impact scores of actual mutations within the gene with a permutated model and predicts drivers that are enriched for somatic mutations with high impact. OncodriveCLUST is a method to detect driver genes with a significant bias toward a large spatial clustering within the protein sequence. 13 iCAGES identifies driver genes by associating cancer driver coding, noncoding, and structural variations to genes using a statistical model with prior biological knowledge of cancer driver genes for specific subtypes of cancer. 16 DrGaP integrates biological knowledge of the mutational process in tumors, including the length of protein-coding regions, transcript isoforms, variation in mutation types, differences in background mutation rates, redundancy of the genetic code, and multiple mutations in one gene. There is no driver gene was detected by the 4 methods and the majority of predicted driver genes were method-specific. This might be because the 4 computational tools used different algorithms as discussed above to prioritize driver genes, therefore, the combination of these 4 tools can identify the set of driver genes in a more comprehensive manner than MutSigCV alone 8 or OncodriveFM 11 which are dependent on the somatic mutation frequencies and enrichment of high functional impact mutations respectively.
In this study, we detected 291 cancer genes in 405 thyroid cancer samples using OncodriveCLUST, OncodriveFM, iCAGES and DrGaP. In line with previously published studies, BRAF, HRAS, NRAS, KRAS, EIF1AX, PPM1D and CHEK2 were found to be significantly mutated driver genes in thyroid cancer. 8 Compared with annotated oncogene 28 and tumor suppressor gene 29 databases, we found 48 known oncogenes, including ETS1, CTNNB1, IGF1 R, PDGFRB, ITGA3 and MET as well as 50 tumor suppressor genes, including PTEN, TP53, BRCA2, BAP1 and ITGB3. Most driver genes showed low or moderate mutation frequencies and were first reported as driver genes in thyroid cancer, such as CD163L1, ANKRD54, DNASE2, FAM83 H and MAP3K3. For instance, MAP3K3 is a member of the MAPK family and a serine/threonine kinase that regulates cellular processes via activating the ERK, JNK, and p38 signaling pathways in response to cellular stresses and growth factors. 30 MAP3K3 is an oncogene that promotes tumor progression and metastasis in ovarian carcinoma 31 and confers resistance to apoptosis in breast and ovarian cancers. 32 Moreover, MAP3K3 is an indicator of poor prognosis in esophageal squamous cell carcinoma, 33 ovarian cancer 31 and cervical cancer. 34
The WGCNA package comprises a series of R functions to detect coexpression modules of highly correlated genes and associates interested modules to clinical traits. 19 In this study, we determined that modules 1-3 were related to clinical traits (Figures 2 and 3 and Table 1), and we also determined their hub genes SEC24B, MET and ITGAL. SEC24B is a member of the SEC24 subfamily of the SEC23/SEC24 family, which is involved in vesicle trafficking. Mutations in this gene are associated with human neural tube defects. 35 MET is an oncogene encoding a receptor for hepatocyte growth factor and plays a key role in various cancers. Amplification and overexpression of this gene are associated with multiple human cancers and indicates a poor prognosis of cancer patients. 36 -42 ITGAL is an integrin expressed in a tissue-specific fashion and is important in inflammatory and immune responses. 43 The activating NK cell receptor 2B4 engagement mediates rapid ITGAL and actin-dependent NK cell adhesion to tumor cells, which is essential for the initiation and execution of cellular cytotoxicity. 44 ITGAL is an important mediator through which BCR-ABL1 inhibits SDF-1 adhesive responses in leukemia cells. 45 In addition, ITGAL gene polymorphisms are associated with sporadic infiltrative duct breast carcinoma. 46 Therefore, the hub genes in modules 1-3 are implicated in the molecular pathogenesis of various cancers, which suggests that they may have crucial functions in thyroid cancer.
Hierarchical clustering analysis of 20 genes that were most frequently deleted or amplified uncovered 3 subgroups of thyroid cancer patients. Cluster1 tumors were associated with older age, increased tumor size, higher cancer stages, and poorer prognosis. Therefore, CNV analysis of these 20 genes might have clinical value in the near future. Cytologic or surgical specimens of thyroid cancer exhibiting high levels of CNVs in these 20 genes are expected to be associated with poor prognosis. Therefore, more aggressive treatment or frequent follow-up may be recommended for these patients.
Last, no driver genes were significantly correlated with clinical outcomes in thyroid cancer patients, which might be due to the limited number of death events (16/501) in the survival analysis. However, 16 genes were significantly associated with the number of lymph nodes, tumor size and pathologic stage, such as IL7 R, IRS1, PTK2B, MAP3K3 and FGFR2. FGFR2 is a member of the FGFR family, which plays key roles in multiple biologic processes such as tissue repair, angiogenesis, embryonic development and cancer. 47 Decreased FGFR2 expression was correlated with a high proliferation rate and poor prognosis in high-grade glioma, which suggests that FGFR2 might function as a tumor suppressor gene in glioma. 48 However, FGFR2 may have oncogenic functions in other cancer types, such as pancreas cancer, 49 papillary renal cell carcinoma 50 and esophagogastric junction adenocarcinoma. 51 Enhanced expression of FGFR2 isoforms was found to downregulate the expression of fibronectin, MAGE-A3 and MMP9, while the expression of p21 and dephosphorylation of Rb was increased, which causes the inhibition of invasion and tumor growth and metastasis in thyroid epithelial cancer cells. 52 The results obtained in our study in combination with published literature support the idea that FGFR2 has either tumor suppressor or oncogenic functions in cancers.
Conclusion
Taken together, the integrative omics study enabled the identification of the set of driver genes and 3 subgroups of thyroid cancer patients. The driver genes and pathways identified herein such as FGFR2 pave the way for developing prognostic biomarkers and therapeutic targets in thyroid cancer.
Supplemental Material
Supplemental Material, Supplementary_Figure1 - The Integrated Analyses of Driver Genes Identify Key Biomarkers in Thyroid Cancer
Supplemental Material, Supplementary_Figure1 for The Integrated Analyses of Driver Genes Identify Key Biomarkers in Thyroid Cancer by Qili Xu, Aili Song and Qigui Xie in Technology in Cancer Research & Treatment
Supplemental Material
Supplemental Material, Supplementary_Figure2 - The Integrated Analyses of Driver Genes Identify Key Biomarkers in Thyroid Cancer
Supplemental Material, Supplementary_Figure2 for The Integrated Analyses of Driver Genes Identify Key Biomarkers in Thyroid Cancer by Qili Xu, Aili Song and Qigui Xie in Technology in Cancer Research & Treatment
Supplemental Material
Supplemental Material, Supplementary_Figure3 - The Integrated Analyses of Driver Genes Identify Key Biomarkers in Thyroid Cancer
Supplemental Material, Supplementary_Figure3 for The Integrated Analyses of Driver Genes Identify Key Biomarkers in Thyroid Cancer by Qili Xu, Aili Song and Qigui Xie in Technology in Cancer Research & Treatment
Supplemental Material
Supplemental Material, Supplementary_Figure4 - The Integrated Analyses of Driver Genes Identify Key Biomarkers in Thyroid Cancer
Supplemental Material, Supplementary_Figure4 for The Integrated Analyses of Driver Genes Identify Key Biomarkers in Thyroid Cancer by Qili Xu, Aili Song and Qigui Xie in Technology in Cancer Research & Treatment
Supplemental Material
Supplemental Material, Supplementary_Figure5 - The Integrated Analyses of Driver Genes Identify Key Biomarkers in Thyroid Cancer
Supplemental Material, Supplementary_Figure5 for The Integrated Analyses of Driver Genes Identify Key Biomarkers in Thyroid Cancer by Qili Xu, Aili Song and Qigui Xie in Technology in Cancer Research & Treatment
Supplemental Material
Supplemental Material, Supplementary_Figure6 - The Integrated Analyses of Driver Genes Identify Key Biomarkers in Thyroid Cancer
Supplemental Material, Supplementary_Figure6 for The Integrated Analyses of Driver Genes Identify Key Biomarkers in Thyroid Cancer by Qili Xu, Aili Song and Qigui Xie in Technology in Cancer Research & Treatment
Supplemental Material
Supplemental Material, Supplementary_Figure7 - The Integrated Analyses of Driver Genes Identify Key Biomarkers in Thyroid Cancer
Supplemental Material, Supplementary_Figure7 for The Integrated Analyses of Driver Genes Identify Key Biomarkers in Thyroid Cancer by Qili Xu, Aili Song and Qigui Xie in Technology in Cancer Research & Treatment
Supplemental Material
Supplemental Material, Supplementary_tables - The Integrated Analyses of Driver Genes Identify Key Biomarkers in Thyroid Cancer
Supplemental Material, Supplementary_tables for The Integrated Analyses of Driver Genes Identify Key Biomarkers in Thyroid Cancer by Qili Xu, Aili Song and Qigui Xie in Technology in Cancer Research & Treatment
Footnotes
List of abbreviations
Authors’ Note
The views expressed in the submitted article are his own and not an official position of the institution or funder.
Declaration of Conflicting Interests
The author(s) declared no potential conflicts of interest with respect to the research, authorship, and/or publication of this article.
Funding
The author(s) disclosed receipt of the following financial support for the research, authorship, and/or publication of this article: This study was supported by Health and Family Planning Commission of Zhejiang Province (no 2018ZD022) and Zhejiang Provincial Natural Foundation of China (no LY19H180005).
Supplemental Material
Supplemental material for this article is available online.
References
Supplementary Material
Please find the following supplemental material available below.
For Open Access articles published under a Creative Commons License, all supplemental material carries the same license as the article it is associated with.
For non-Open Access articles published, all supplemental material carries a non-exclusive license, and permission requests for re-use of supplemental material or any part of supplemental material shall be sent directly to the copyright owner as specified in the copyright notice associated with the article.