
Abstract
This study aims to achieve intelligent monitoring of clothing comfort in motion, providing data and technical assistance for the research of comfort in motion and an efficient design foundation for sportswear comfort optimization. In view of the present situation of smart wear used in clothing comfort research, this paper primarily presents the construction of an acquisition system in motion, including temperature, humidity, and pressure data acquisition device, data pre-processing, data storage, and so on, which was called the ATHPD system for short. With the help of this acquisition system, tights in motion may now be tested for pressure, heat, and humidity for the first time. It can also transmit data wirelessly. Meanwhile, in order to verify the effectiveness of the acquisition system, by comparing the measurement data of the acquisition system (ATHPD system) with the measurement data of existing acquisition equipment (AMI3037 pressure measurement system, DS1923 button temperature and humidity recorder). The findings demonstrate that there is no significant difference between the data collected by the two methods, which proves the reliability of the acquisition system in this paper. The system guarantees the same quantity of temperature, humidity, and pressure data to be gathered at the same time and the consistency of the corresponding time points and also provides relevant data support for the evaluation and prediction model construction of human comfort in motion.
Introduction
Research on the relationship between clothing and the internal physiological structure of the human body, providing the scientific theoretical underpinnings for clothing design and production, has long been a focus of the clothing industry.1,2 Of particular importance is the comfort of clothing when participating in motion, as this has a significant impact on the wearers’ performance. For instance, wearing uncomfortable sportswear not only impedes natural mobility, but also has several detrimental consequences on physiological well-being and even may be dangerous to one’s health.3–5 However, for a variety of reasons, the comfort during human activities has not been thoroughly investigated, such as insufficient effective real-time monitoring of clothing comfort data (i.g., pressure, temperature, or humidity),6–8 which leads to the difficulty in enhancing the comfort optimization design of sportswear.
Researchers have long preferred the objective assessment of comfort (i.g. pressure, temperature, and humidity),9,10 and key instruments for this assessment of garment comfort include the sensors for these data. But there are several challenges with objective evaluation, which primarily evident in the costly and complex operation of heavy machinery. The instrument’s mobility is restricted for internal reasons, making it impossible to capture real-time data when the device is in motion. The most common types of data measuring systems are those for temperature, humidity, and pressure. Among them, the Pliance-X pressure system (Novel Company, Germany), the Flexiforce-based pressure system (Tekscan Inc., USA), AMI airbag contact pressure measurement system (AMI, Japan), the clothing pressure measuring system Labview-based and so on are widely used as clothing pressure testing systems.6,11–15 There are three primary categories of temperature sensors: solid-state temperature sensors, thermocouple temperature sensors, and resistance temperature sensors. Most of these three types of sensors are converted into digital sensors by temperature and humidity sensitive elements and corresponding circuits, which are convenient for computers, PLC(Programmable Logic Controller), intelligent instruments and other data acquisition equipment to directly read and obtain digital quantities, which can be called digital temperature and humidity sensors. Digital temperature sensor has simple interface, good interchangeability, convenient use and high temperature resolution, but it has nonlinear error and zero error 16 and large temperature lag. 17 In addition, some scholars think that physiological methods are not suitable for evaluating clothing comfort because of their poor repeatability,18,19 and they are time-consuming and labor-intensive. 20
A range of sensor measuring equipment have recently been directly manufactured based on Arduino, and active research has been conducted utilizing it both domestically (in China) and internationally.21–23 The Arduino platform is capable of receiving the input values from various switches or sensors, and by printing the data obtained, it may produce a range of environmentally and physiologically friendly items. According to this perspective, the field is one that merits investigation. The Arduino board is more affordable than other microcontroller platforms, and it is easier to use because it runs on Linux, Mac OS X, and Windows. Furthermore, since the Arduino hardware and software are open-source products, obtaining the expanded software library created by professionals and using it to build the necessary modules is simple. The software development environment also has the benefit of allowing the built firmware to be uploaded via USB.
Numerous study cases exist about the use of Arduino in equipment development. Among these, Anik et al. developed a cost-effective IoT-based remote health monitoring system tailored for asthma patients to provide real-time relavant data feedback, in order to minimize hospitalization . 24 Nwibor et al. and Reddy et al.25,26 developed a heart rate measurement system. In addition, many scholars have developed meteorological observation equipment27,28 and other fields,29–31 respectively. It is evident from the research that Arduino encompasses a variety of areas and domains. Nevertheless, there are not many reports on Arduino-based garment comfort sensing devices as of yet.
In view of the fact that the existing data acquisition equipment for the temperature, humidity, and pressure of the dressed human body is primarily used to collect these data under static conditions, due to the working principle or structural design of the equipment. Therefore, it is difficult to effectively obtain the real-time changes of the temperature, humidity, and pressure of the dressed human body under conditions of continuous movement. Additionally, it is challenging to provide effective data support for the study of tights’ comfort in motion. This topic will develop an Arduino-Based measurement system with a low-power for acquiring temperature, humidity and pressure on human body surface when wear these tight sportswear in motion (it is called the ATHPD system for short). This system will solve the issues of poor stability and data lag in current human dynamic data collection and avoid the limitations of experiments (such as the running state, experimental site, and data collection restrictions). The novel measuring method enables the collection of batch and real-time data in the human long-term exercise condition, including physiological markers. In parallel, a comparison is made between the designed measurement system and the current measuring apparatus in order to confirm the system’s practicality and dependability. This work will provide technical service support for the acquisition of clothing comfort data in motion and the improvement of motion monitoring function of intelligent wear, in addition to offering new design ideas for real-time monitoring and transmission of physiological health parameters.
Composition and working principle of measuring device
The primary focus of this topic’s research is on the analysis and study of thermal, humidity, and pressure comfort. Hence, these data collection is required. This study created these data acquisition devices, respectively, in order to efficiently gather pertinent data. The Arduino-centered software and hardware designs mostly incorporate the acquisition system. The real-time data obtained by the pressure and temperature and humidity sensors implanted in the tights is processed, compared, analyzed, and completely judged. The data is then sent and received through the Bluetooth function, and all of the data is stored during the workout.
The collection equipment developed for this study is capable of receiving pertinent data on the computer side in addition to pertinent real-time data through mobile phones. In light of the fact that a certain transmission distance occurs between measuring equipment and mobile phones or PC terminals, Bluetooth chips with extensive connection ranges, low power consumption, and excellent performance should be chosen.
Composition and working principle of arduino micro-controller
As one of the best Arduino micro-controllers, the Arduino Nano 33 BLE satisfies the transmission distance needs of acquisition system by supporting Bluetooth technology with a long effective connection range and low power consumption. Its Nordic nRF52840-based Bluetooth module. Low-power Bluetooth, or Bluetooth Low Energy (short for BLE), has received a lot of praise and is extensively utilized in intelligent identification, medical care, UAV systems (Unmanned Aerial Vehicle systems), and other industries.32–37 The composition diagram of Arduino Nano 33 BLE was shown in Figure 1. Composition diagram of arduino nano 33 BLE.
38

Compared with traditional Bluetooth (see Table 1), low-power Bluetooth aims to maintain the same communication range while significantly reducing power consumption and cost.
The Arduino Nano 33 BLE satisfies the requirements of a measuring installation for power consumption and data transfer and boasts excellent reliability, rapid connection times, low costs, low power consumption, transmission distance, and high security. Thus, the Arduino Nano 33 BLE is used in this study to design and create the installation of pressure, temperature, and humidity sensors.
The Bluetooth capability of the Arduino Nano 33 BLE is used in this research to achieve wireless data transmission. The transmitting terminal: An FSR(Force Sensing Resistors) sensor is connected to an Arduino Nano 33 BLE to record pressure data in motion, and a DHT22 sensor is used to record temperature and humidity data. To receive data gathered by sensors, a mobile phone or a computer is connected to an Arduino Nano 33 BLE. The following are this research installation’s benefits: (1) To achieve the transmission of collected data, i.e., sending and receiving, Bluetooth low-power technology is used, which eliminates the movement constraints caused by the collection apparatus and allows for the long-term real-time acquisition of temperature, humidity, and pressure data while in motion. (2) Data can be collected via a mobile phone, which allows us to always monitor changes in data, store data, or collect data via a computer. (3) The data can be directly stored in Matlab, i.e., visualized, and the real-time changes of data can be understood more intuitively.
Composition and working principle of pressure data acquisition device
The four most popular types of pressure sensors on the market are piezoresistive, capacitive, piezoelectric, and inductive. The current sensors have several drawbacks when it comes to pressure acquisition in motion. 41 For instance, inductive pressure sensors cannot be used in high-frequency dynamic environments. The extensibility of the piezoelectric pressure sensor is poor due to its low moisture resistance, which results in poor DC responsiveness of the output that requires the use of an external charge amplifier or high input impedance circuit. The capacitive pressure sensor’s output result is nonlinear, so that the distribution of bypass and parasitic capacitance will have a significant impact on the test’s sensitivity and accuracy. Additionally, building a circuit is more difficult. In summary, the appropriate equipment is required to quantify the delicate pressure that clothing exerts on the human body, but since much of it is expensive and a foreign product, clothing firms face practical challenges in their day-to-day operations. Thus, the creation of an affordable and useful measurement tool is required. Still, many academics are interested in the creation of piezoresistive flexible sensors.
Piezoresistive flexible sensor, referred to as FSR for short, is an electrical component that changes its resistance due to the change of pressure, and can be used for sensing force-sensitive resistors characterized by touch and weight change. When pressure is applied to the sensing area, the resistance of the sensor will change. The greater the pressure, the smaller the resistance.
42
At the same time, it will cause the change of output voltage. The greater the pressure, the greater the output voltage. Currently, the most popular sensor for measuring contact force or pressure is the piezoresistive flexible sensor. It is inexpensive, small, light, and requires low power consumption. It also performs exceptionally well in terms of linearity, temperature drift suppression, and other areas. It offers strong static and dynamic tracking capabilities and is simple to implement into a variety of scenarios. Furthermore, a large test range, easy selection, and several items are available for the piezoresistive flexible sensor. Currently available in a variety of price ranges, piezoresistive flexible sensors come in numerous varieties. According to some relevant research, we learned that the maximum pressure of tight-fitting clothes is 12.73 kPa,
43
therefore, the value is used as the basis for selecting the pressure sensor in this investigation. The piezoresistive pressure sensor IMS-C10 A offered by Aidong Technology is used in this study, the sensor is shown in Figure 2, which is composed of a matrix polymer material containing conductive substances (carbon black/metal powder/graphene/carbon nanotubes, etc.) sandwiched between two polymer films. Polymer materials are carriers of conductive materials, which are flexible and non-conductive. Conductive materials provide carriers, and the whole sensor has a great resistance effect (≥1 Mohm) because of the low carrier density when it is not subjected to normal pressure. After the normal load is applied to the front of the sensor, the carrier carried by the base material is deformed, so that the carrier spacing changes to form a conductive channel, which reduces the resistance of the sensor. Piezoresistive flexible sensors have been widely used in many fields, and achieved good research results, such as medical care, insoles, mattresses, engineering and so on.44–47 Piezoresistive pressure sensor.
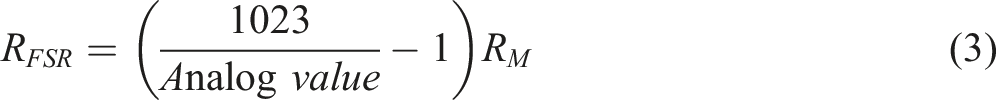
According to the characteristic that the resistance value of FSR is inversely proportional to the pressure on its surface, Figure 3 is a basic circuit connection diagram. FSR and pull-down resistor RM are connected in series in the circuit, and a VREF reference voltage is applied at both ends of the circuit. The ADC (Analog-to-Digital Converter) pin of MCU(microcontroller) is connected between FSR and RM, and the value of VOUT voltage is detected by using the functional MCU of ADC.
The calculation formula of output voltage is as follows:


Calculated by formulas (1) and (2):
An suitable pull-down resistor must be chosen in order to guarantee high linearity and sensitivity of the acquisition circuit. Figure 4 clearly illustrates how the resistance values of the pull-down resistor (RM) greatly impact the output voltage variation, hence impacting the measurement accuracy. In this study, a pull-down resistor with a resistance value of 10KΩ is chosen because it exhibits good sensitivity in both high and low pressure regions, and because it improves the linearity of the FSR pressure sensor. Influence of different resistance values of pull-down resistor RM on output voltage VOUT
50
.
The Nano 33 BLE’s virtual serial ports (A0-A7) is linked to a pressure sensor, and all data sent from these ports are binary. Following the extraction of each sensor’s digital value, the binary data have to be converted back to 0-1023, or, to put it another way, the voltage’s analog value needs to be converted to a digital number between 0 and 1023, as shown in Figure 5. Next, determine the actual value using the voltage-pressure relationship. Sensor signal transmission and transformation process.
Composition and working principle of temperature and humidity data acquisition device
This module mainly adopts DHT22 (digital temperature and humidity sensor 22), as shown in Figure 6. The DHT22 is a composite temperature and humidity sensor51–53 that has a calibrated digital signal output, is small, light, low power consumption, and has strong anti-interference capabilities. It also measures relative humidity and temperature and operates in a stable manner over an extended period of time. An NTC(Negative Temperature Coefficient) temperature sensor and a resistive humidity sensor are both managed by an 8-bit single-chip micro-controller. As a result, the DHT22 sensor may be used in sensing technologies and digital temperature and humidity data gathering due to its high dependability and outstanding long-term stability. Its precise digital calibration mechanism and the transmitted calibrated digital signal are its sources. The DHT22 circumvents the drawbacks of conventional temperature and humidity sensors, including their simple circuit, small design, ease of installation in clothes, and difficulties in calibration and maintenance. The DHT22 sensor has the following measurement ranges: −40 to 80°C for temperature, with an accuracy of 0.1°C; 0% to 100% for humidity (the humidity in the whole paper all mean relative humidity), with an accuracy of 0.1%. The sensor has proven useful in a variety of industries, including weather, agriculture, and computer rooms.54,55 DHT22 sensor.
The digital serial ports D2-D12 of Nano 33 BLE are connected with temperature and humidity sensors, respectively, and then the collected temperature and humidity data are transmitted to Arduino Nano 33 BLE in the form of digital signals for processing. The DHT22 data is divided into decimal parts and integer parts, and the current decimal part is used for later expansion, and now it is read as zero; the measurement resolutions are 8bit (temperature) and 8bit (humidity), respectively, that is, the data format of DHT22 is the sum of “8bit humidity integer data+8bit humidity decimal data+8bit temperature integer data+8bit temperature decimal data”.
The working principle of the system is as follows: the temperature and humidity sensor DHT22 detects the temperature and humidity in the indoor environment, and DHT itself uses the automatic conversion function, that is, the analog signal can be converted into a digital signal without A/D conversion, and then the converted data is sent to the Arduino Nano 33 BLE controller. The single chip microcontroller converts the detected temperature and humidity high and low level data into decimal data through a specific calculation formula, and sends the decimal data to the receiving end through the Bluetooth transmission module. Figure 7 is about the transmission process of temperature and humidity data. Sensor signal transmission and transformation process.
Design and implementation of heat, humidity and pressure acquisition system
The ATHPD system, the acquisition installation designed in this paper, integrates pressure, temperature, and humidity. Its efficacy and viability were confirmed in the preceding section. As a result, this acquisition system will be used for the project’s data collection. The Arduino Nano 33 BLE is used to implement the ATHPD system. It is equipped with a temperature, humidity, and pressure sensor and is used to gather and transmit data in motion. Real-time data visualization is achieved by first using Matlab R2017a to save the data from the Arduino Nano 33 BLE serial port and then using another Arduino Nano 33 BLE to receive the data from the sensor. About the schematic diagram of the acquisition system, as shown in Figure 8. Schematic diagram of temperature and humidity-pressure.
The acquisition system is composed of FSR pressure sensor, DHT22 digital temperature and humidity sensor, 10kΩ resistor and Arduino Nano 33 BLE, and is divided into two modules: sending module and receiving module. The sending module includes Arduino Nano 33 BLE, FSR pressure sensor, DHT22 digital temperature and humidity sensor, 10kΩ resistor, 9V power bank or battery (9V power supply can be selected because the normal working voltage of Arduino is 5-12V, it can continuously supply power for the acquisition system for at least 20 h), Teflon ultra-fine tinned copper conductor (about 1.37 Ω/m, with a diameter of 0.28 mm) and PCB conductive plate. The receiving module includes Arduino Nano 33 BLE, computer or mobile phone with Bluetooth function.
While the DHT22 temperature and humidity sensor and the FSR pressure sensor gather data, the Nano 33 BLE uses Bluetooth to transmit the data to the receiving PC or smartphone. The data is shown in real time and is automatically saved and visualized using Matlab R2017a, allowing for a more intuitive understanding of how the temperature, humidity, and pressure are changing. Sending and receiving data is the most crucial area of communication with a Bluetooth module as it involves the bottom function, making hexadecimal data transmission more vital. Additionally, the acquisition system is capable of wireless transmission and long-term data collecting.
Calibration and error analysis of acquisition device
In order to ensure the reliability and accuracy of the acquisition installation, the pressure sensor FSR and the temperature and humidity sensor DHT22 were calibrated and the error was analyzed before the experiment.
Pressure sensor calibration and error analysis
The instruments for calibrating the pressure sensor are TTI 1906 Computing Multimeter (Thurlby Thandar Instruments Ltd) and VOLTCRAFT MT52-ISO Calibrated Multimeter, as shown in Figure 9. Calibration of universal instruments. (a)TTI 1906 computing multimeter (b)VOLTCRAFT MT52-ISO calibrated multimeter.
There are many kinds of sensors, especially the range is very different, so the selection of sensors should be based on the measurement target pressure range to ensure the accuracy of measurement data.
Then, the C10 A sensor is calibrated by using M1 standard weights of 5g, 10g, 20g, 50g, 100g, 200g, 500g and combined weights (5g + 10 g, 10g + 50 g, 20g + 50 g), that is, the C10 A sensor measures the pressure under various grams of weights, and each calibration weight or combined weight is measured five times, with each loading time lasting for 1 minute. Measure the resistance value during loading with calibrated universal instrument and Arduino IDE, respectively, and finally fit the pressure value with the resistance value to obtain the equation between them, as shown in Figure 10 and equation (4). Calibration curve of pressure sensor.
Fitting equation of pressure value and resistance value:

From R2 = 0.9968, it can be seen that the fitting degree between pressure and resistance is good, which also reflects that pressure can better characterize resistance.
The pressure on the sensor is obtained by formulas (3) and (4):

According to some references 56–61, the clothing pressure range and temperature and humidity received by human body during exercise are simulated. Then, the difference between the actual pressure and the pressure calculated by the sensor measurement data is analyzed by independent sample T test.
Through formula (5), the true value of clothing pressure at each pressure collection point can be obtained, that is, the pressure data can be calculated through the virtual voltage output by the single chip microcontroller Nano 33 BLE, and the measured pressure value can be compared with the actual pressure value, as shown in Figure 11 and the difference between them can be compared through independent sample inspection, as shown in Table 2. Actual pressure and measured pressure value.
As can be seen from Table 2, about the Levene’s Test for Equality of Variances, significance value = 0.938 > 0.05, and there is no significant difference between the variance of the two groups of data (simulated pressure value and actual pressure value), so it can be considered that the variance of the two independent samples is consistent; T test shows that the significance (double tail) is 0.915 > 0.05, so there is no significant difference between the two data, which also shows that the pressure sensor used in this project can measure the surface load well.
The stability of pressure measured by FSR is verified first, because the measured resistance is compared with the calculation, which shows the effectiveness of pressure measured by FSR. Then, the voltage of the sensor is calculated by the virtual value measured by FSR, and the mathematical model of virtual voltage and pressure is established, which is actually the virtual value to predict pressure.
Finally, in order to be consistent with the existing unit of clothing pressure, the final mathematical model of tight clothing pressure is shown in formula (6).

Calibration and error analysis of DHT22 sensor
In order to ensure the reliability and accuracy of the temperature and humidity collected by DHT22 sensor,
52
the temperature and humidity are adjusted by the control device in the climate chamber (the varied temperature and humidity in the room are shown in Table 3), and then the temperature and humidity data of 25 min collected by DHT22 and RTS-1911 thermometer are compared, as shown in Figure 12, Tables 4 and 5. At the same time, the sensitivity and accuracy of DHT22 measurement are detected by continuous change and large change of temperature and humidity. Comparison between measured data of temperature and humidity sensor and real data.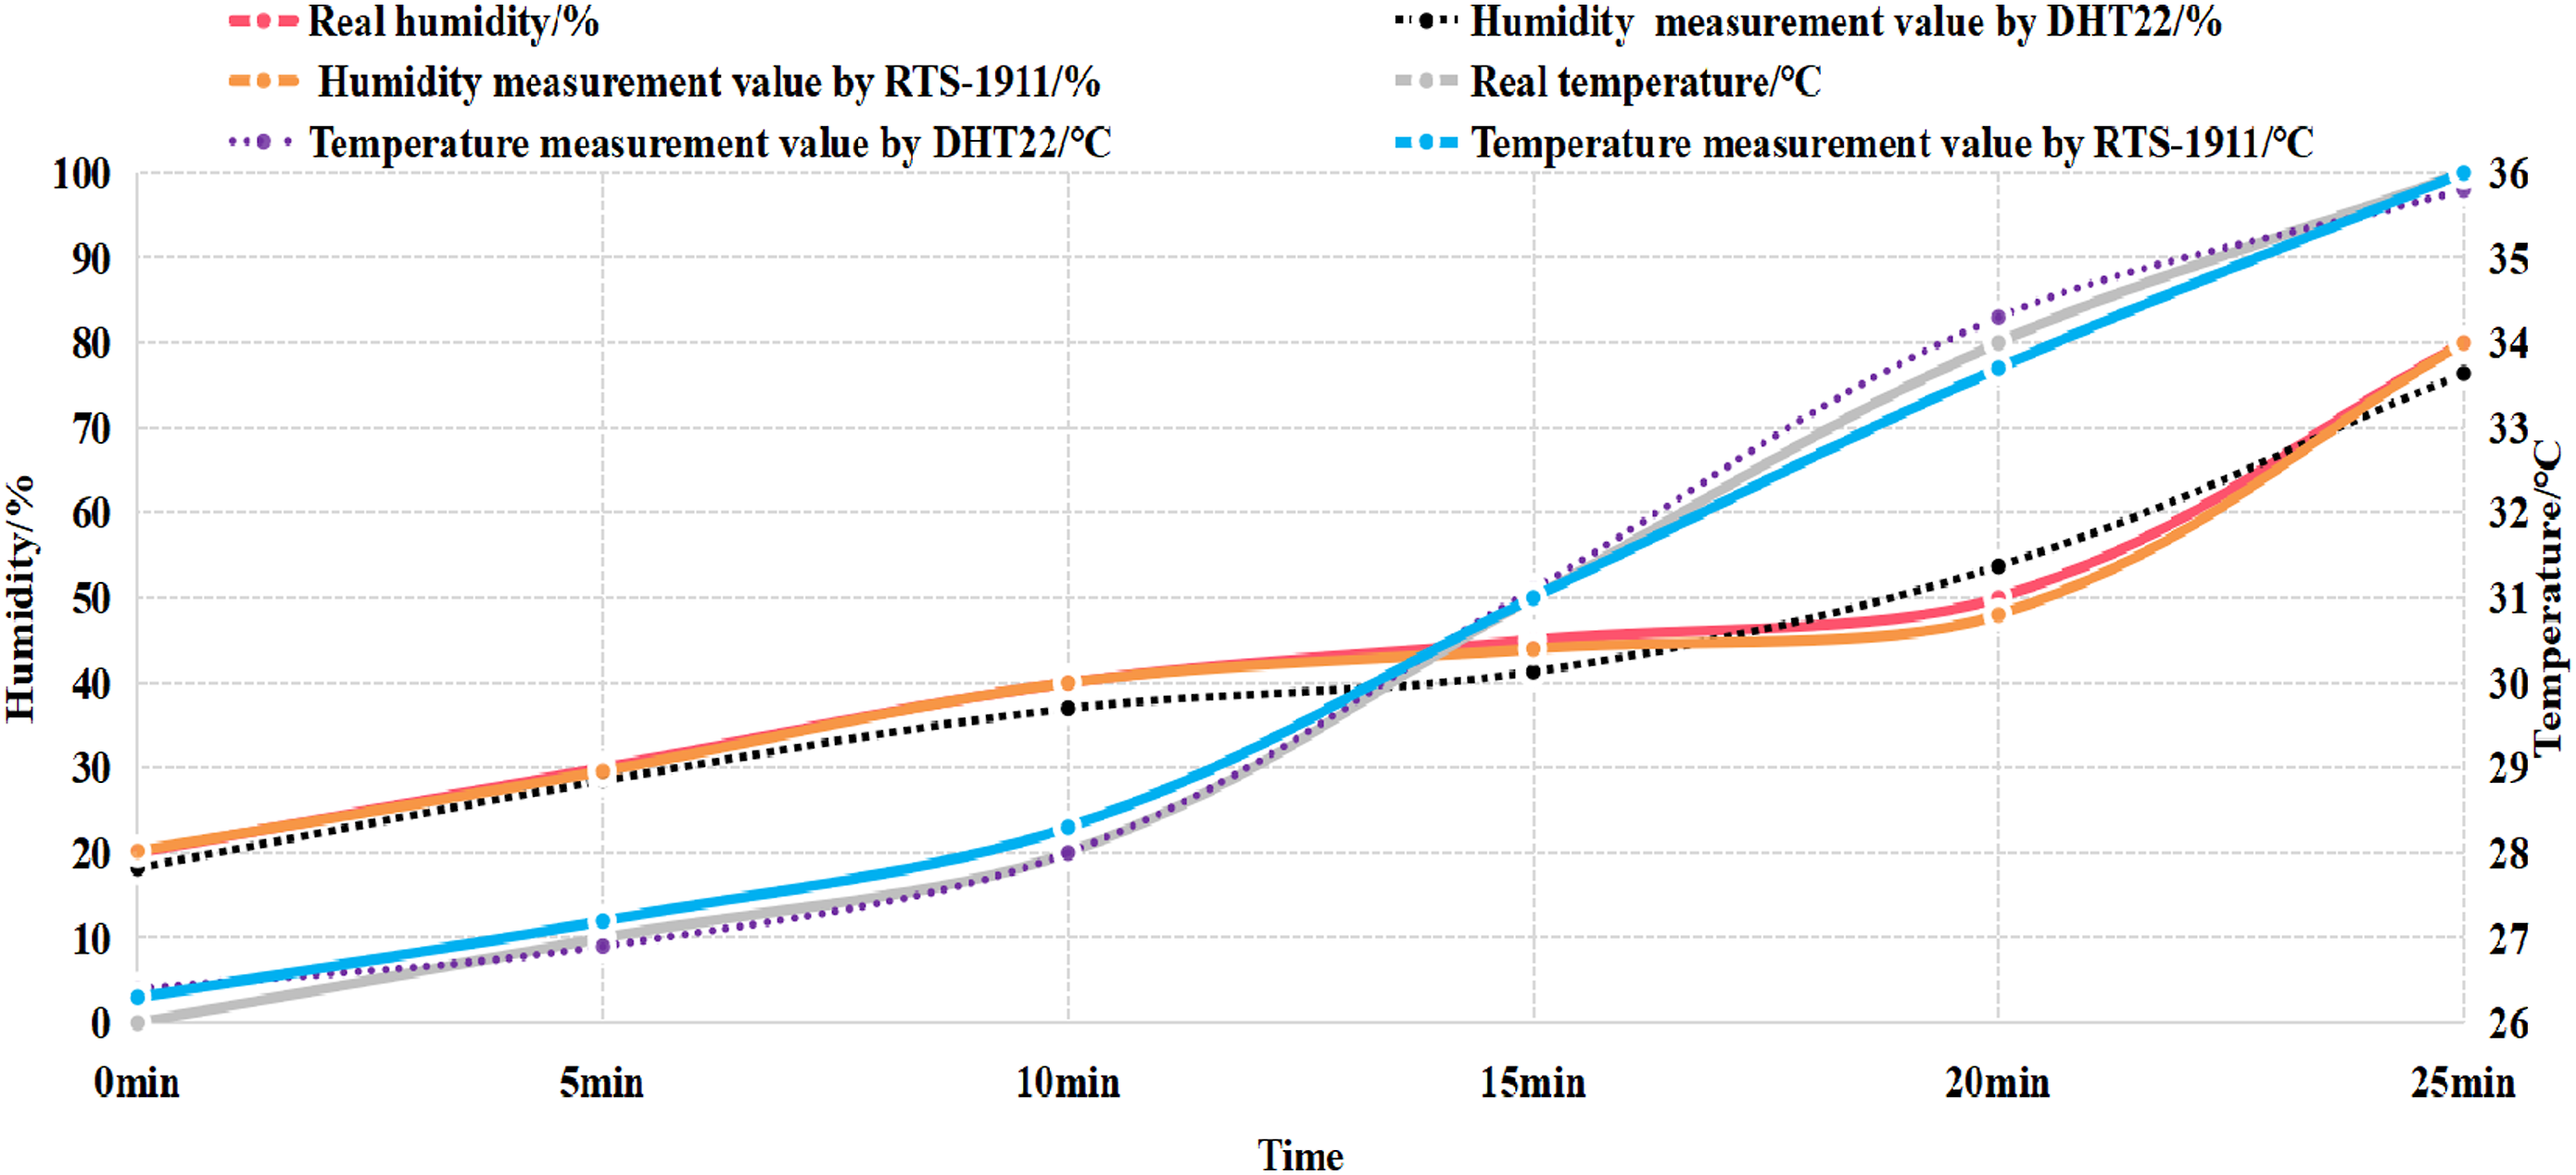
From Tables 4 and 5, it can be seen that the actual temperature and the temperature measured by the sensor: Levene variance equivalence test, significance = 0.986 > 0.05, and there is no significant difference between the variance of the two groups of data (the temperature measured by DHT and the actual temperature), so it can be considered that the variance of the two independent samples is consistent. T test shows that the significance (double-tailed) is 0.972 > 0.05, so there is no significant difference between the two data.
Actual humidity and humidity measured by sensor: about Levene’s Test for Equality of Variances, significance value = 0.911 > 0.05, there is no significant difference between the variance of two groups of data (humidity measured by DHT and actual humidity), so it can be considered that the variance of two independent samples is the same; T test shows that the significance (two-tailed) is 0.892 > 0.05, so there is no significant difference between the two data.
The above results can show that DHT22 can be used to measure temperature and humidity.
By verifying the data of FSR pressure sensor and DHT22 temperature and humidity sensor, the feasibility and effectiveness of pressure sensor and temperature and humidity sensor are verified, that is, these two types of sensors can be used in this study.
Design of data pre-processing and storage of acquisition device
Design and application of acquisition data pretreatment
Although the pressure sensor and temperature and humidity sensor used have good anti-interference performance, some noise may be generated during the acquisition process in the moving state, so filter the collected data. Combined with the data characteristics of this topic, this topic chooses Kalman filter to denoise the collected pressure and temperature and humidity data.
Stanley Schmidt invented a type of data processing technique called Kalman filtering, which makes use of the linear system state equation. It is a type of data processing technique that restores actual data by eliminating noise. By using programming, this filtering may be used to update and analyze the gathered data in real time, as well as anticipate the state of a dynamic system from a series of noisy data. 62 Currently in use, the Kalman filter is a popular filtering technique that works well in a variety of applications, including navigation, radar signals, and images.63–66
The basic principle of Kalman filter: take the minimum variance as the best estimation criterion, use the estimated value of the previous moment and the observed value of the current moment to update the estimation, and adjust the gain matrix of the filter to estimate the value of the current moment. Its construction process (see Figure 13 for the frame diagram): predict from the known initial value Kalman filtering process.
Time update: (1) Prior estimated value:

(2) Prior error covariance matrix:

Measurement update: (1) Kalman filter gain equation (weight):

(2) The updated prior estimate (posterior estimate) (the optimal value at time t) which combines the predicted value and the observed value:

(3) Update covariance (covariance of posterior error) (updated estimation error is obtained from the estimation error of predicted value) (optimal mean square error at time t):

Part of core codes are shown in Code 1 in Appendix.
Design of data storage
Due to the excessive data collected by sensors, this project designed to collect data every 2 s, with a total movement time of 50 min, so the number of temperature, humidity or pressure data collected by each sensor is 1500. An example of data acquisition is shown in Figure 14. Example of temperature and humidity-pressure data acquisition. Note: val 1, val 3, val 5 and val 7 respectively represent the measured humidity value; val 2, val 4, val 6 and val 8 respectively represent the measured temperature value; val 9, val 10, val 11 and val 12 respectively represent the measured pressure value.
Arduino serial data is automatically saved in.xls format using Matlab R2017a in order to speed up data storage and enable serial communication between Matlab R2017a and Arduino. The following are a few core codes are shown in Code 2 in Appendix.
If the receiver is a mobile phone, the data received by the phone is in hexadecimal format and must be converted to decimal and then stored.
In short, in the field of comfort measurement, people usually use pressure sensors and temperature and humidity sensors to analyse comfort. These two types of sensors can help people measure factors such as pressure and humidity between the human body and the environment to evaluate people’s comfort. In sensor measurement, comfort is a function or time series, not a single value.
For pressure sensors and heat and humidity sensors, the values they provide can provide a basic assessment of the comfort level of the human environment. Although these sensors can provide an accurate value at any time, comfort is a function that changes over time. When the conditions of the human environment change, the sensor can indicate the components of the change, but it cannot express the view that comfort is only a point.
Comfort is a function or time series that is fully reflected by the time dimension. In the process of time evolution, the changes in the human environment can be detected by sensors. On this basis, the sensor data (temperature, humidity, pressure data), comfort changes and other factors such as fabrics are put into one dimension, and by connecting them through time, we can understand how the comfort changes, so as to get the time series of comfort.
In sensor measurement, the correlation between the distribution of the sensor measurement and comfort is very important for studying comfort. Because the sensor can sense the connection between the human body and the environment, we can find some rules of comfort change. For example, the overall comfort of the back is determined by a series of measurements, and the data obtained after these measurements are interrelated.
Experimental details
The measurement results of clothing pressure, human temperature, and humidity when wearing tight sportswear are compared with those using existing equipment to evaluate the viability of the project’s measuring system and to further confirm its efficacy and accuracy.
Experimental content and method
The pressure measuring module of the developed acquisition system and AMI 3037-10 pressure measuring system (with the range of 0-34 kPa and the minimum accuracy of 0.1 kPa, Japan) (see Figure 15), the temperature and humidity measuring module of the developed acquisition system (temperature and humidity measuring module) and DS1923 button temperature and humidity recorder (the effectiveness of this measuring instrument has been verified in literature.67,68 Specific implementation details: Initially, two young men with comparable body types (both 23 years old and with heights of 174.7 cm and 175.2 cm, respectively; the weights are, respectively, 69.4 kg and 70.1 kg.) were chosen as test participants. The individuals next donned tight sportswear (88% polyester, 12% spandex for the tight tops and 88% polyester, 10% spandex, 2% nylon for the tight pants) (Tight tops size: chest girth is 76.8 cm, shoulder sleeve length is 71 cm, garment length is 67 cm; Tight pants size: waist girth is 69.8 cm, hip girth is 6.2 cm, Pant lateral length is 92.8 cm). Lastly, the individuals engaged in a variety of actions, including standing, bending 90°, elevating their legs, and jogging at a speed of 6 km/h on a treadmill. In parallel, the AMI 3037 pressure system and the pressure measuring module were used to measure the pressure in the back and shank under each of the four motions. One minute was spent resting, 1 minute elevating one’s leg, and 1 minute bending. The sensors of the AMI3037 pressure system or the C10 A sensors were placed at the positions of sensor 1 and sensor 3, respectively. And the DS1923 button temperature and humidity recorders or DHT 22 sensors were placed at the positions of sensor 2 and sensor 4, as shown in Figure 16. However, the temperature and humidity measurement module only measures the temperature and humidity of the Back and Shank during running (for 20 min). AMI 3037-10 airbag pressure tester. Sensors installation position.

Subjects
5 male personnel were recruited as initial experimental participants, as noted M1, M2, M3, …, M5, respectively. These are their average body size measurements: height (175.5 ± 0.5) cm, total shoulder width (45.6 ± 0.8) cm, middle thigh circumference (52.6 ± 0.6) cm, chest circumference (93.8 ± 1.1) cm, back length (43.2 ± 0.7) cm, hip circumference (94.5 ± 0.9) cm, upper arm length (32.3 ± 0.9) cm, shoulder angle (21.6 ± 1.2)°, shank circumference (35.3 ± 0.8) cm, waist circumference (79.2 ± 1.1) cm, back inclination (24.1 ± 1.1) cm, and BMI (21.2 ± 0.8). All participants have many years of running experience, and were free of disease. They were asked to avoid intense exercise, refrain from alcohol and caffeine 24h before the test.
Results and discussion
The pressure measurement results of the acquisition system
The average pressure of Back and Shank measured by two kinds of pressure measuring installations under each action is obtained, respectively, as shown in Table 6. And compare the two testing results by independent sample test, as shown in Table 7.
Table 7 shows that the Sig. values of measurement value between AMI3037 pressure monitoring system and the pressure measuring device designed for this project are 0.546, 0.352, 0.418, 0.667, 0.713, and 0.692, respectively, indicating that when standing, lifting legs, running, and bending down. It means that the pressure values acquired by the AMI3037 pressure measuring device and the pressure values obtained by the pressure measuring apparatus designed in this research do not significantly differ in variance.
Temperature and humidity measurement results of the acquisition system
The measuring system was attached to Back and Shank of the subjects, and then they wore tights and ran (on a treadmill at a speed of 6 km/h). The temperature and humidity of Back and Shank were measured by the acquisition system.
In this paper, the temperature and humidity values measured by DS1923 button temperature and humidity recorder are taken as the actual values of temperature and humidity, and the temperature and humidity values measured by acquisition system and DS1923 button temperature and humidity recorder and their differences are compared, as shown in Table 8.
As can be seen from Table 8, there is small discrepancy between the project’s acquisition system’s measured and real temperature and humidity values. For instance, the difference between the measured and real Shank temperatures is 0.1108°C, while the temperature differential value on back is 0.5618°C. The measured and real humidity value differs on these body parts by 2.2747% and 2.6742%, respectively. The conclusion drawn from the results analysis is that there is little difference between the temperature and humidity measurement module of the acquisition system and the actual temperature and humidity values. This indicates that the acquisition system’s temperature and humidity measurement module in this paper has a good level of reliability.
Comparison of measurement results between acquisition system with Kalman filter and acquisition system without Kalman filter
In order to verify the advantages of integrating Kalman filter algorithm into the system, this paper reprocesses the acquisition system: the Kalman filter algorithm in the acquisition system is removed and recorded as an acquisition system without Kalman filter.
The subjects’ Back and Shank were measured by the acquisition system without Kalman filter algorithm, the acquisition system with Kalman filter algorithm and AMI3037 pressure system, respectively, and then they wore tights (tights material: 88% polyester, 12% spandex; tight-fitting sweatpants are made of 88% polyester, 10% spandex and 2% nylon), and do some actions such as standing, lifting legs (90°), bending over (90°) and running (on a treadmill at 6 km/h). The pressure of Back and Shank parts under action is measured by these three pressure systems. The measurement time is 1 min at rest, 1 min at leg lifting, 1 min at bending, 5 min at running, and the total test time is 8 min. The acquisition system without Kalman filter algorithm, the acquisition system with Kalman filter algorithm and DS1923 button temperature and humidity recorder measure the temperature and humidity of Back and Shank during running (the test time is 20 min), respectively.
The measurement results of the acquisition system without Kalman filter algorithm, the acquisition system with Kalman filter algorithm, AMI3037 pressure system measurement and DS1923 button temperature and humidity recorder are compared, respectively, as shown in Table 9 and Figure 17. Comparison of temperature and humidity measurements values between acquisition systems with and without Kalman filtering.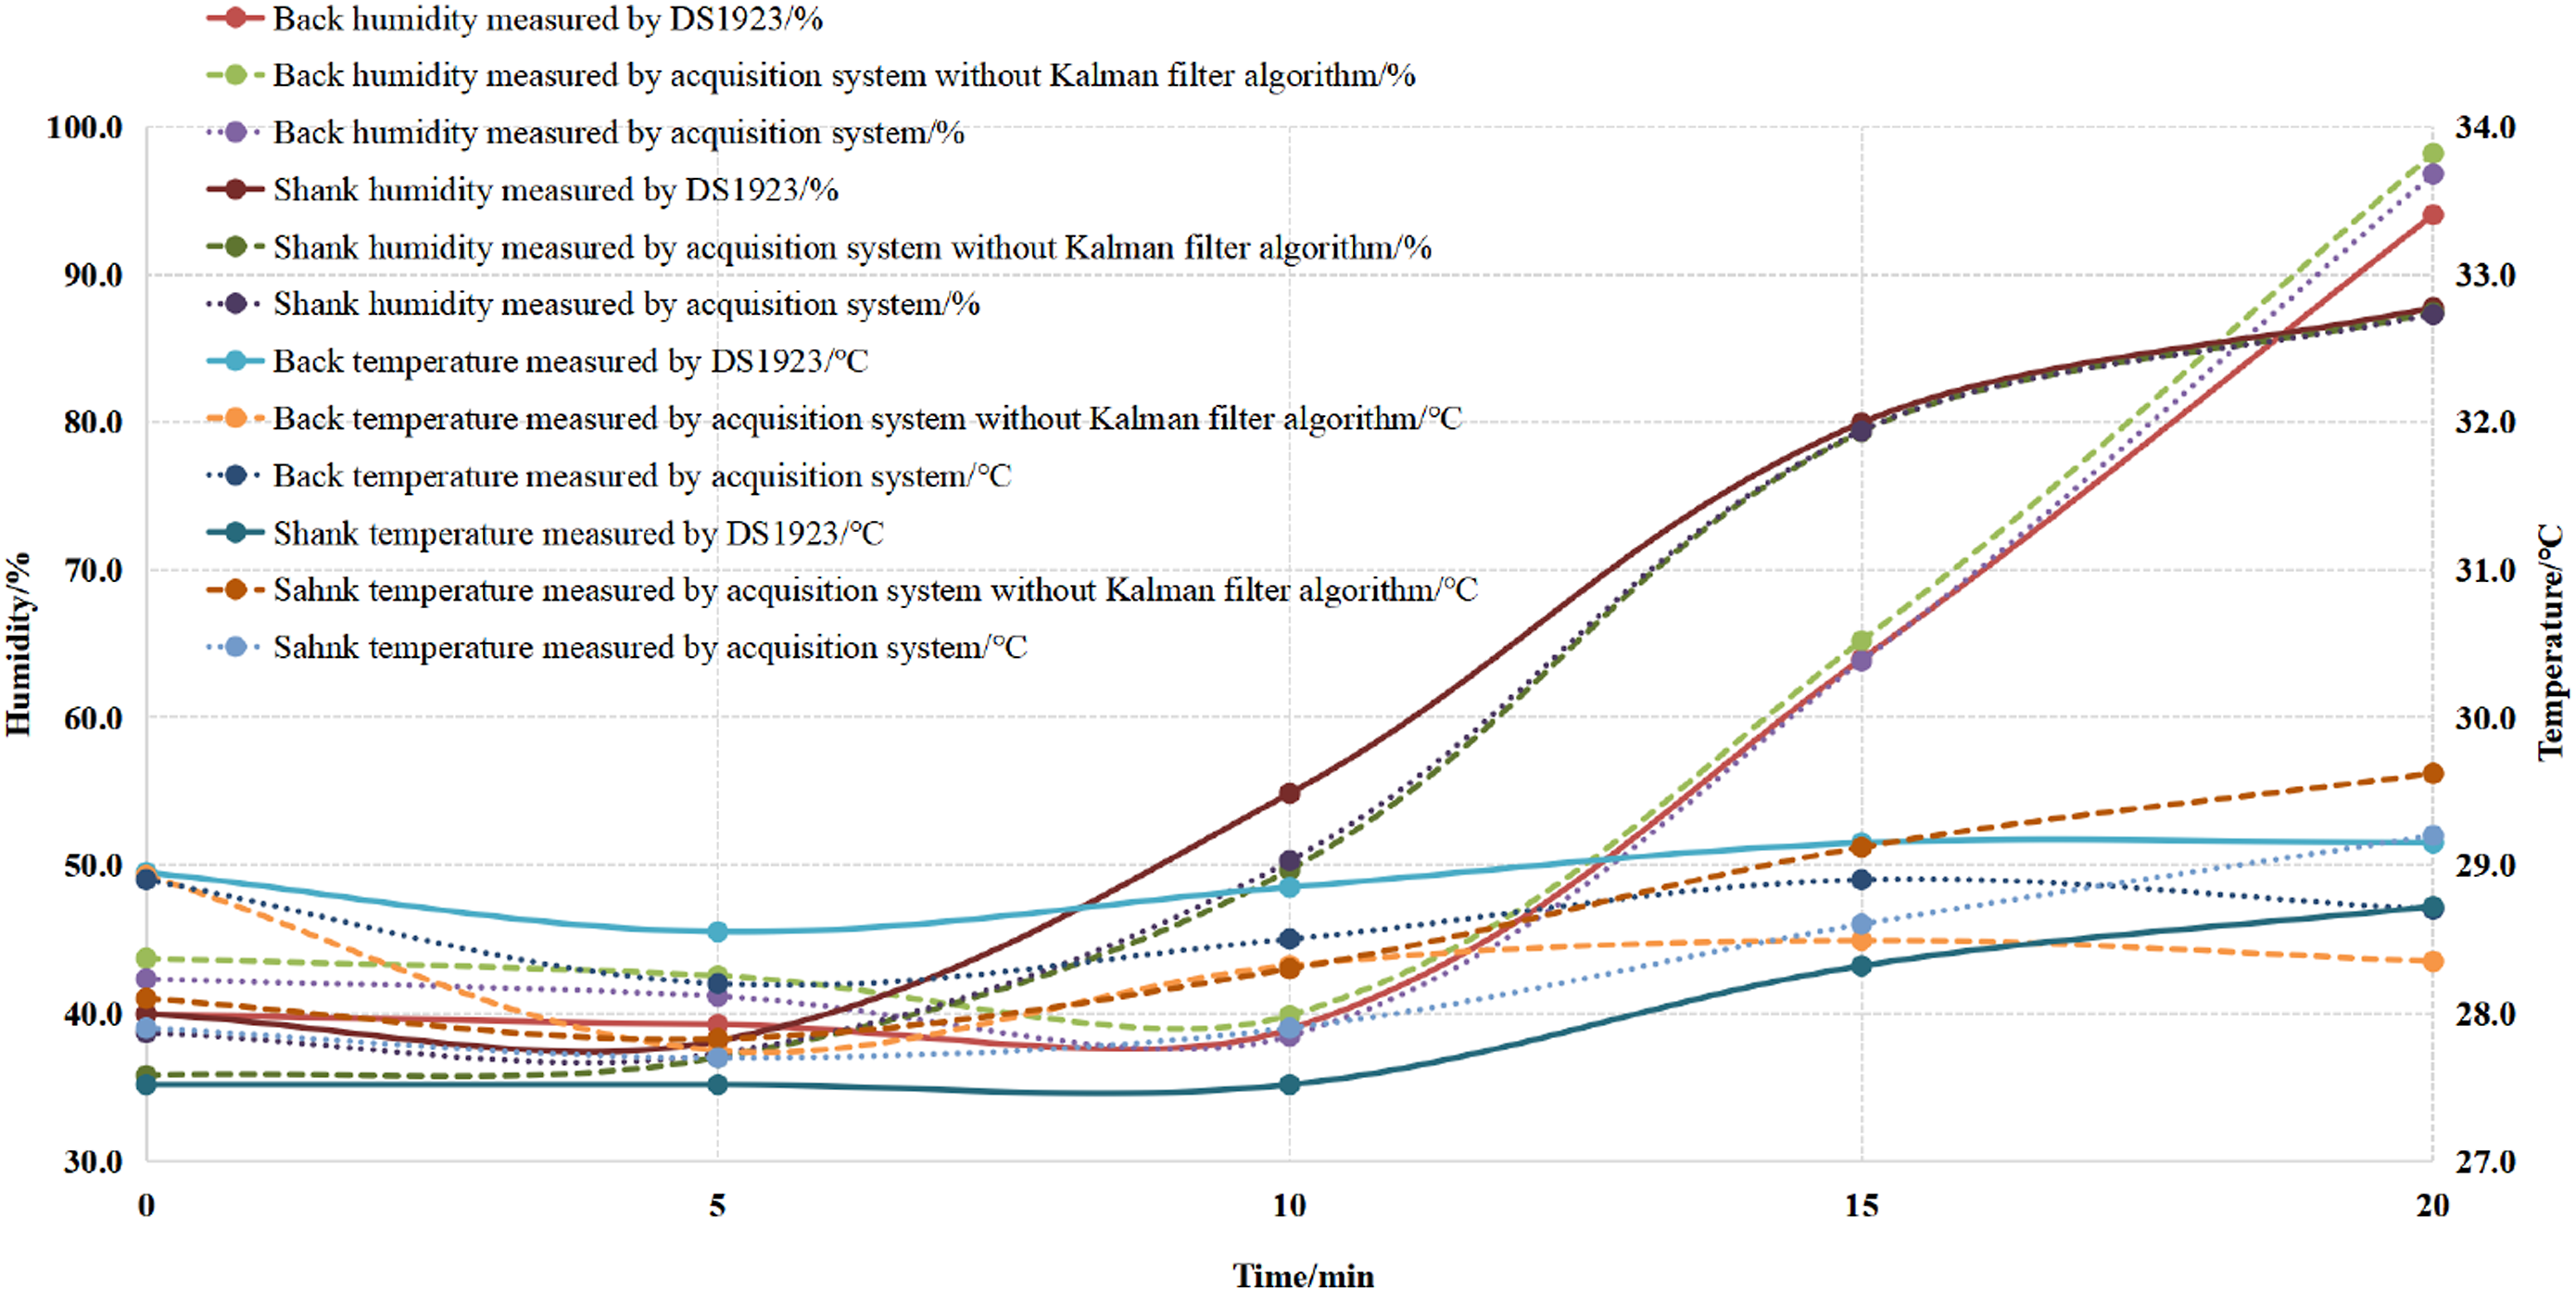
As can be seen from Table 9, there are some differences between the pressure measured by the acquisition system with and without Kalman filter in the states of standing, leg lifting, bending and running. For example, when standing, the pressure measured by the acquisition system with Kalman filter is 1.76 kPa, and the pressure measured by the acquisition system without Kalman filter is 1.79 kPa, which shows that there will be noise when collecting pressure in the state of movement and noise will affect the pressure data. In four states, such as standing, leg lifting, bending and running, the pressure values measured by the acquisition system with Kalman filter algorithm are closer to those measured by AMI3072 pressure measurement system, and the pressure values obtained by the pressure measurement system with filter algorithm are closer to those measured by AMI3037, which shows that the pressure measurement system with filter algorithm improves the pressure measurement accuracy of human movement to some extent.
See Figure 17 for the comparison of temperature and humidity measurement results of acquisition system without Kalman filter algorithm, acquisition system with Kalman filter algorithm and DS1923 button temperature and humidity recorder.
Figure 17 demonstrates that, to some extent, the Kalman filter algorithm improves the measurement accuracy of temperature and humidity and illustrates the effect of noise reduction. The temperature and humidity obtained by the acquisition system with the Kalman filter algorithm are closer to the actual temperature and humidity value.
To sum up, the integration of Kalman filter algorithm into the pressure, temperature and humidity acquisition system has improved the accuracy and precision of pressure and temperature and humidity data.
The application and verification of the collection system demonstrate that it is capable of gathering effectively not only the body’s temperature, pressure, and humidity while it is in motion, but also of remotely monitoring, automatically storing, and retrieving the necessary data. It also offers technical support for the collection of dynamic comfort data for sportswear and the enhancement of smart wearable devices’ motion monitoring capabilities when they are in continuous operation.
Conclusion
The construction of the temperature, humidity, and pressure acquisition system (ATHPD system) under motion state is covered in this work. This includes the data pre-processing, data storage, and temperature, humidity, and pressure data collection device. For the first time, the tights’ pressure, heat, and humidity tests at the same time are completed while the tights are worn in motion, and the designed measurement system could acquire these data effectively. Its innovative approach also includes the suggestion to analyze temperature, humidity, and pressure simultaneously in order to investigate sports comfort. This will help to overcome the shortcomings of current comfort performance evaluation apparatus, better assess wearers’ actual circumstances while physical activities, and provide data to support the development of an all-encompassing dynamic comfort evaluation model. In addition, the system’s architecture guarantees the consistency of the corresponding time points and the same quantity of temperature, humidity, and pressure data to be recorded simultaneously, so guaranteeing the efficacy of the comfort evaluation. This study offers technological support for the monitoring of clothing comfort in a sports condition and a foundation for sportswear comfort optimization, as well as novel design concepts for the real-time monitoring and transmission of human physiological health data.
Footnotes
Declaration of conflicting interests
The author(s) declared no potential conflicts of interest with respect to the research, authorship, and/or publication of this article.
Funding
The author(s) disclosed receipt of the following financial support for the research, authorship, and/or publication of this article: This work was supported the from 2023 Fujian Provincial Social Science Foundation project (FJ2023B081), 2023 Minjiang University Fashu Charity Foundation Donated Funds Research Project (No. MFS23010), 2022 Fujian Province Education Science “Fourteen Fifth Plan” Project (No. FJJKBK22-011).
Appendix
Comparison of wireless data communication technologies.39,40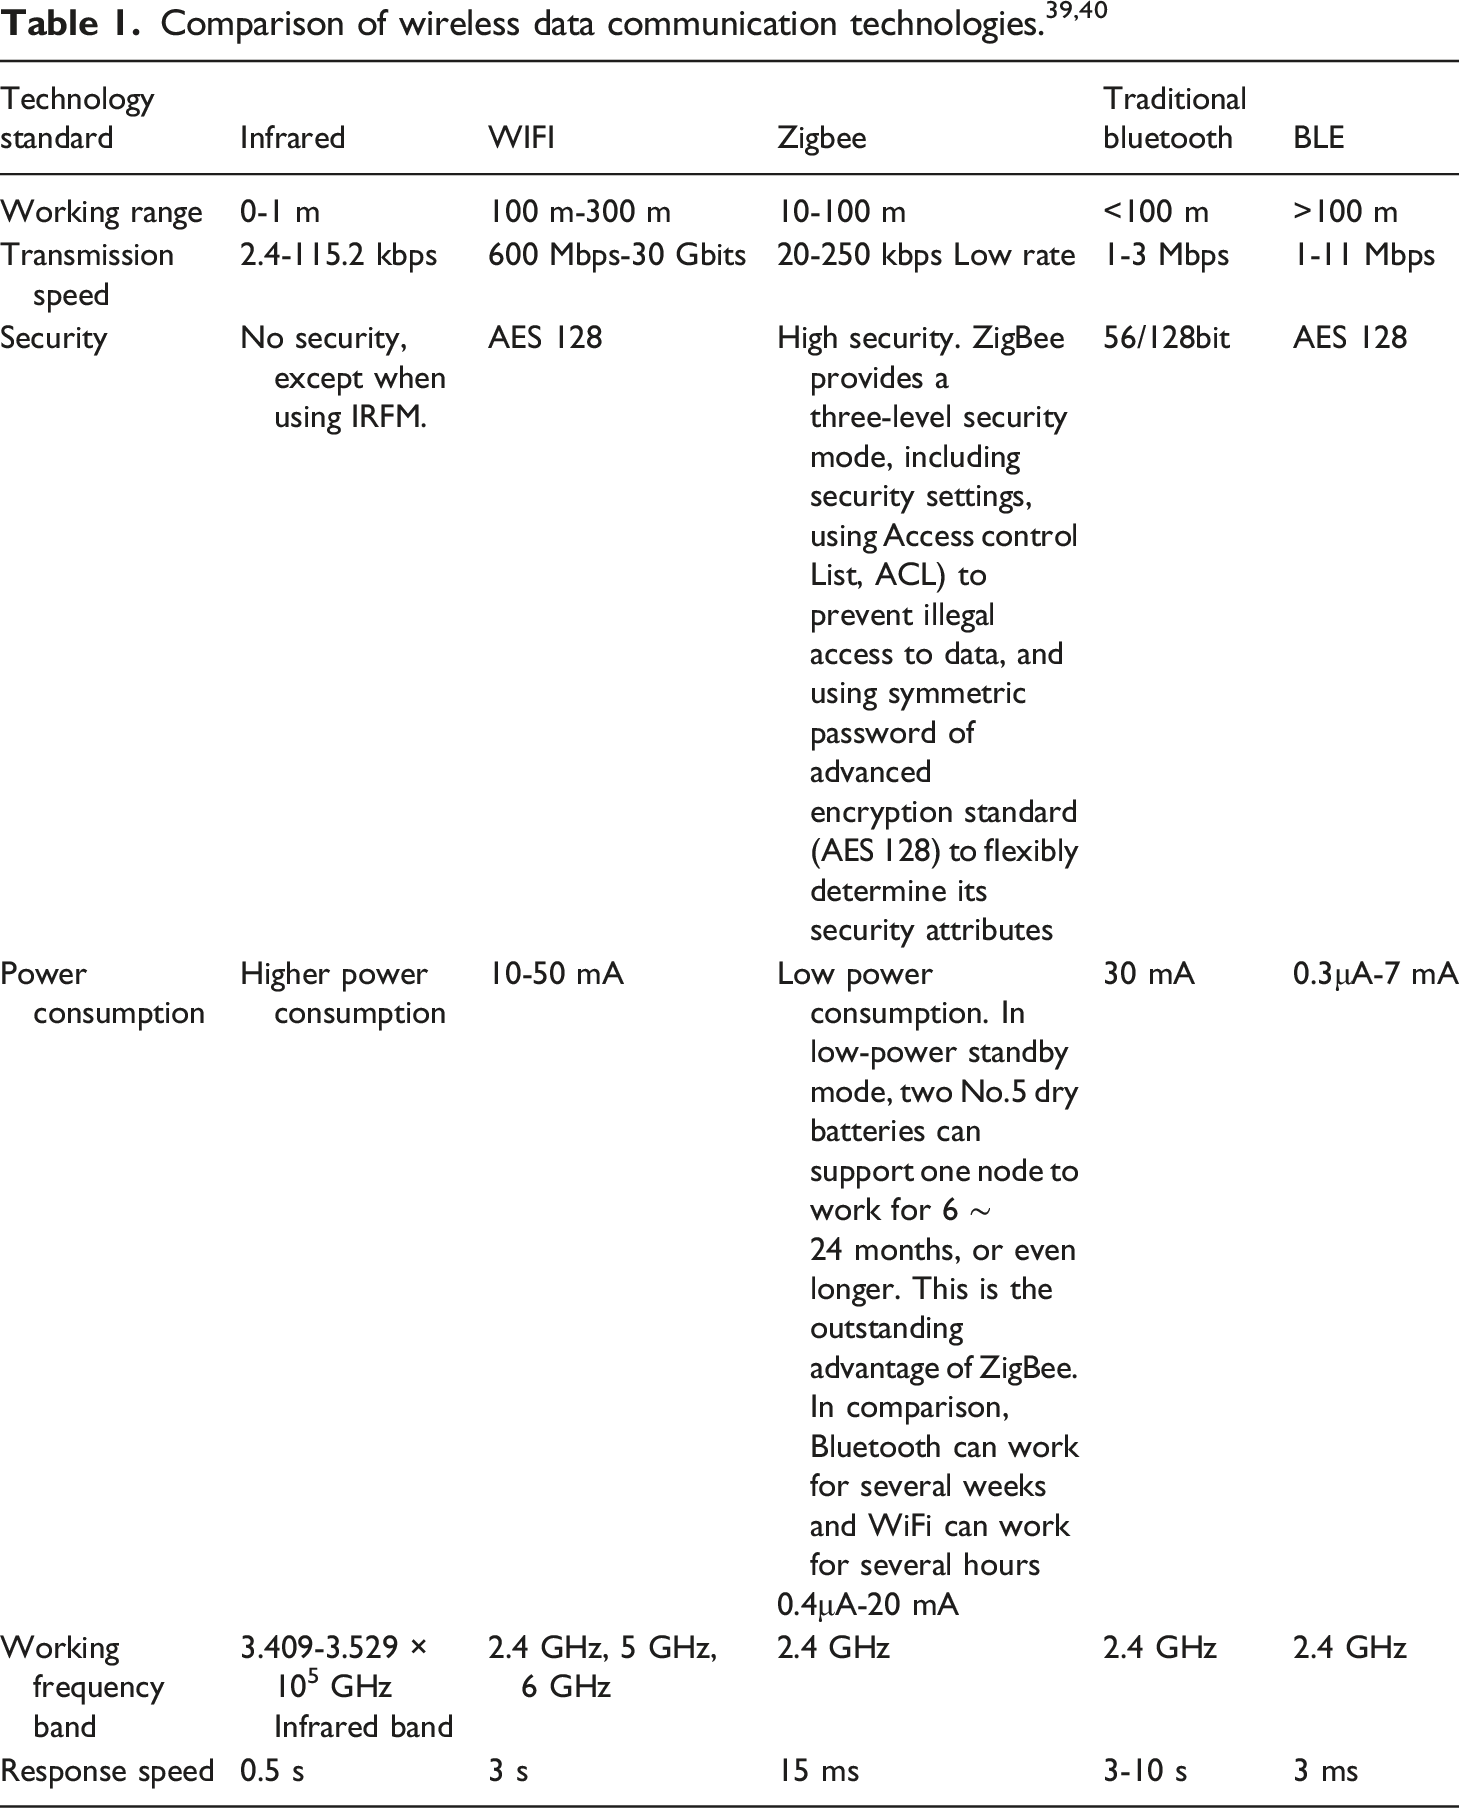
Technology standard
Infrared
WIFI
Zigbee
Traditional bluetooth
BLE
Working range
0-1 m
100 m-300 m
10-100 m
<100 m
>100 m
Transmission speed
2.4-115.2 kbps
600 Mbps-30 Gbits
20-250 kbps Low rate
1-3 Mbps
1-11 Mbps
Security
No security, except when using IRFM.
AES 128
High security. ZigBee provides a three-level security mode, including security settings, using Access control List, ACL) to prevent illegal access to data, and using symmetric password of advanced encryption standard (AES 128) to flexibly determine its security attributes
56/128bit
AES 128
Power consumption
Higher power consumption
10-50 mA
Low power consumption. In low-power standby mode, two No.5 dry batteries can support one node to work for 6 ∼ 24 months, or even longer. This is the outstanding advantage of ZigBee. In comparison, Bluetooth can work for several weeks and WiFi can work for several hours
30 mA
0.3μA-7 mA
0.4μA-20 mA
Working frequency band
3.409-3.529 × 10⁵ GHz Infrared band
2.4 GHz, 5 GHz, 6 GHz
2.4 GHz
2.4 GHz
2.4 GHz
Response speed
0.5 s
3 s
15 ms
3-10 s
3 ms
Independent sample t test results.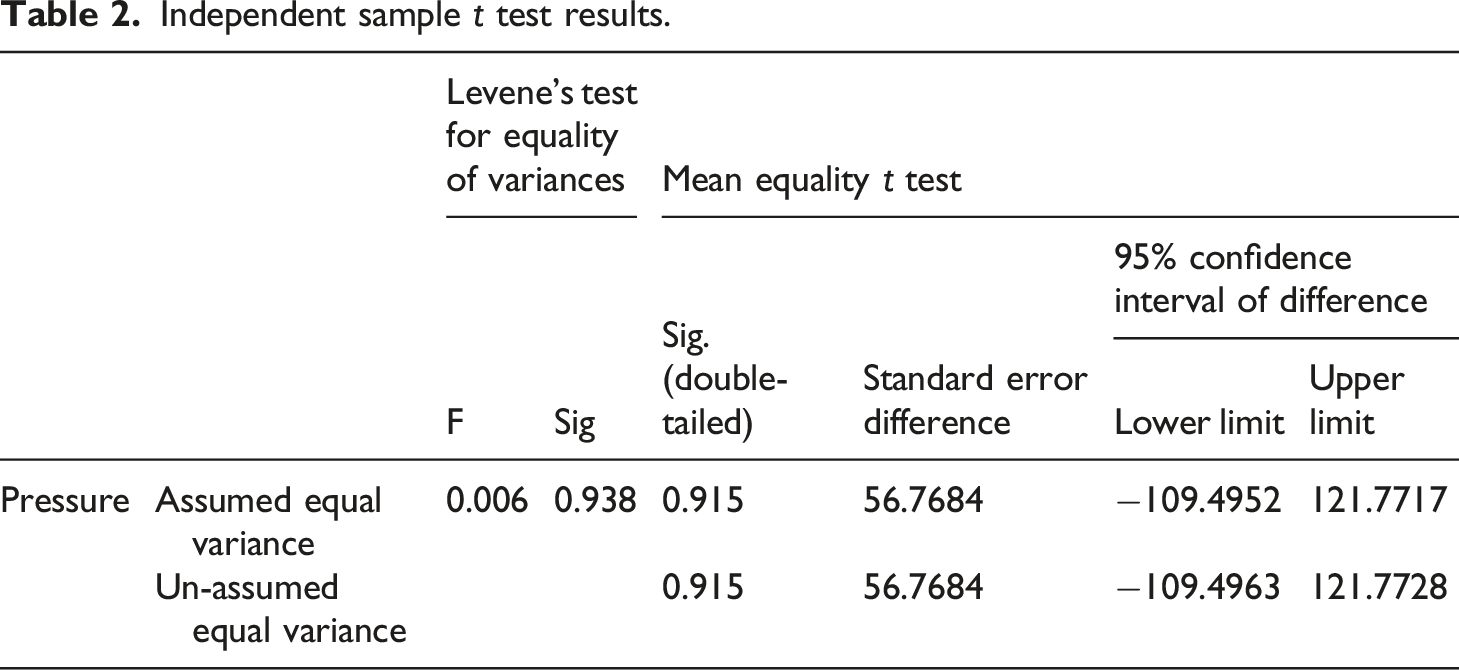
Levene’s test for equality of variances
Mean equality t test
F
Sig
Sig. (double-tailed)
Standard error difference
95% confidence interval of difference
Lower limit
Upper limit
Pressure
Assumed equal variance
0.006
0.938
0.915
56.7684
−109.4952
121.7717
Un-assumed equal variance
0.915
56.7684
−109.4963
121.7728
Changes of temperature and humidity in climate room.
Time
0 min
5 min
10 min
15 min
20 min
25 min
Real Temperature/°C
26
27
28
31
34
36
Real humidity/%
20
30
40
45
50
80
Independent sample inspection of temperature.
Levene’s test for equality of variances
Mean equality t test
F
Sig
Sig. (double-tailed)
Standard error difference
95% confidence interval of difference
Lower limit
Upper limit
Temperature
Assumed equal variance
0
0.986
0.972
2.3109
−5.2322
5.0656
Un-assumed equal variance
0.972
2.3109
−5.2324
5.0657
Independent sample inspection of humidity.
Levene’s test for equality of variances
Mean equality t test
F
Sig
Sig. (double-tailed)
Standard error difference
95% confidence interval of difference
Lower limit
Upper limit
Humidity
Assumed equal variance
0.013
0.911
0.892
11.8514
−24.7565
28.0565
Un-assumed equal variance
0.892
11.8514
−24.7567
28.0567
Comparison of results of two pressure measuring devices.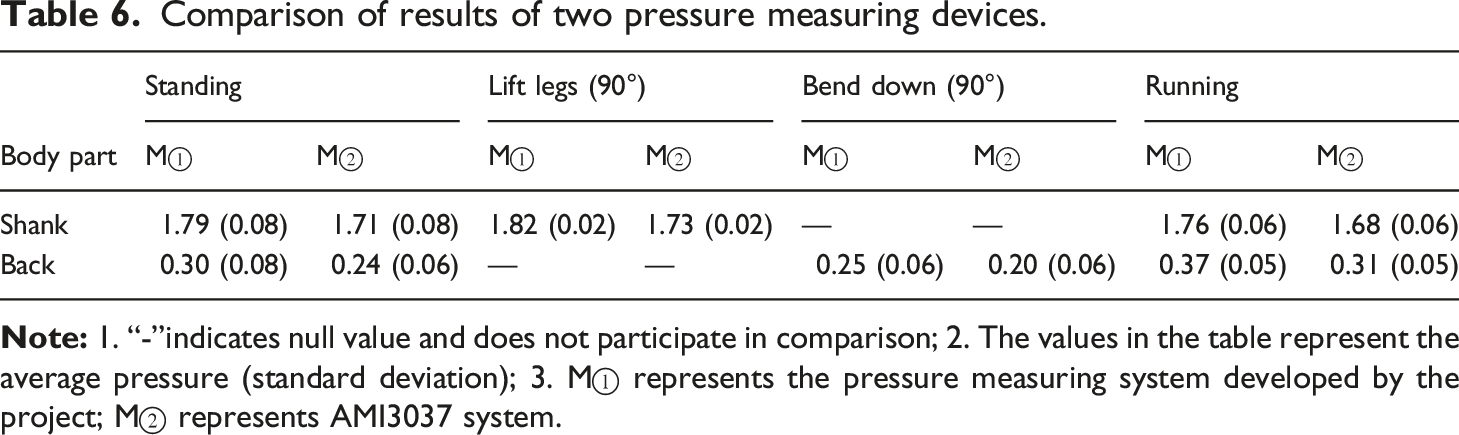
Body part
Standing
Lift legs (90°)
Bend down (90°)
Running
M①
M②
M①
M②
M①
M②
M①
M②
Shank
1.79 (0.08)
1.71 (0.08)
1.82 (0.02)
1.73 (0.02)
---
---
1.76 (0.06)
1.68 (0.06)
Back
0.30 (0.08)
0.24 (0.06)
---
---
0.25 (0.06)
0.20 (0.06)
0.37 (0.05)
0.31 (0.05)
Comparison of test results of two kinds of pressure measuring devices.
Part posture
(I)Pressure measuring system
(J)Pressure measuring system
Average difference
Standard deviation
95% confidence interval
Sig. (double-tailed)
Lower limit
Upper limit
Standing-shank
M①
M②
0.0802
0.01903
0.04207
0.11793
0.546
Lift legs (90°)-Shank
M①
M②
0.09053
0.0032
0.09949
0.10156
0.352
Running-shank
M①
M②
0.08614
0.0176
0.08044
0.09185
0.418
Standing-back
M①
M②
0.06331
0.03253
0.05277
0.07386
0.667
Bend down (90°)-Back
M①
M②
0.0511
0.01448
0.02115
0.07885
0.713
Running-back
M①
M②
0.05922
0.00833
0.05652
0.06192
0.692
Comparison of test results of two kinds of temperature and humidity measuring devices.
Test item
Measuring part
(I) Measuring system
(J)Measuring system
Average difference
Standard deviation
95% confidence interval
Lower limit
Upper limit
Temperature
Shank
M①
M(DS)
−.1108
.1140
−.2016
.0816
Back
M①
M(DS)
.5618
.3226
.1613
.9623
Humidity
Shank
M①
M(DS)
2.2747
2.2208
−.4828
5.0323
Back
M①
M(DS)
−2.6742
1.4931
−4.5282
−.8203
Comparison of pressure measurement results between the improved device and the device before improvement.
Body part
Standing
Lift legs (90°)
Bend down (90°)
Running
M①’
M②
M①
M①’
M②
M①
M①’
M②
M①
M①’
M②
M①
Shank
1.79 (0.08)
1.70 (0.08)
1.76 (0.08)
1.81 (0.02)
1.73 (0.02)
1.78 (0.02)
---
---
---
1.76 (0.06)
1.68 (0.06)
1.73 (0.06)
Back
0.29 (0.08)
0.24 (0.06)
0.26 (0.08)
---
---
---
0.24 (0.06)
0.19 (0.06)
0.22 (0.06)
0.37 (0.05)
0.30 (0.05)
0.34 (0.05)