
Abstract
The purpose of this study is to explore the dynamic change mechanism of clothing comfort perception during exercise, and deeply analyze the evolution characteristics of comfort perception of various body parts in different stages of exercise (warm-up, during exercise and relax after exercise). Through the test of 25 kinds of tight-fitting sportswear combinations. It is found that the influence of different clothing combinations on comfort perception presents regional differences, and the comfort change of the upper body is mainly reflected in the wet feeling and the hot feeling, while the lower body shows obvious sense of restraint; the wearing comfort of T2P1, T2P4, T3P5 and T4P3 are better than other combinations; with the extension of exercise time, the correlation of comfort of each part is gradually enhanced; the back, waist, chest and other body parts experience varying degrees of discomfort at rest, after exercise and during exercise; during exercise, the sense of restraint and stickiness of waist, hip, thigh and shank is particularly obvious. The research results fill the lack of research on the dynamic change of sportswear comfort, provide valuable design insights and promote the innovation of sportswear industry in terms of functionality and comfort. Through the in-depth analysis of the comfort change mechanism, this study provides theoretical support for the future development of sports medicine, sports psychology and smart sportswear, and helps the development of healthy sports and smart sportswear.
Introduction
The mechanism underlying the alteration of clothing comfort perception during sports activities is a multifaceted subject encompassing numerous disciplines. Its dynamics can be elucidated through the lenses of both physiology and psychology. From a physiological standpoint, the human body generates substantial heat and perspiration during exercise, which necessitates the expulsion of these substances through specific bodily processes. Fabrics with superior air permeability and hygroscopicity play a pivotal role in sports, significantly influencing athletes’ physical comfort. During periods of intense physical exertion, there is an increase in the metabolic rate of the body, as well as an increase in sweat and heat production. This necessitates the use of clothing that is capable of effectively wicking away sweat and dissipating heat. Conversely, in low-intensity workouts, while heat production diminishes, the evaporation and regulation of sweat remain crucial for maintaining comfort. 1 The thermal and moisture management properties of various fabrics profoundly impact sports comfort. For instance, while synthetic fibres offer exceptional elasticity and durability, inadequate hygroscopicity can result in feelings of stiffness or dampness. The existing literature has explored fabric structure and performance optimisation to enhance thermal and moisture comfort during sports.2–4
From a psychological standpoint, wearers’ subjective perceptions significantly influence their evaluation of clothing comfort. During periods of physical exertion, fluctuations in the psychological state are closely associated with physiological sensations.5,6 In high-intensity scenarios, athletes’ intense focus on the activity consumes mental resources, reducing their awareness of external stimuli. This psychological shift has been shown to diminish their sensitivity to clothing discomfort, allowing them to overlook or tolerate minor irritations or constraints. Conversely, during low-intensity exercise or rest, athletes’ perceptual acuity is known to sharpen, rendering them more sensitive to subtle clothing discomfort. This phenomenon has been shown to correlate with changes in attention allocation and perception thresholds. The alignment of clothing with psychological expectations, particularly in terms of texture and tactile sensation, has been demonstrated to enhance athletes' overall comfort. 7 For instance, soft textures and relaxed fits may be more conducive to comfort during rest or pre-exercise, whereas moderate compression during high-intensity exercise can enhance performance and alleviate muscle fatigue.
The study of clothing comfort in sports is a vital area within clothing ergonomics. It intersects with many other disciplines, such as physiology, biomechanics, and psychology. It also connects with materials science. The complexity and diversity of this field stem from the dynamic nature of clothing comfort perception and the multifaceted mechanisms underlying it. Research in this area has thus far focused on evaluations of physical properties or physiological responses,8–11 such as air permeability, hygroscopicity, elasticity, heart rate, body temperature regulation, and sweat secretion. However, the psychological feelings of the athletes have been identified as a crucial consideration.
In recent years, the research on the comfort of sportswear has made remarkable progress, especially in the research field of comfort evaluation under static conditions and its relationship with the performance of clothing materials.12–14 However, these studies mostly focus on the static state, and fail to pay full attention to the dynamic change law of human body’s perception of clothing comfort during exercise and after exercise. Although some studies have revealed the key factors and patterns that affect the comfort of sportswear through laboratory tests, field surveys and questionnaires, the dynamic mechanism of comfort changes under different exercise conditions is still not completely clear. In order to make up for the above research gaps, this study aims to explore the changing characteristics and internal mechanism of clothing comfort perception at various stages of exercise, and through the dynamic analysis of comfort perception at different body parts, comprehensively reveals the perception dynamics that traditional static research can not cover. This paper puts forward a new model suitable for fashion design under sports conditions, which deepens the understanding of the dynamic change of comfort perception in theory and explains its potential mechanism. These achievements not only have important theoretical value, but also provide a solid foundation for further exploration of comfort research, and also provide clear guidance for the design and production of sportswear. The research results will promote the continuous optimization of functional and comfortable clothing and help athletes to improve their wearing experience and sports performance in an all-round way.
Methods
Participants

Experimental garments
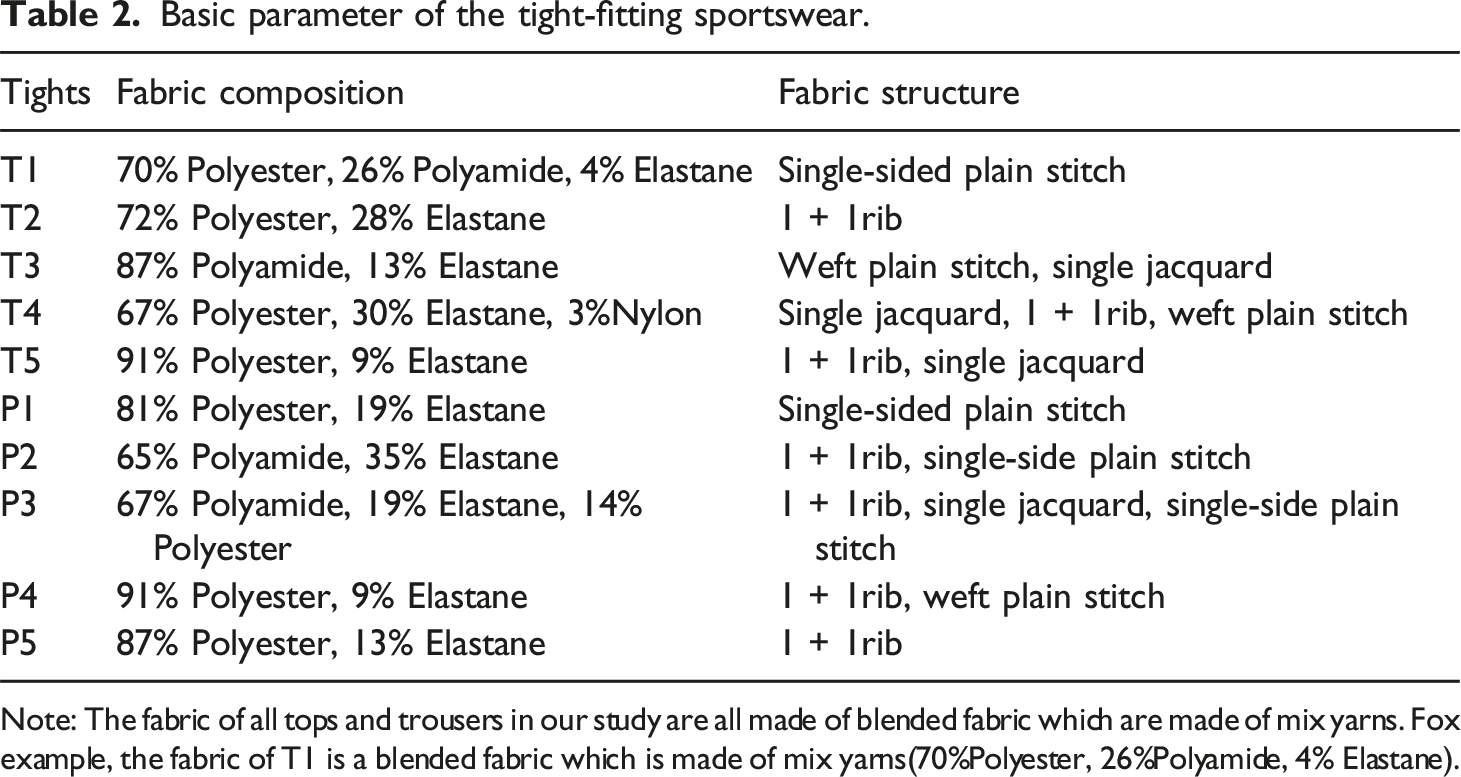
According to the body size of 10 subjects, 5 tight-fitting tops (T1, T2, T3, …, T5) with long-sleeve and 5 tight-fitting trousers (P1, P2, P3, …, P5) were purchased, which are suitable for running, playing football, fitness, and other sports, the sportswear style is shown in Figure 1. The size of tops is respectively as follows: bust girth is 76.8 cm, sleeve length is 71 cm, length is 67 cm; The size of trousers is respectively as follows: waist girth is 69.8 cm, hip girth is 76.2 cm, outseam length is 92.8 cm. About the basic parameter of these tight-fitting sportswear, as shown in Table 2. Tight-fitting top and trousers. Basic parameter of the tight-fitting sportswear. Note: The fabric of all tops and trousers in our study are all made of blended fabric which are made of mix yarns. Fox example, the fabric of T1 is a blended fabric which is made of mix yarns(70%Polyester, 26%Polyamide, 4% Elastane).
Comfort evaluation scale
Evaluation of comfort perception and overall comfort.

Therefore, when the subjects do some actions or run in the experimental tight-fitting sportswear, we collected the data of the key body parts’ humidity sense, thermal sense, sticky body sense, restraint sense, itching sense, rough sense, soft sense.
Sports scheme design
(1) In order to obtain more data, the tops and trousers were freely combined, and each subject wore 25 different combinations of clothes, and 10 subjects wore all combinations of long-sleeved tops and trousers in turn, and scored all kinds of senses respectively.
(2) The experiment was carried out in the climate room, with an temperature 20 ± 2°C, a relative humidity 60 ± 5%, and an average wind speed 1 m/s.
(3) On the day of the experiment, all the subjects must keep a good mood and emotion. All subjects must maintain a normal diet and avoid overeating or drinking stimulating beverages.
(4) Before every test, in order to ensure that the subjects adapt to the experimental environment, they must enter the climate chamber 20 minutes in advance, meanwhile, the questionnaire was again explained to all subjects uniformly to ensure that all subjects have the same understanding of the content and scale of the questionnaire.
(5) The combination tight-fitting sportswear used in the experiment on that day should be placed in the climate room for at least 24 hours.
(6) The participants wore experimental tight-fitting sportswear and ran on the treadmill. The subjects were asked about the comfort of each body part every 10 minutes and the participants evaluated comfort perceptions according to Table 3.
(7) Wear trials were carried out according to Figure 2, the experimental process includes warm-up stage (10 minutes), running at the average speed of 6 km/h for 50 minutes stage, relax stage (10 minutes). Experimental process.
Formularization
During wear trials, several subjective measurements have been carried out. The human comfort evaluation data got by wear trials were both formed into a data matrix. The specific process is as follows.
Let
Let
Let
Let
Let
Let
Let
Let
Let
Results and discussion
Human comfort distribution characteristics of different combinations of tight-fitting sportswear
According to the comfort data, there are notable differences in local comfort (perception of key body parts) and overall comfort among various combinations of tight-fitting sportswear. By comparing the comfort levels of different combinations, as shown in Figure 3, it is evident that although the pressure exerted by these garments remains consistent across combinations, variations in temperature and humidity lead to significant changes in comfort perception. This is particularly pronounced with respect to humidity feeling, sticky body feeling and stuffy feeling. Even when the combinations of tight-fitting sportswear are identical, distinct differences in comfort perception can still be observed for the same type of tight top. Comfort of different combinations of tight-fitting sportswear in motion. Note: sf - stuffy feeling; sbf - sticky body feeling; hf - humidity feeling; if - itching feeling; rf - restraint feeling; rof - rough feeling; sof - soft feeling; oc - overall comfort.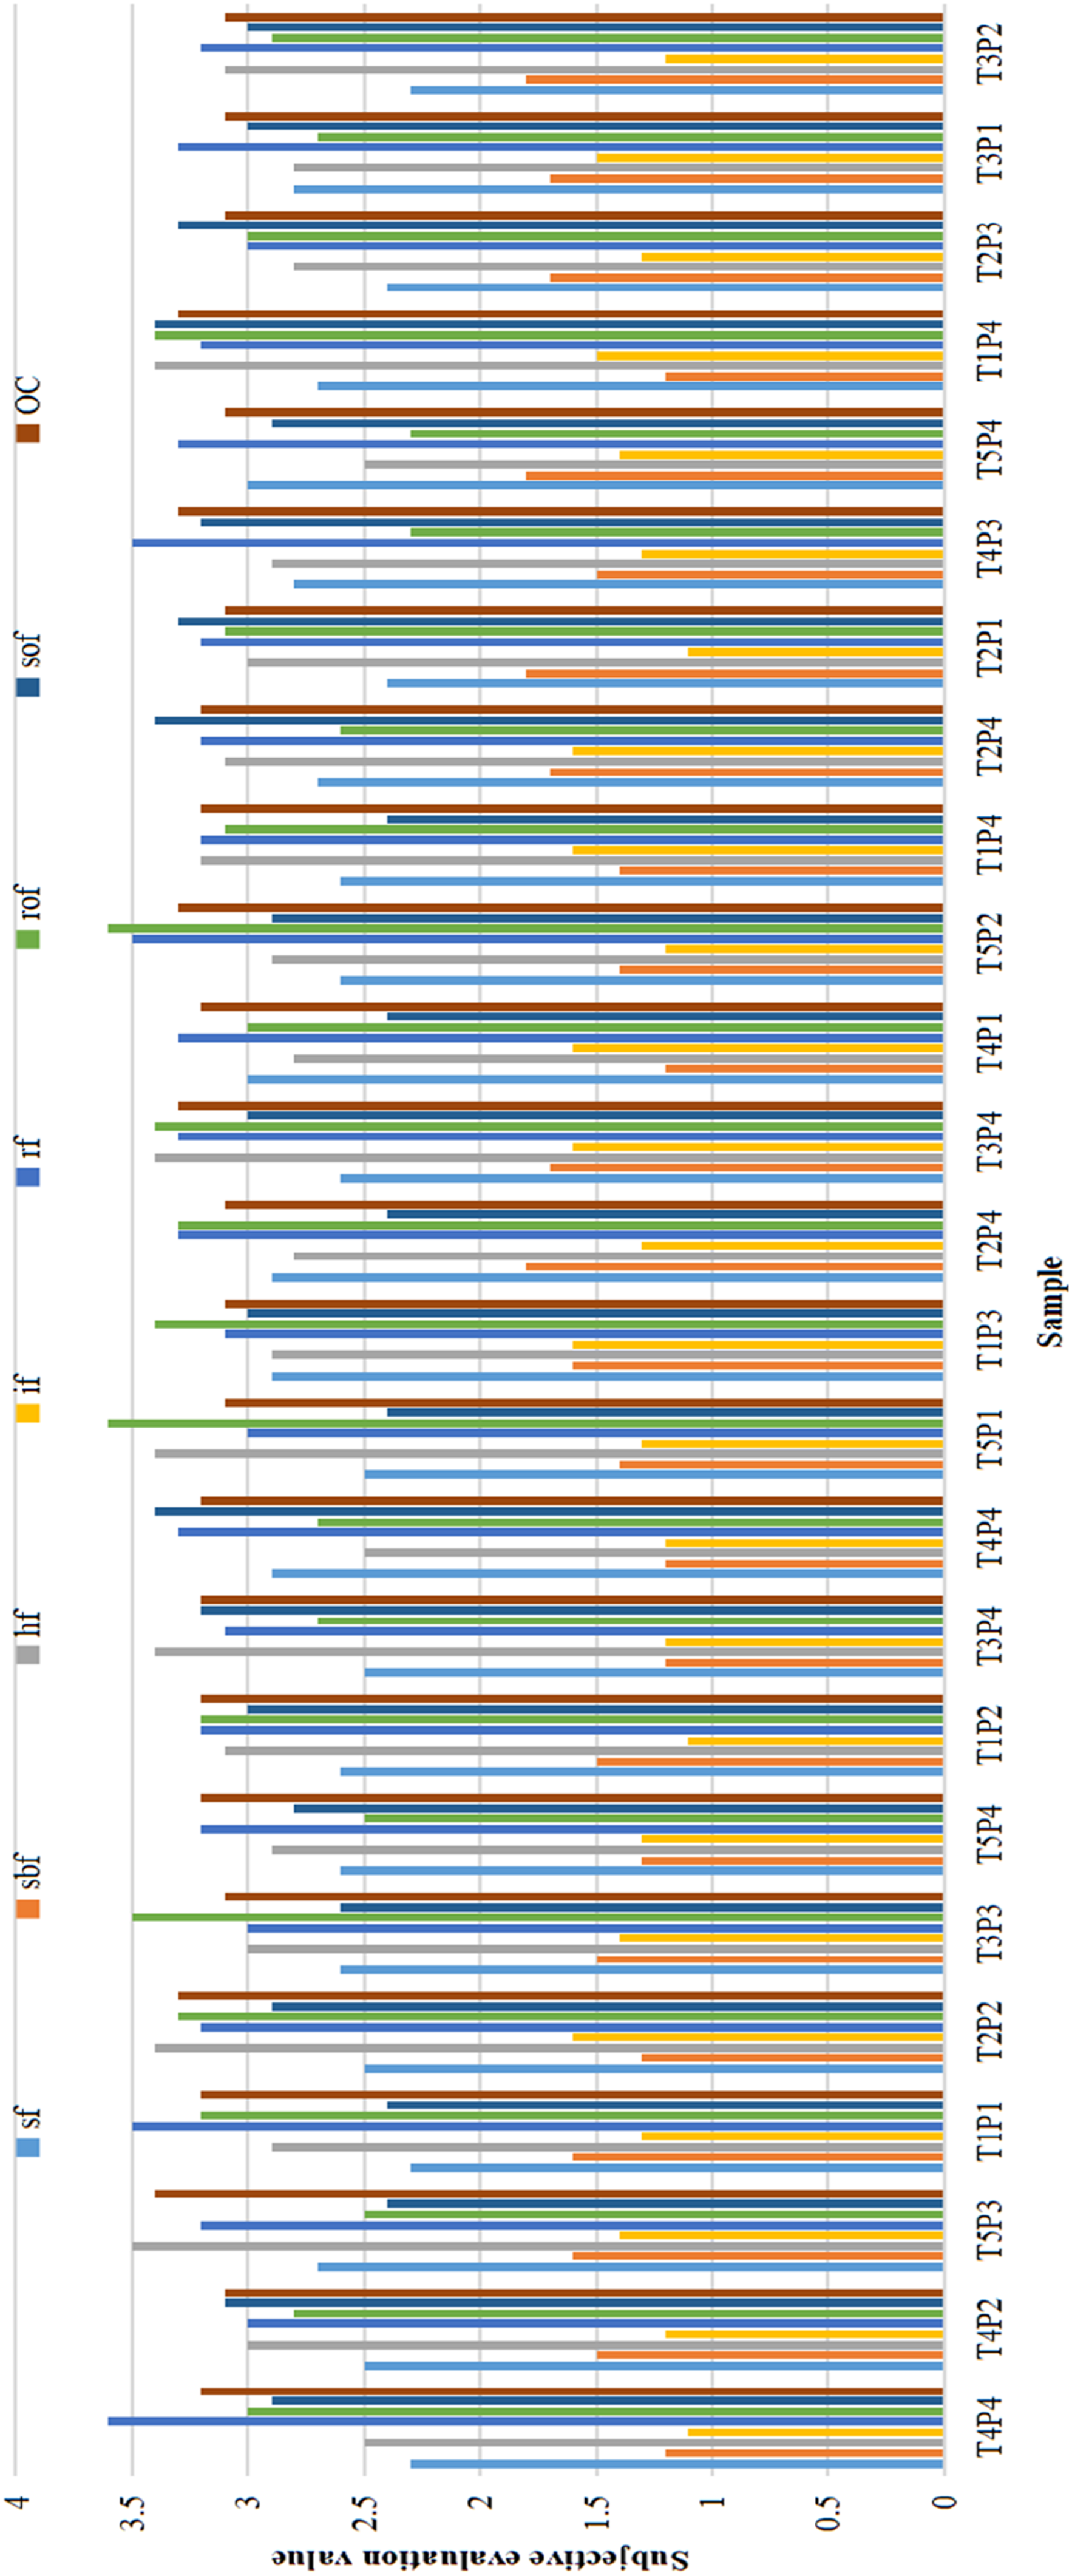
Through T-tested results, it can be known that wearing different combinations of clothing has different human comfort sense changes in different parts and has different effects on the comfort perception in the same parts. Taking T3P4, T5P3 and T5P4 as an example, there are some differences in humidity between T5P3 and T5P4. T3P4 and T5P4 also have certain differences in humidity feeling and rough feeling, so even if they are the same tops or the same combination of pants, there are certain differences in humidity feeling and stuffy feeling, which in turn leads to certain differences in rough feeling and soft feeling. Therefore, the same tight top or the same tight pants does not mean that they have the same rough feeling and soft feeling of the upper body or lower body. The combination of the same tights or the same tights affects not only the thermal and humidity feeling, but also the comfort such as roughness and softness. Because the overall comfort is composed of local comfort, the overall difference also means that there are differences in local comfort. Moreover, although the tops are the same and the pressure on the upper body is the same or similar, but due to the different tight-fitting sportswear on the lower body, the sense of restraint is different, because the lower body may be subjected to different pressures when wearing different tight-fitting sportswear.
Before and during the initial stages of exercise (the first three steps), participants reported minimal differences in their perception of restraint, itching, roughness, and stuffiness when wearing the same tight-fitting tops or trousers. This indicates that, at the beginning of movement, the body adapts relatively uniformly to the constraints imposed by tight clothing. However, as exercise time increased, significant differences emerged, particularly in perceptions of stuffy feeling, humidity feeling, and sticky body feeling. These changes likely correspond to physiological factors such as increased sweating and heat dissipation needs, which amplify the sensory interaction between the fabric and the skin.
Through further analysis, it was observed that comfort in the upper and lower body exhibits a mutual influence. For instance, local sensations—such as restraint, soft, rough or itching—felt on one part of the body can modify the perceived overall comfort level. These combinations may alter the mechanical pressure distribution, air circulation, and thermal exchange across different body regions, leading to distinct sensory experiences.
The gradual increase in discomfort, particularly in terms of stickiness and humidity, suggests that the body’s thermoregulatory responses, such as sweating and evaporative cooling, are influenced by the dynamic interaction of fabric properties and motion. Moreover, these findings highlight that while participants may initially perceive their clothing as relatively neutral in comfort, prolonged physical activity exacerbates localized sensations, which in turn affect the overall evaluation of comfort. This dynamic shift underscores the importance of understanding how motion-specific changes influence human perception over time.
Cluster analysis and distribution of comfort perception evaluation
Cluster analysis of the comfort perception of tight-fitting sportswear
As the comfort data of combined tight-fitting sportswear is multi-dimensional, it is essential to analyze the comfort differences among various types of tight-fitting sportswear by considering the key comfort factors at each stage. In this study, we utilize the key comfort perceptions at each phase as clustering indicators. Subsequently, based on these clustering indicators, we employ the K-means clustering algorithm to categorize all combined tights into distinct groups. Finally, we analyze the differences in human comfort perception associated with different garments. The process is as follows.
First, obtain the value of stuffy feeling, sticky body feeling, humidity feeling, restraint feeling, rough feeling, soft feeling, overall comfort of each combination of tight-fitting top and trousers during running.
Second, select stronger human comfort perception during running.
Third, calculate the average value of selected comfort perception, overall comfort of each combination of tight-fitting top and trousers during running.
Fourth, adopt K-means to cluster 25 combinations of tight-fitting top and trousers, and take the data from Step 3 as the clustering index of K-means.
Fifth, after the clustering is completed, calculate the average value of stuffy feeling, sticky body feeling, humidity feeling, restraint feeling, rough feeling, soft feeling, overall comfort of each cluster group(or category), and rank each category according to the average value of each comfort perception.
According to the key local perception of each movement stage, select the perception evaluation of the corresponding parts, and construct a clustering index matrix, as shown in Formula (1).
Let
Let step 1 be warm-up stage.
Let step 2-1 be 1st 10min running.
Let step 2-2 be 2nd 10min running.
Let step 2-3 be 3rd 10min running.
Let step 2-4 be 4th 10min running.
Let step 2-5 be 5th 10min running.
Let step 3 be relax after running.
Let
Let
Let
Let
Let
Let
Let
Let
Let
Let
Let
Let 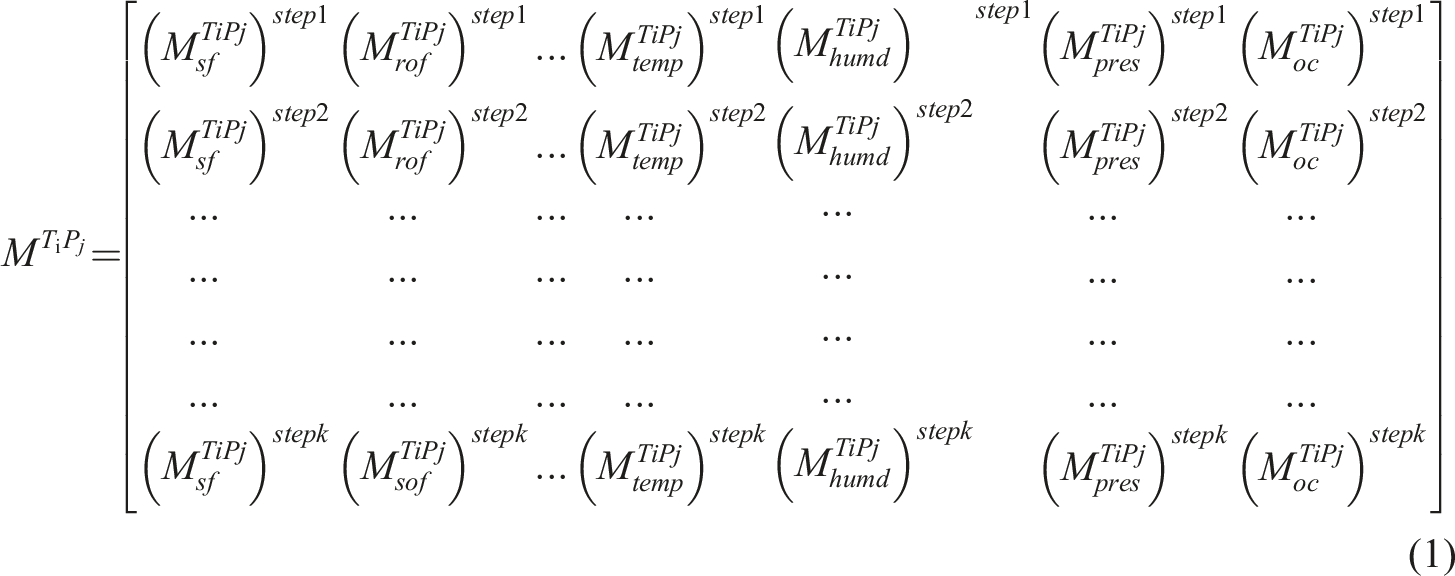
The cluster of tight-fitting sportswear combination.

Differences in comfort perception among combinations of tight-fitting sportswear
Comprehensive analysis of the advantages and disadvantages of various categories that affect comfort in sports attire is conducted to identify the most suitable group for this speed. The groups are then sorted, along with the distribution of comfort levels associated with tight-fitting sportswear combinations. Furthermore, to enhance our understanding of the differences in comfort perception among various combinations of tights, a ranking is established based on the comfort levels within each category identified in the clustering results. The specific implementation method is to average the human comfort evaluation values of different tight sportswear in the same category(i.g., in Category II, the restraint feeling are respectively 3.5, 3.6, when subjects wear T1P1, T4P4, therefore, the average restraint feeling is 3.55; in Category IV, the restraint feeling are respectively 3.2, 3.3, 3.2 3.1, 3.2, when subjects wear T4P1, T4P5, T5P1, T5P2, T5P5, therefore, the average restraint feeling is 3.2), and then, according to the average of human comfort evaluation values, the order is from big to small. As follows:
Restraint feeling: Category II: T1P1, T4P4 (the restraint feeling is stronger than other categories), Category IV: T4P1, T4P5, T5P1, T5P2, T5P5 (the second restraint feeling), and Category III: T1P2, T1P3, T1P4, T2P1, T2P2, T2P4, T3P1, T3P4.
Stuffy feeling: Category I: T1P5, T2P3, T2P5, T3P2, T3P3, T4P2, T5P3, T5P4 (sultry feeling is lukewarm), Category IV: T4P1, T4P5, T5P1, T5P2, T5P5, and Category III: T1P2, T1P5.
Sticky body feeling: Category II: T1P1, T4P4 (viscosity is stronger than Category III, IV and I), Category III: T1P2, T1P3, T1P4, T2P1, T2P2, T2P4, T3P1, T3P4, T3P5, T4P3, and Category IV: T4P1, T4P5, T4P3.
Humidity feeling: Category I: T1P5, T2P3, T2P5, T3P2, T3P3, T4P2, T5P3, T5P4 (more humidity than Category III, II and IV), and Category III: T1P2, T1P3, T1P4, T2P1, T2P2, T2P4.
Rough feeling: the fourth category: T4P1, T4P5, T5P1, T5P2, T5P5 (generally smooth), the first category: T1P5, T2P3, T2P5, T3P2, T5P3, T5P4, the second category: T1P1, T4P4, the first category.
Soft feeling: Category I: T1P5, T2P3, T2P5, T3P2, T3P3, T4P2, T5P3, T5P4 (generally soft, slightly weaker than Category II, III and IV), Category II: T1P1, T4P4, and Category III: T1P2, T1P3, T5P4.
Overall comfort: Category I: T1P5, T2P3, T2P5, T3P2, T3P3, T4P2, T5P3, T5P4 (generally comfortable, less comfortable than Category II, IV, III), Category II: T1P1, T4P4, and Category IV: T4P1, T4P5, T5P4.
Therefore, the overall comfort of T1P2, T1P3, T1P4, T2P1, T2P2, T2P4, T3P1, T3P4, T3P5, T4P3 is better than that of other tights. The tights with strong sense of restraint are T1P1 and T4P4; T1P1 and T4P4 have strong sense of sticky body feeling.
With the diverse combinations of tight-fitting tops and tight-fitting pants, the uncomfortable parts (or areas) have undergone significant changes. It is notable that the influence exerted by heat and humidity on the overall comfort of tight-fitting tops is more pronounced than that of tight-fitting trousers. The combination of tight-fitting sportswear fabricated from different materials will yield distinct levels of comfort, as well as variations in temperature, humidity, and pressure. Therefore, when undertaking the design of these tights, it is imperative to make the most optimal combination of fabrics in accordance with the specific sports category. This meticulous approach is essential to guarantee the maximum level of wearing comfort and subsequently assist in enhancing the wearer’s sports performance to the fullest extent possible.
In order to facilitate a more profound analysis of the alterations in the wearing comfort of tight-fitting sportswear and the factors that influence this comfort, this section primarily examines the disparities between these tights from the perspectives of temperature, humidity, pressure and comfort. Additionally, it undertakes a comprehensive analysis of the dynamic change law of their (uncomfortable) comfort through the utilisation of a clustering method. Furthermore, it assesses the superior performance of various combinations of tights and determines that T2P1, T2P4, T3P5 and T4P3 exhibit superior performance in comparison to other combinations. Concurrently, it has been determined that the level of comfort experienced when wearing these tights is subject to variation in accordance with the exercise time. Furthermore, the factors influencing this comfort experience are also subject to alteration.
Comfort changes of tight-fitting sportswear at different exercise times
Dynamic changes of comfort perception
It is evident that the factors influencing comfort perception vary between exercise periods. This indicates that the determinants of clothing comfort during exercise are in a state of flux. The factors determining clothing comfort are inherently dynamic, and their relative importance undergoes fluctuations during exercise. Furthermore, the comfort perception that affects the overall experience is also subject to change. Furthermore, sports comfort itself is a time series,23–25 necessitating the analysis of dynamic changes in comfort over time.
This section undertakes an analysis of comfort in different stages of exercise, with the objective of demonstrating the change of human comfort sense and instrumental measurement data of comfort in short-term and long-term exercise (replacing long-term and short-term with different stages of exercise), and constructing the comfort distribution based on short-term and long-term exercise. The visualisation of the comfort distribution is achieved by determining the most representative average comfort value (i.e. local comfort) of key parts in each movement stage.
See Figures 4 and 5 for the comfort distribution of key parts and parts in each movement stage. Local comfort feeling distribution in different stages of motion. Local comfort distribution in different stages of motion.

As can be seen from Figure 4, the distribution of local comfort in different steps of exercise is as follows: Step1: the rough feeling of the back; the stuffy feeling of the waist; the stuffy feeling of the chest; the rough feeling of abdomen; the rough feeling of hip; the stuffy feeling of the shank; rough feeling of thigh. Step2-1: the restraint feeling of the back; the stuffy feeling of the waist; rough feeling of the chest; the stuffy feeling of the abdomen; rough feeling of hip; the restraint feeling of the shank; the restraint feeling of the thigh. Step2-2: humidity feeling of the back; the restraint feeling of the waist; the restraint feeling of the chest; the restraint feeling of the abdomen; the restraint feeling of the hip; the restraint feeling of the shank; the restraint feeling of the thigh. Step2-3: humidity feeling of the back; the restraint feeling of the waist; the humidity feeling of the chest; the restraint feeling of the abdomen; the restraint feeling of the hip; the restraint feeling of the shank; the restraint feeling of the thigh. Step2-4: humidity feeling of the back; humidity feeling of the waist; humidity feeling of the chest; humidity feeling of the abdomen; the restraint feeling of the hip; the restraint feeling of the shank; the restraint feeling of the thigh. Step2-5: sticky body feeling of the back; sticky body feeling of the waist; sticky body feeling of the chest; humidity feeling of the abdomen; humidity feeling of the hip; the restraint feeling of the shank; sticky body feeling of thigh. Step3: humidity feeling of the back; sticky body feeling of the waist; humidity feeling of the chest; sticky body feeling of abdomen; sticky body feeling of hip; sticky body feeling of the shank; sticky body feeling of the thigh.
As can be seen from Figures 4 and 5, the humidity feeling of the back begin to be obvious at the stage of Step2-2 (12th-17th min), and it is always the main perception of the back from Step2-2 to Step2-4, and the back feels moist at the stage of Step2-4 (31th min-35th min). With the continuation of exercise, the sticky sensation of the back gradually increases. At the stage of Step2-5 (45th-47th min), the sticky sensation is 4.7, which is almost very sticky, and the discomfort of the back is very uncomfortable (4.5).
The main comfort perception of the waist changes more complicated, from stuffy feeling to restraint feeling, to humidity feeling and finally to sticky body feeling. Waist is one of the important parts of fashion design, 26 and the comfort of this part is particularly critical.27–29 The comfort of the waist is better in the whole exercise process, and it is slightly uncomfortable (3.5) only in the Step2-5, which may be caused by the sticky body feeling (2.9, sticky body feeling is general sticky body).
During the whole movement stage of the shank (Step2-1 to Step2-5), the main comfort has always been the sense of restraint. The main comfort of thigh during the movement stage from Step2-1 to Step2-4 is restraint, and the main comfort during the movement stage from Step2-5 is sticky body sensation, which shows that after a period of movement at this speed, the obvious increase of temperature and humidity at thigh can easily lead to sticky body sensation.
The feeling of humidity in the chest is obvious in the exercise stage of Step2-3 (22-25min), and at the 33rd-36th min, the feeling of humidity (4.5) is close to a very humid state, at which the comfortable state of the chest is relatively uncomfortable (4.0), the humidity feeling of the abdomen is (3.5), and the comfortable state of the abdomen is slightly uncomfortable (3.5). In addition, comparing the comfort and local comfort, it is found that although the back wetness (4.6) and the chest wetness (4.5) are relatively large in the exercise stage of Step2-4, the back comfort value (4.0) and the chest comfort value (4.0) are relatively uncomfortable, and the chest, abdomen and back are sensitive to stimulation or perception, so it can be concluded that the same perception in different parts is comfortable for the whole.
Comprehensive analysis reveals distinct differences in how various perceptions impact overall comfort. Specifically, humidity’s influence on overall comfort is lesser than that of a sticky body sensation. Different body parts exhibit varying sensitivities to distinct sensations or stimuli.
Chest comfort undergoes significant shifts, transitioning from a stuffy sensation at rest, a rough feeling during the Step1 movement stage, to a restrained sensation at the Step2-1 movement stage, ultimately maintaining a humid feeling. This indicates that the chest is highly susceptible to exercise duration in the initial phases of activity. In the Step2-4 exercise stage, the predominant perception across all parts is a combination of humidity and restraint, with restraint predominantly felt in the lower body and humidity concentrated in the upper body. Hence, when designing tight-fitting sportswear, it is crucial to consider attire that adapts to both the upper and lower body in accordance with exercise demands. During the Step2-5 exercise stage, the primary comfort sensation is a sticky body feeling, which persists into the rest stage post-exercise. In the rest stage, the lower body experiences a sticky body sensation, potentially due to increased constraint from tight-fitting garments, making the sticky feeling in the lower body more pronounced than other sensations.
The findings also suggest that the effect of exercise on comfort is not uniform across different body regions. For example, tighter-fitting sportswear on the upper body may contribute to greater perceptions of restraint and overheating during running, while the lower body may experience more pronounced humidity-related discomfort due to the higher concentration of sweat glands in certain areas. These nuanced differences underscore the need for designing clothing that accounts for regional physiological variations and their interaction with fabric properties.
Additionally, the variation in local perceptions across body regions points to the importance of material and structural design in tight-fitting sportswear. Breathable fabrics or zoned designs, which strategically reduce tightness or allow for better air circulation in areas prone to sweating, could mitigate the onset of discomfort during prolonged motion. These insights have practical implications for sportswear innovation, particularly in improving fabric technology to enhance comfort during dynamic physical activities.
Time effect of comfort perception in different sports stages
With the passage of exercise time, the correlation between local comfort has changed, and the local comfort perception that affects the overall comfort has also changed. Through the analysis of Spearman correlation in each movement stage, it can be known that with the movement time, the comfort perceptions gradually become significant and the significance tends to strengthen, so there is a certain relationship between the significance of sports perceptions and the movement time. For example, in the first stage of exercise (Step2-1), there is a significant correlation between discomfort; Step2-2: There is a correlation between stuffy feeling and sticky body feeling (correlation coefficient: 0.320) ( p < .05).
Step2-3: comfort perception with correlation: stuffy feeling and sticky body feeling (correlation coefficient: 0.393) ( p < .001), stuffy feeling and humidity feeling (correlation coefficient: 0.238) ( p < .05), sticky body feeling and humidity feeling (correlation coefficient: 0.394) ( p < .001). Sticky body feeling and rough feeling (correlation coefficient:-0.288) ( p < .05), humidity feeling and restraint feeling (correlation coefficient: 0.347) ( p < .001), restraint feeling and soft feeling (correlation coefficient:-0.249) (p < .05). Among them, the sticky body feeling is negatively correlated with the rough feeling, the restraint feeling is also negatively correlated with the soft feeling, and other senses are positively correlated.
Step2-4: stuffy feeling and sticky body feeling (correlation coefficient: 0.800) ( p < .001); stuffy feeling and humidity feeling (correlation coefficient: 0.664) (p < .001), stuffy feeling and restrained feeling (correlation coefficient: 0.300) ( p < .001); stuffy feeling and rough feeling (correlation coefficient:-0.500) (p < .001); stuffy feeling and soft feeling (correlation coefficient:-0.353) (p < .001); sticky body feeling and humidity feeling (correlation coefficient: 0.719) (p < .001); sticky body feeling and restraint feeling (correlation coefficient: 0.367) (p < .001); sticky body feeling and rough feeling (correlation coefficient:-0.524) (p < .001); sticky body feeling and soft feeling (−0.296) (p < .001); humidity feeling and restraint feeling (correlation coefficient: 0.384) (p < .001); humidity feeling and rough feeling (−0.474) (p < .001); humidity feeling and soft feeling (correlation coefficient:-0.379) (p < .001); restraint feeling and rough feeling (correlation coefficient:-0.263) (p < .001); restraint feeling and soft feeling (correlation coefficient:-0.316) (p < .001); rough feeling and soft feeling (correlation coefficient: 0.210) (p < .05). Among them, the significant correlations between stuffy feeling and rough feeling, stuffy feeling and soft feeling, sticky body feeling and rough feeling, sticky body feeling and soft feeling, humidity feeling and rough feeling, humidity feeling and soft feeling, restraint feeling and rough feeling, and restraint feeling and soft feeling are all negatively correlated. Compared with Step2-3, the significantly related comfort is increased and changed. For example, the correlation between stuffy feeling and sticky body feeling is in Step2-3, with a coefficient of 0.393. The coefficient becomes 0.800, which shows that the correlation between them increases with the passage of time, mainly because with the continuation of exercise, the accumulation of a lot of sweat and heat in human body affects the correlation between sticky body feeling and stuffy feeling to some extent.
Step2-5: stuffy feeling and sticky body feeling (correlation coefficient: 0.725) (p < .001); stuffy feeling and humidity feeling (correlation coefficient: 0.669) (p < .001), stuffy feeling and restraint feeling (correlation coefficient: 0.187) (p < .05); stuffy feeling and rough feeling (correlation coefficient:-0.525) (p < .001); stuffy feeling and soft feeling (correlation coefficient:-0.414) (p < .001); sticky body feeling and humidity feeling (correlation coefficient: 0.792) (p < .001); sticky body feeling and itching feeling (correlation coefficient:-0.214) (p < .001); sticky body feeling and rough feeling (correlation coefficient: 0.524) (p < .001); sticky body feeling and soft feeling (correlation coefficient: 0.296) (p < .05); sticky body feeling and rough feeling (correlation coefficient:-0.677) (p < .001); sticky body feeling and soft feeling (correlation coefficient:-0.525) (p < .001); humidity feeling and restraint feeling (correlation coefficient: 0.186) (p < .05); humidity feeling and rough feeling (−0.618) (p < .001); humidity feeling and soft feeling (correlation coefficient:-0.532) (p < .001); rough feeling and soft feeling (correlation coefficient: 0.422) (p < .001). Compared with Step2-4, the significantly related perceptions have also changed, some of which are weakened, while others are enhanced, such as the correlation coefficient between stuffy feeling and sticky body feeling decreased, and the correlation coefficient between humidity feeling and sticky body feeling increased.
The analysis of the comprehensive results indicates that the degree of correlation between overall comfort will change (increase or decrease) with the passage of time.At the rest stage following running, the predominant perceptions are of humidity and sticky body feeling, affecting the back, waist, chest, abdomen, hip, shank and thigh. As exercise time increases, the predominant perception shifts from humidity to sticky body sensations, primarily due to the enhanced sweating observed in these regions.In the context of running, the waist exhibits a more intricate relationship with overall comfort, necessitating the incorporation of ergonomic design elements to ensure optimal comfort. The thigh and back regions are more susceptible to discomfort than the hip region due to reduced nerve distribution.In the recovery phase following exercise, the predominant sensations experienced across all key body areas are humidity and sticky body sensations.A correlation analysis reveals a significant correlation between increased comfort levels, with this correlation being particularly evident.Furthermore, as exercise time progresses, the correlation between perceptions undergoes changes, either increasing or decreasing. This is attributed to the fact that as exercise continues, perceptions undergo changes, which in turn leads to alterations in the correlation between these perceptions.
In summary, in order to enhance the sports comfort performance of tights, it is essential to design tight-fitting sportswear for different sports durations, taking into account the comfortable time response characteristics of key parts. Furthermore, the correlation between comfort perception and the passage of exercise time should be considered, as the time factor is a crucial element in analyzing the correlation of comfort.
Analysis of the differences in body parts’ comfort sensitivity of sportswear
It has been discovered that the upper body serves as a primary zone for heat and humidity concentration, whereas the lower body is predominantly where restraint sensations are felt. Furthermore, it is noted that the perception of certain body parts exerts minimal impact on overall comfort. For instance, the shank’s viscosity(or sticky body) evaluation holds a low value yet barely influences the perception of body stickiness, indicating that the shank’s sticky body sensation contributes less to comfort compared to other areas. Additionally, the hip area exhibits a weaker stuffy sensation in terms of comfort when compared to other parts. Following a thorough analysis of the sensitivity of various body parts to each perception, a ranking has been established based on sensitivity, ranging from excellent to poor. It is worth noting that due to the minimal itching experienced in specific body parts or during particular stages of exercise with the tight-fitting sportswear used in this experiment, it is challenging to accurately measure the sensitivity of each part. Consequently, and considering its negligible impact on overall sports comfort throughout the activity, the sensitivity to itching has not been evaluated, as follows: The order of sensitivity to rough feeling: thigh, chest, back, shank, abdomen, waist, hip; The order of sensitivity to stuffy feeling: thigh, chest, back, waist, abdomen, shank, hip; The order of sensitivity to sticky body feeling: back, thigh, chest, abdomen, waist, hip, shank; The order of sensitivity to humidity feeling: back, chest, abdomen, hip, thigh, waist, shank; The order of sensitivity to restraint feeling: chest, back, thigh, shank, hip, abdomen, waist; The order of sensitivity to soft feeling: thigh, shank, back, chest, waist, abdomen, hip; Ranking the parts most likely to cause discomfort: chest, thigh, back, waist, abdomen, shank, hip.
According to the results of the study on the distribution of local comfort in different stages of exercise, we can draw the following contents:
In the static state (Step 1), participants generally feel uncomfortable during the static standing stage, which is manifested in the roughness of the back, waist, abdomen and buttocks, as well as the sultry feeling of the waist, chest and calves. This shows that at rest, some body areas begin to show signs of discomfort, especially in the compressed parts.
In the exercise stage (Step 2-1 to Step 2-5), at different stages after the start of exercise, the local discomfort gradually increased, and the types and distribution changed obviously. In Step 2-1 (the initial stage of running), the back kept rough, but the waist and chest began to itch, and the abdomen became soft, while the calves and thighs felt sultry and bound respectively. With the continuous exercise, during the period from Step 2-2 to Step 2-3 (middle exercise), the back, chest and other parts began to be obviously wet, and the sense of restraint gradually extended to the waist, buttocks and lower limbs, and the sultry feeling of thighs and calves became more and more obvious, indicating that local heat accumulation was related to the intensity of exercise. During Step 2-4 and Step 2-5 (at the end of exercise), the back, waist and abdomen feel more wet and sticky, indicating that the degree of sweating increases, and the restraint of calves and buttocks is the most obvious, suggesting that the comfort of these areas decreases obviously at the end of exercise.
In the 10-minute rest period after the end of exercise (step3), there is still discomfort in the body. The back, abdomen, waist and buttocks remain moist and sticky, the chest and thighs still feel sultry, and the bondage of the calves has not subsided. This situation shows that the accumulation of heat and humidity caused by exercise takes a long time to ease, and the comfort recovery in some areas is slow.
Throughout the entire exercise process, discomfort levels in various body regions—such as the back, waist, and chest—were found to vary depending on the phase of activity (at rest, during exercise, and post-exercise recovery). These variations highlight the dynamic nature of human-clothing interaction under different physical conditions. Specifically, during exercise, the sensations of restraint and stickiness were particularly intense in the waist, hips, thighs, and shanks. This suggests that these areas are especially sensitive to physical activity-induced changes(i.e. these areas are most prone to discomfort during long-term exercise.), likely due to their roles in facilitating movement and bearing mechanical loads.
Restraint and stickiness in dynamic regions
The pronounced restraint and stickiness in the lower body can be attributed to the mechanical pressures exerted by tight-fitting garments in these regions during activities involving repetitive or high-intensity movements. For example, the waist and hips, being pivotal for core stabilization and load transfer during dynamic activities, experience continuous friction and compression. Similarly, the thighs and shanks, which undergo repetitive muscle contractions and contact with fabric during motion, are more likely to amplify sticky sensations due to increased perspiration and insufficient ventilation in these areas. This reinforces the importance of optimizing clothing fit and fabric stretchability in these regions to minimize discomfort during exercise.
Temporal variations in humidity and heat sensations
As exercise continues, a marked increase in perceptions of humidity and heat sensation becomes evident, particularly in the areas mentioned above. These changes can be attributed to the body’s thermoregulatory mechanisms, such as sweating and heat dissipation, which are intensified during prolonged activity. Notably, the inability of these areas to recover fully in a short period after exercise underscores the persistence of residual discomfort. This delayed recovery is likely due to localized moisture retention and slow evaporation rates in areas where tight garments hinder airflow, leading to a cumulative effect on perceived discomfort.
Implications for long-term comfort and recovery
The findings suggest that prolonged exercise not only exacerbates localized discomfort in high-stress regions but also impacts post-exercise recovery. For instance, the lingering humidity and heat sensations indicate that the design of sportswear should prioritize effective moisture-wicking and thermal management, especially in areas prone to sweat accumulation. Technologies such as zonal ventilation, moisture-absorbent fabrics, and targeted compression zones can play a crucial role in mitigating these effects. Additionally, the delayed recovery highlights the potential need for post-exercise garments designed to expedite cooling and drying processes, improving overall comfort and recovery efficiency.
Practical applications for sports equipment design
These observations provide valuable insights for sports equipment design, emphasizing the need for tailored solutions that address region-specific discomfort during motion. For example, incorporating highly elastic and breathable fabrics in the waist and lower body could alleviate restraint and improve air circulation, reducing sticky sensations. Similarly, employing seamless or strategically placed low-friction panels in high-motion areas like the hips and thighs may further enhance comfort during extended physical activity. These design strategies could significantly improve the user experience and performance outcomes for athletes and recreational users alike.
Conclusion
This study systematically reveals the dynamic change mechanism of clothing comfort perception during exercise and in the recovery stage after exercise, fills the gap in the existing research in this field and enriches the theoretical system of sports clothing comfort perception. By putting forward a brand-new dynamic analysis framework, the research provides a new perspective and method for related fields, which has important academic value and practical significance. The research results not only provide scientific basis for the design and production of sportswear, but also help to improve the sports experience and health level of athletes, and will also promote the innovative development of sportswear industry. Compared with the existing literature, this study systematically analyzes the changes and regional differences of comfort perception in each stage and recovery period of exercise, which makes up for the deficiency of dynamic comfort perception research, especially provides a powerful theoretical guidance in the balance between functionality and comfort. In the future, these findings will provide theoretical support for the development of intelligent sportswear and the promotion of healthy sports experience, and further promote the cross-research between sports science and fashion design, and promote the promotion of healthy lifestyle.
Footnotes
Declaration of conflicting interests
The author(s) declared no potential conflicts of interest with respect to the research, authorship, and/or publication of this article.
Funding
The author(s) disclosed receipt of the following financial support for the research, authorship, and/or publication of this article: The authors would like to acknowledge the financial support from Supported by Scientific Research Foundation, Zhejiang Sci-Tech University (No. 24072193-Y).