
Abstract
In this study, the distribution characteristics and changing law of sports comfort perception were analyzed by collecting the comfort evaluation data of running in winter tight sportswear, and proposes a network model based on particle swarm optimization-cuckoo search-long short-term memory to track the changing law of motion comfort. First, considering the existence of redundant features, analytic hierarchy process analysis is used to screen out key features; and then, particle swarm optimization and cuckoo search algorithms are used to optimize the key parameters of the long short-term memory prediction model, so as to avoid the model prediction performance caused by the selection of parameters based on experience. The experiments compared the prediction accuracy of other models, and selected mean absolute error, root mean square error, and mean absolute percentage error evaluation indicators to verify the effectiveness of these models. The results show that the perception of wearing comfort changes over time, but when it reaches the extreme point at a certain moment, and then it gradually falls back. The humidity sense and thermal sense of bust, crotch, and back in human body are the main comfort perceptions that affect movement; LSTM and the optimized LSTM models are suitable for the prediction of comfort perception at different times during exercise. Among them, the PSO-CS-LSTM model can more accurately track the changing trend of motion comfort, the prediction has high prediction accuracy and validity; we selected three different running speeds as the experimental data, which also verifies the universal applicability of the model.
Keywords
With the improvement of people’s living standards, today’s diversified lifestyles inspire people to yearn for and enjoy a free and green life, and constantly try to challenge and break through themselves. As a new fashion, sports are becoming more and more popular among the public. Various online forums also actively spread and promote the knowledge of fitness sports, promoting the establishment of various sports associations and clubs, and promoting the rapid development of sportswear market, which shows three major trends of clothing segmentation, specialization and intelligence. Sportswear is no longer the training clothes and competition clothes of athletes, but it has become an indispensable equipment for many ordinary people who are interested in fitness and daily exercise. Wearing high-performance sportswear not only reduces the fatigue of athletes, but also enables the wearer to show off his professional pleasure to others. With the increasing number of modern sports items, the diversity of sports items also leads to the diversity of sportswear. Different sports items have different requirements, and the functionality of required clothing is different. As a kind of sportswear, tights are getting more and more popular among the general public. At the same time, the research of tights has been paid more and more attention by domestic and foreign scholars. Tight sportswear includes tight tops, one-piece tights, corsets, compression stockings, compression garments and so on, which are mainly used for running, swimming, cycling, diving, surfing, and other sports. The style and structure design of modern sportswear should be professionally designed according to different functional requirements of sports items.
At present, many scholars have carried out different studies on tight-fitting equipment, and some scholars proposed that tight-fitting clothing could help the wearer to improve the athletic performance, which is mainly reflected in the aspects of fatigue recovery, strength performance, physiology and energy metabolism, drag reduction, injury protection and so on.1–15 Some scholars only studied the comfort of tight sportswear from the aspects of new fibers, yarns, fabrics, clothing structure, or sewing process. Troynikov et al. 16 investigated the effect of physical attributes of fabric and their composition in tight sportswear on the amount and distribution of pressure generated to the underlying body. Suganthi and Senthilkumar 17 analyzed the moisture management properties of seven bi-layer knitted fabrics for active sportswear comfort. Suganthi and Senthilkumar 18 carried out an investigation on influence of tri-layer knitted structure on thermal comfort characteristics of layered knitted fabrics . Wardiningsih and Troynikov 19 determined the effect of fabric direction, fabric composition and number of fabric layers on pressure generated by sport compression garments. Virginija and Giedre 20 found that the air permeability of the investigated knitted fabrics depends not only on their structure parameters but also on the fabric seam type. Some scholars have also studied sports comfort, but they are only limited to pressure or thermal-humidity, and have not conducted systematic research. Quesada et al. 21 investigated the effects of graduated compression stockings on skin temperature after running. Valenza et al. 10 performed the same quantitative wetness sensory test prior to and following a maximal running test. Tanda 22 investigated the total body skin temperature during running exercise on treadmill, he gathered thermal maps of the anterior and posterior body regions, before, during and after the exercise, by infrared thermography. Vasile et al. 23 studied the effect of two rowing postures on skin-sportswear interface pressure for competitive rowers, they found a considerable influence of the catch and finish posture on interface skin-sportswear pressure. However, when people are exercising, the sense of comfort is a complex, so it is very important to study the comfort characteristics and distribution during exercise, only in this way can sportswear be designed more specifically. In addition, although some scholars have studied sports comfort, they only study the comfort perception before or after exercise, and rarely analyze the comfort state during exercise. And the comfort state during exercise has an intuitive importance for sports performance.24,25 Zeng et al.26,27 claimed that sensory evaluation is simpler and more efficient for quality determination related to consumer’s behavior compared with physical measures, and it cannot be completely replaced by objective evaluation, comfort research should be people-oriented. Although sensory evaluation also has certain limitations, after reasonable design, the effectiveness of sensory evaluation can often be greatly improved. Some scholars only analyze the comfort of several sports postures to analyze the sports comfort. Silina et al. 28 proposed a model for the development of 3D interface pressure modeling by considering the athlete’s shank 3D shape and sportswear pressure in the motion posture. However, their research on dynamic comfort mainly focuses on the static study of dynamic posture (that is, decomposing dynamic posture and analyzing human comfort in a static form). There is a big difference between this research model and the actual movement, because the actual movement is continuous and the comfort perception is also changing continuously. Even though some researchers29–31 have analyzed the comfort analysis of continuous movements, they only used the comfort value of a certain time point as the judgment basis of exercise comfort, they did not study the dynamic change of comfort during exercise. Dynamic comfort is an interval change feature, rather than a value, so the current related research is difficult to meet the substantial optimization of tight sportswear comfort.
Summarizing the existing research, we know that the research at home and abroad mainly focuses on the application research of tight sportswear, such as energy metabolism, muscle function, mechanical performance, drag reduction effect, injury protection and sports medicine, and they have made a certain foundation.32–34 However, as the clothes that cling to human skin, the comfort of tight sportswear is also a key performance that cannot be ignored. Comfort evaluation of tight sportswear is mainly judged by human senses, and the process of analyzing comfort information is extremely complicated, 35 which is related to whether clothing and human body meet a series of requirements.
The existing research on sports comfort perception is only the research of overall comfort, without studying the distribution characteristics and change law of comfort perception during exercise, and neglecting the monitoring and analysis of the change of sports comfort perception. In addition, different exercise intensities will produce different exercise loads on the human body. In order to achieve the steady state of the body, the human body itself will have different physiological and psychological reactions. This reaction is not limited to the comfort such as pressure or thermal-humidity, but may be the comprehensive result of several kinds of comfort perception. Because there will be different perceptions in the process of exercise, it is necessary to study and analyze the fluctuation of comfort perception in the process of exercise in order to better improve the comfort of tight sportswear. In order to make clear the dynamic change of the comfort of tight sportswear in the exercise state, this study firstly makes clear the time response characteristics of the sports comfort, establishes the time model of the comfort, quantifies the change characteristics of the comfort, and provides the method and theoretical basis for the comprehensive dynamic comfort research of clothes.
Experiment
Participants
Fourteen male personnel were recruited as initial experimental participants. Their age and body shape parameters were as following: Age: 27±2, Height: 176.2±2.1 cm, Weight: 69.8±4.3 kg, Chest: 87.7±2.8 cm, Thigh: 55.3±2.2 cm, Hip: 94.0±3.1 cm, Waist: 74.4±2.0 cm. They were recorded as M1, M2, M3, ..., M8, respectively. All participants have many years of running experience.
All subjects were free of disease; all voluntarily completed the entire experiment. And all participants were asked to avoid intense exercise, refrain from alcohol and caffeine 24 h before the test.
Upon arriving at the laboratory, participants signed informed consent and filled out a basic health check. Approval of this study was given by the ethics committee of Ecole Nationale Supérieure des Arts et Industries Textiles.
All the volunteers were taken to the climate chamber to test the temperature sensitivity, humidity sensitivity, and pressure sensitivity. The specific test details were as follows: Firstly, by adjusting the temperature of the climate room, 12 subjects who were sensitive to temperature were selected; and then, adjusted the humidity of the climate chamber, test the humidity sensitivity of 12 subjects, and 11 subjects were selected; according to the upper arm circumference of 11 participants, three kinds of arm sleeves samples (92% polyester, 8% spandex) were designed for each subject which were for pressure sensitivity test, and the sizes were −1, −2, and −3, respectively, as shown in Figure 1. Finally, eight participants were selected as experimental participants of this research and would complete the experimental protocol. Upper arm sleeve.
Experimental garments
Fabric parameters of tight sportswear.
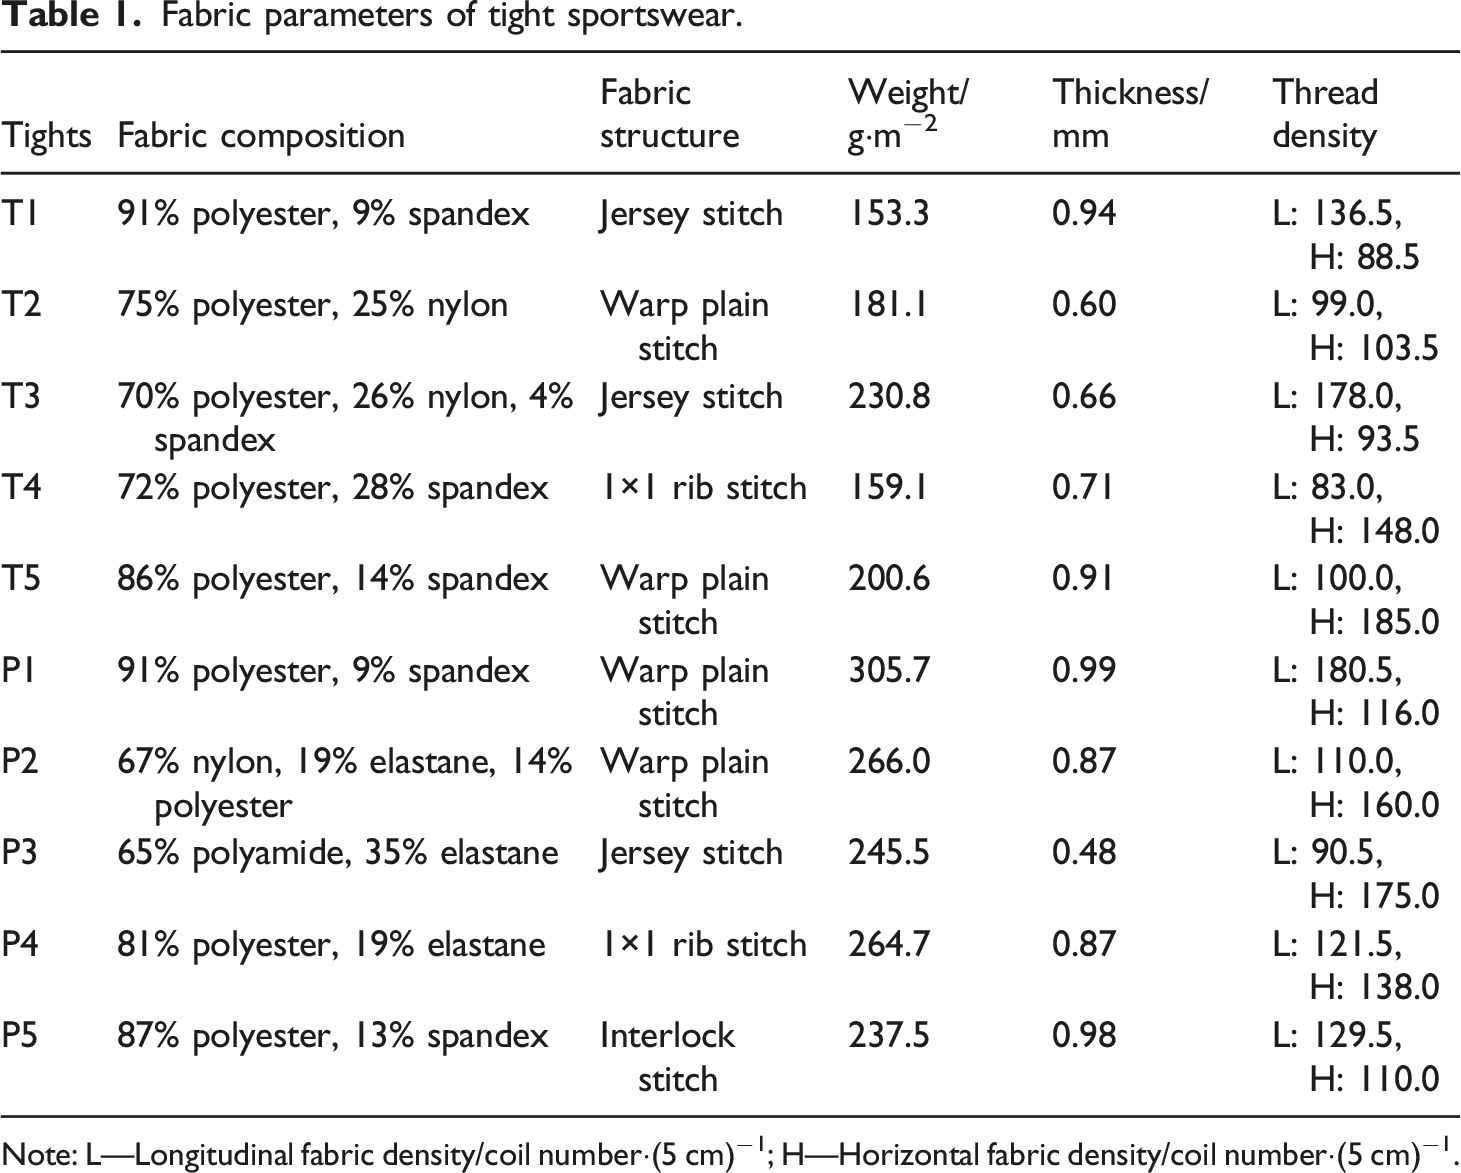
Note: L—Longitudinal fabric density/coil number·(5 cm)−1; H—Horizontal fabric density/coil number·(5 cm)−1.
Twenty five different test garments, categorized as T1P1, T2P2, T3P3, ..., T4P3, T5P1, were used as a result of the combination of five tight tops (T1, T2, ..., T5) and five tight pants (P1, P2, ..., P5). The experiment ends until each subject wears all the combination of tops and pants.
Experimental environment
All test processes are carried out in an environment with room temperature (5±1)°C, relative humidity (78±5)%, and indoor wind speed (5.3±0.1)m/s. In order to avoid the potential bias resulting from the effect of thermoregulation, 36 the experiment was carried out at the same time every day in consideration of the circadian rhythm of humans.
Experimental content
In order to ensure that the selected parts are more comprehensive and representative, after summarizing the literature and our own research experience,37–45 the key parts that affect the comfort during exercise and the perception of comfort are preliminarily selected, mainly including the abdomen, body side, bust, crotch, back, waist, upper arm, armpit, shank, and thigh; sports comfort perception mainly includes humidity sense, thermal sense, sticky body sense, restraint sense, itching sense, rough sense, and soft sense.
Therefore, when the subjects ran in the experimental tight sportswear, we collected the data of the above-mentioned body parts’ humidity sense, thermal sense, sticky body sense, restraint sense, itching sense, rough sense, and soft sense.
Experimental protocol
(1) Prior to the experiment, all participants must keep a good mood and they must enter a climate chamber in advance and adjust to the new condition for about 20 minutes. (2) The participants wore experimental tight sportswear and ran on the treadmill and they must run for 50 min. The subjects were asked about the comfort of each body part every 5 min and the participants evaluated the tactile comfort, thermal comfort, humidity comfort, and pressure comfort of the tight sportswear they were wearing according to Table 2. (3) The running test was divided into three groups, and the running speed was 3 km/h, 6 km/h, and 8 km/h, respectively. That is, the first group: light-intensity exercise (slow speed running, the speed is 3 km/h), and the comfort of the sportswear is scored during the exercise; the second group: moderate-intensity exercise (medium speed running, the average speed is 6 km/h), and the comfort of the sportswear is scored during the exercise; the third group: high-intensity exercise (fast speed running, average speed is 8 km/h), and the comfort of the sportswear is scored during the exercise. The comfort perception evaluation value of each combination of tight sportswear is the average value of eight participants' comfort evaluation of this tight sportswear. Comfort perception evaluation scale.

Methods
In recent years, with the development of new technologies such as information technology and artificial intelligence, more and more emerging technologies are applied to the research of clothing comfort. However, clothing comfort is a simultaneous coupling process, which is a very complicated and rapidly changing process. Although many scholars at home and abroad have established some mathematical models or invented some devices to try to explain the changes of clothing comfort, it is in the complexity of the actual situation, and each method must be based on certain assumptions and preconditions, and there is still a big gap with the actual situation.
At the same time, as far as sports comfort is concerned, it is a multi-dimensional feature with complicated relationships. In order to better analyze the wearing comfort of tight sportswear in motion, this study introduces long short-term memory (LSTM) to study sports comfort for the first time. Sports comfort itself is a dynamic change, which is a time function, and it is also the accumulation of data of comfort perception and its influencing factors, therefore, LSTM is very suitable for solving the prediction problem of comfort perception sequence .46,47
In a word, the causes of sports comfort are influenced by many factors, which can’t be summarized by one factor, and show the characteristics of high noise, nonlinear, low frequency, which make the series difficult to fit. Although the general neural network prediction method can better fit nonlinear comfort perception in prediction accuracy, it can’t well describe the memory of sports comfort perception, which has pre and post effects. Therefore, it is particularly appropriate to introduce the neural network model with memory characteristics to predict the comfort in the exercise state. Finally, the future comfort state can be predicted by the comfort before the current moment, so as to understand the change law and the state of human comfort in the exercise state more intuitively and more quickly. In addition, because there are too many indexes that affect sports comfort, we first used analytic hierarchy process (AHP) to assign weights to the comfort perception of key body parts selected preliminarily, and then select the key indexes for building the model. Therefore, the main flow of the research method is as follows: (1) Weighting the comfort perception by AHP to select the key comfort perception of body parts; (2) particle swarm optimization-cuckoo search (PSO-CS) was used to optimize various parameters, and then LSTM was used to predict the comfort perception at different times.
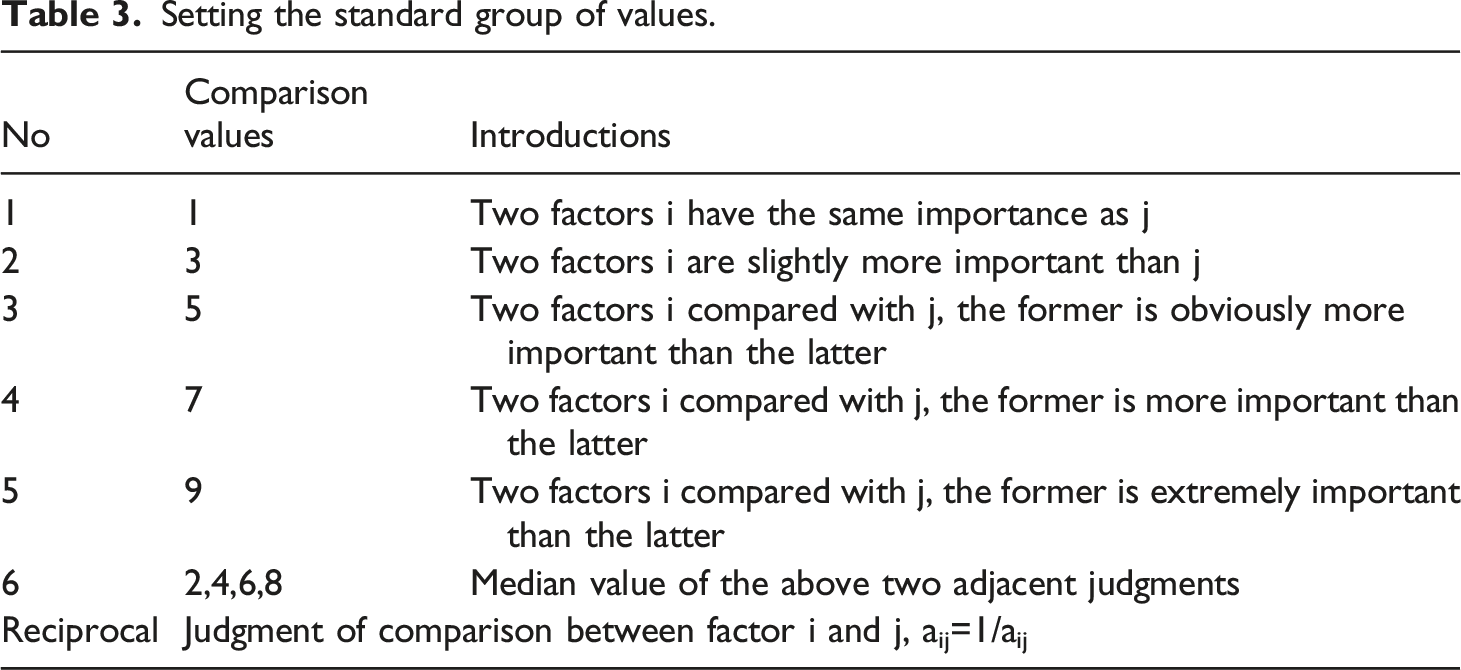
Analytic hierarchy process model
Setting the standard group of values.
Long short-term memory model
Long short-term memory (LSTM) neural network model is a special form of recurrent neural network. LSTM neural network can not only deal with nonlinear mapping between multivariate variables, but also deal with time series data well, which has achieved success in many researches and applications. At present, LSTM is mostly used in transportation, finance, and other fields to predict time series data such as signals and prices, but not clothing comfort. For the first time, this study proposes to use LSTM model to study and analyze sports comfort, realize the use of comfort perception in the previous period and predict the comfort in the later period, which is helpful to optimize the design of sports tights and improve the wearing comfort.
LSTM neural network has great advantages in forecasting time series data. LSTM introduces the “gate” structure to strengthen the ability of controlling information transmission and communication between cells. The LSTM cell structure consists of input gate, output gate, forget gate, and cell state. The specific cell structure is shown in Figure 2. At time t, there are three input parameters of LSTM network: the input value LSTM basic cell structure.
In the forward propagation stage, the t time memory unit receives the input 
The information that neurons need to keep is realized by the input gate. The input gate calculation is divided into two parts: using Sigmoid function to calculate the update value 
The cell state update includes the product of the forget gate output and the cell output at time t−1, plus the product of the input gate output and the candidate value.
The update of the final output gate, that is, the hidden layer output at time t, is determined by equation (4).
However, similar to other neural network models, some parameters in LSTM neural network model need to be set artificially, such as the size of time window, batch number, number of hidden layer units. These parameters directly control the topological structure of the network model, and the prediction performance of the models trained by different parameters varies greatly, so it is particularly important to choose appropriate model parameters. At present, the selection of hyperparameters of network models often depends on the experience of researchers and the results of many experiments, which consumes a lot of manpower and computing resources.
In a word, the traditional LSTM has very complicated calculation. And the longer the input, the larger the information contained in the data. The traditional LSTM model will show obvious instability in the training process, and even the gradient will disappear.48–50 Therefore, this study proposes PSO-CS optimization algorithm to iteratively optimize the LSTM model and find the optimal parameters of the model. That is, the PSO-CS algorithm is used to optimize the two key parameters of LSTM model (the number of neurons m and the learning rate lr). On the premise of satisfying the optimal evaluation index of the model, the PSO-CS-LSTM combined prediction model is built according to the optimized parameters. The PSO-CS algorithm is used to match the comfort perception data features with the topology of LSTM neural network to obtain higher prediction performance. This model overcomes the problem of low prediction accuracy caused by the traditional selection of parameters based on experience.
LSTM model based on PSO-CS optimization
At present, excellent algorithms emerge one after another, but no single algorithm could solve all optimization problems well. The combination of various algorithms has become an effective means.51,52 In this paper, PSO-CS hybrid algorithm was adopted, in which PSO is the most widely used algorithm because of its simplicity and convergence speed. It also proves that CS can search the global optimal value, but its speed is very slow. In order to solve the above problems, a hybrid algorithm of PSO and CS (PSO-CS) was proposed.
The implementation process of LSTM prediction model based on PSO-CS is shown in Figure 3. Model system main body: PSO-CS-LSTM network prediction model.
Results and discussion
Selection of model indicators
Weights of comfort sense.
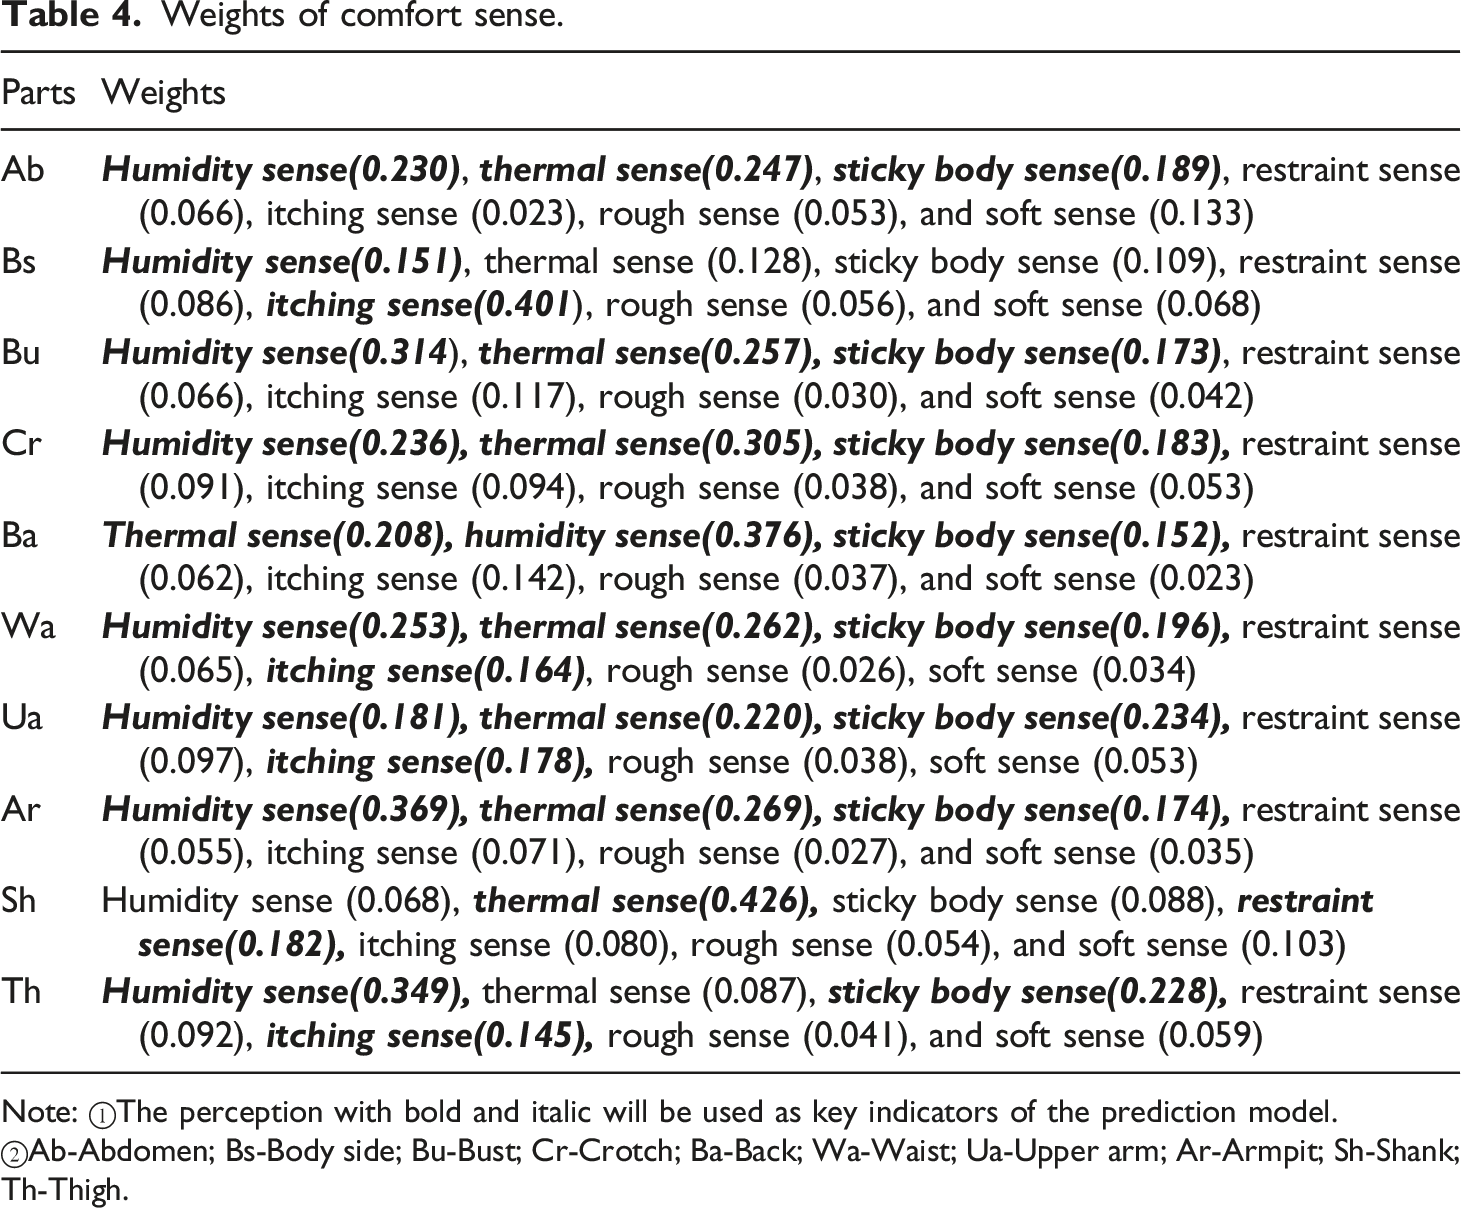
Note: ①The perception with bold and italic will be used as key indicators of the prediction model.
②Ab-Abdomen; Bs-Body side; Bu-Bust; Cr-Crotch; Ba-Back; Wa-Waist; Ua-Upper arm; Ar-Armpit; Sh-Shank; Th-Thigh.
According to the results of AHP, we obtained the main comfort perception of three groups of exercise states, respectively.
Running (3 km/h): the main comfort perceptions in some key body parts are abdomen (humidity sense, thermal sense, sticky body sense), side body (itching sense, humidity sense), bust (humidity sense, thermal sense, sticky body sense), crotch (humidity sense, thermal sense, sticky body sense), back (humidity sense, thermal sense, sticky body sense), waist (humidity sense, thermal sense, sticky body sense, itching sense), upper arm (humidity sense, thermal sense, sticky body sense, itching sense), armpit (humidity sense, thermal sense, sticky body sense), shank (thermal sense, restraint sense), and thigh (humidity sense, sticky body sense, itching sense).
Running (6 km/h): the main comfort perceptions in some key body parts are abdomen (humidity sense, thermal sense, sticky body sense), side body (itching sense, humidity sense), bust (humidity sense, thermal sense, sticky body sense), crotch (thermal sense, sticky body sense), back (humidity sense, thermal sense, sticky body sense), waist (humidity sense, thermal sense, sticky body sense), upper arm (humidity sense, thermal sense, sticky body sense, itching sense), armpit (humidity sense, thermal sense, sticky body sense), shank (thermal sense, restraint sense), and thigh (thermal sense, sticky body sense, itching sense).
Running (8 km/h): the main comfort perceptions in some key body parts are abdomen (humidity sense, thermal sense, sticky body sense, restraint sense), side body (itching sense, sticky body sense), bust (thermal sense, sticky body sense, itching sense), crotch (thermal sense, sticky body sense, restraint sense), back (humidity sense, thermal sense, sticky body sense), waist (humidity sense, thermal sense), upper arm (thermal sense, sticky body sense, itching sense, restraint sense), armpit (humidity sense, sticky body sense), shank (thermal sense, restraint sense), and thigh (thermal sense, restraint sense).
According to the analysis of the results, we found that at different speeds, most of the same parts have the same comfort sense, but there are different senses. For example, at 3 km/h, there are humidity sense, sticky body sense, and itching sense perception in the thigh; while at 6 km/h, the comfort perception of the thigh is mainly thermal sense, sticky body sense, and itching sense; at 8 km/h, the comfort perception of thigh mainly includes thermal sense and restraint sense.
Comfort perception result
According to the key indicators after AHP optimization, the non-key indicators were excluded. In order to get a more comprehensive understanding of the changing law of sports comfort perception, the average evaluation of the optimized comfort perception of all combined tight-fitting sportswear was carried out, as shown in Figure 4. The changing curve of sports comfort. 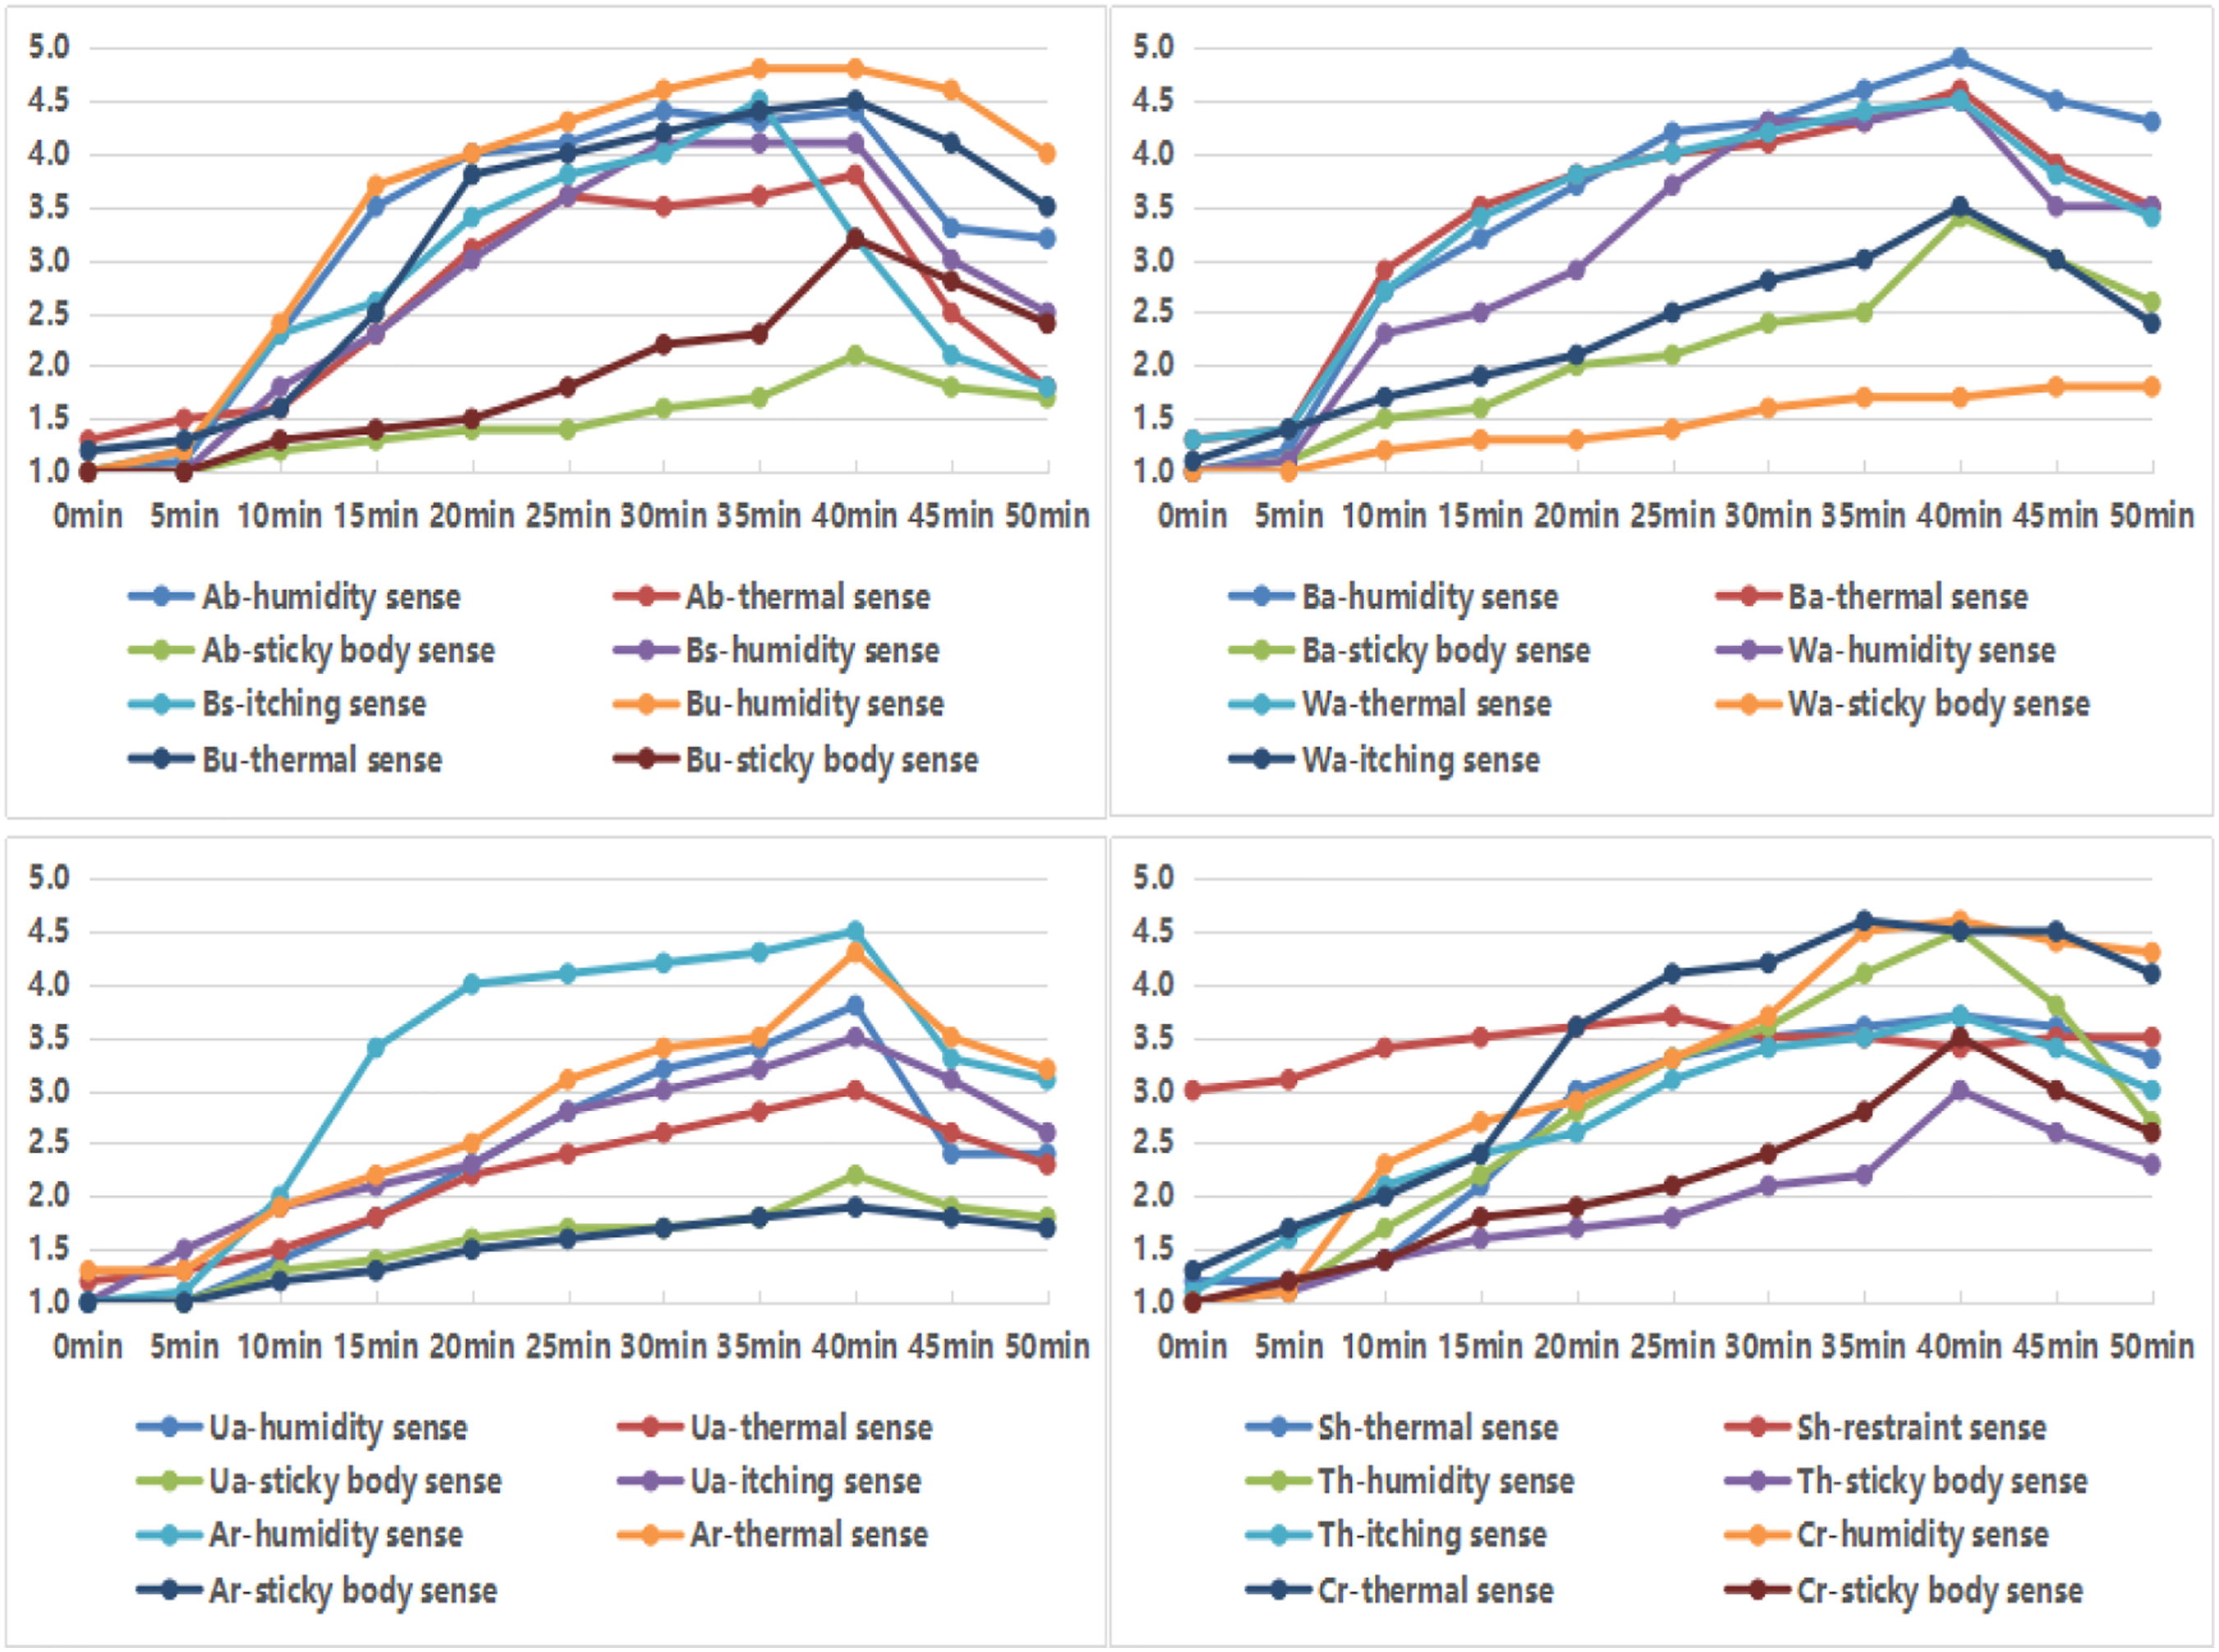
It can be seen from Figure 4 that at 0 min, since the subjects did not start exercising, the difference in comfort perception when wearing the tight sportswear was small, and the perception evaluation was basically close. From the 15th minute, the human body began to sweat a lot. At the 20th minute, the subjective variability began to increase.
The thermal sensation level of each body part increased at first and then decreased with the increase of exercise time. And it reached the maximum value at about the 40th minute, and then began to decrease. The main reason is that the human body begins to produce heat at the beginning of exercise, and the sense of heat increases. With the increase of exercise, the amount of sweat also increases, taking away part of the heat, and as the amount of sweat increases, the amount of heat that is taken away increases, so the thermal sensation reaches a peak and starts to fall back.
Except for the strong cold feeling in the shank, the restraint sense fluctuates slightly during the whole exercise process, and other senses are not obvious, which indicates that the warm-keeping design should be appropriately increased in the shank, and the restraint sense should be taken into account while reducing the shank’s muscle vibration and improving the exercise performance.
The humidity sense of back and bust is stronger than that of other parts, followed by abdomen, crotch, and armpit. Besides the shank, the humidity sense of other parts is dominant, and the humidity sense of bust, back, and crotch changes slowly with the extension of exercise time. Therefore, with regard to the comfort of tights sportswear, we should consider increasing the function design of moisture absorption and moisture conduction, especially bust, back, and crotch.
In order to better describe the fluctuation state of each comfort perception, analysis of variance (ANOVA) was introduced. Through the variance results, it is found that during the whole exercise process, the humidity comfort in bust fluctuates the most over time (i.e. the most change) (the variance value is 1.337), followed by the humidity sense in back, while the restraint sense in shank fluctuates the least over time (i.e. the least change) (the variance value is 0.196). However, considering all the comfort change trends of each part, the comfort perception grades of bust (the variance value is 1.0897), body side (the variance value is 1.1070), back (the variance value is 1.0229), and crotch (the variance value is 1.0632) change greatly.
With the increase of exercise time, the itching sense decreases, and all the senses of each part show a decreasing trend after 40 min of exercise, so the 40th minute can be regarded as a demarcation point of the change of motion comfort.
In a word, humidity sense and thermal sense are the main perceptions that affect sports comfort, and the humidity sense and thermal sense of bust, crotch, and back are strong, so these three parts are the key design parts of thermal sense and humidity sense.
Data selection for the model
This study predicted the comfort perception of each body part of the tights sportswear from the 40th minute to the 50th minute through the evaluation data of the comfort perception of different parts of the tights sportswear from 0 min to the 40th minute. In this study, the comfort perception evaluation data of T1P1, T4P4, T5P2, T2P3, and T3P1 tights sportswear are used as the testing samples, and the rest of the tights sportswear combinations are used as training samples, that is, the valid data of the training set are 20 groups, and the valid data of the testing set are five groups (i.e.T1P1, T4P4, T5P2, T2P3, and T3P1).
Normalize the data
In order to improve the convergence speed and prediction accuracy of the model, training data, and testing data are normalized to [0,1], and the calculation equation of normalized data is as follows
Comparison of prediction model results
In order to verify the accuracy of the prediction model proposed in this paper, LSTM, PSO-LSTM, CS-LSTM, and PSO-CS-LSTM model are selected for comparative experiments.
Figure 5 shows the comparison of the prediction effects of each model on comfort perception. As can be seen from Figure 5, although the LSTM, PSO-LSTM, CS-LSTM, and PSO-CS-LSTM all have similar curve trends to the real values, the difference between the predicted value of the PSO-CS-LSTM model and the real value is the smallest, the prediction curve is closer to the real value curve, and the fitting degree is higher, and the model is better than other prediction models. Comparison of prediction results of each model.
Model Error Analysis
In order to more accurately reflect the performance comparison between various models, measure the prediction effect of each model, and use quantitative methods to achieve the comparative analysis of prediction accuracy between models ,53–57 mean absolute error (MAE), root mean square error (RMSE), and mean absolute percentage error (MAPE) evaluation indicators are selected to measure the performance of each model in comfort perception prediction. The smaller the values of MAE, RMSE, and MAPE, the smaller the deviation between the prediction result and the real value, the more accurate the prediction result, and the better the effect of prediction model.
The specific calculation formula is as follows
Error of testing samples.

Mean value of errors for each model.
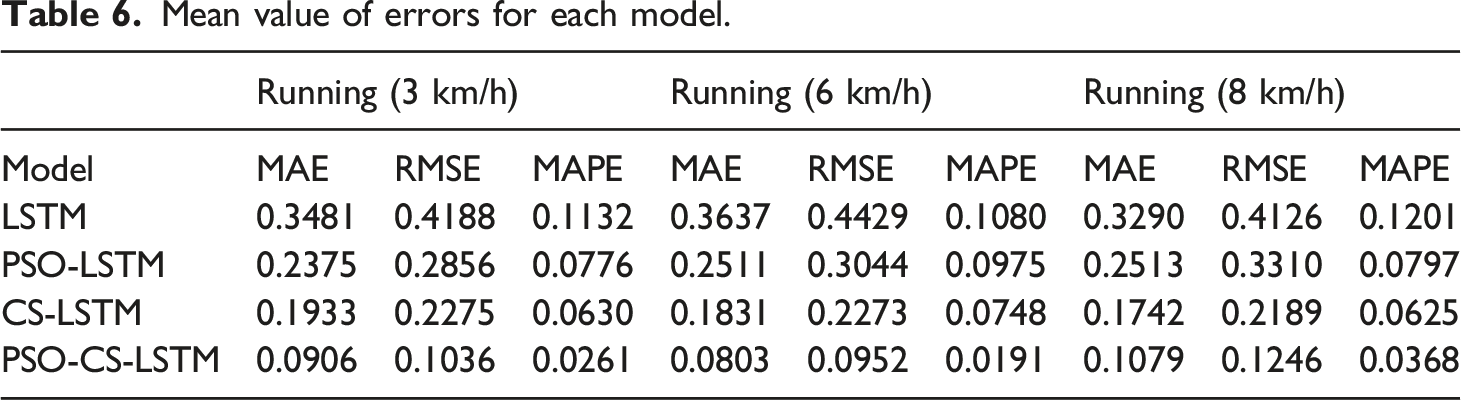
At 3 km/h, for LSTM model, its MAE mean is 0.3481, RSME mean is 0.4188, and MAPE mean is 0.1132. Compared with the LSTM model, PSO-LSTM model’s MAE mean is reduced by 0.1106, RSME mean is reduced by 0.1332, and MAPE mean is reduced by 0.0356; CS-LSTM model’s MAE mean decreases by 0.1548, RSME mean decreases by 0.1913, and MAPE means decreases by 0.0502; PSO-CS-LSTM model’s MAE mean decreases by 0.2575, RMSE mean decreases by 0.3152, and MAPE mean decreases by 0.0871. From the above data, MAE, RMSE, and MAPE of PSO-CS-LSTM have the largest reduction, which also shows that PSO-CS-LSTM has the best effect of optimizing LSTM. Therefore, compared with LSTM, PSO-LSTM, CS-LSTM, the PSO-CS-LSTM model has the highest prediction accuracy, followed by the CS-LSTM model.
At 6 km/h, for LSTM model, the average values of MAE, RSME, and MAPE of LSTM are 0.3637, 0.4429, and 0.1080, respectively; the average values of MAE, RSME and MAPE of the improved LSTM model based on PSO decrease by 0.1126, 0.1385, and 0.0105, respectively; the average values of MAE, RSME, and MAPE of the improved LSTM model based on CS decrease by 0.1806, 0.2156, and 0.0332, respectively; the average values of MAE, RSME and MAPE of the improved LSTM based on PSO-CS decrease by 0.2834, 0.3477, and 0.0889, respectively. Compared with MAE mean, it can be seen that the prediction accuracy of the PSO-CS-LSTM model is the highest, followed by the CS-LSTM model.
At 8 km/h, the average values of MAE, RSME and MAPE of LSTM model are 0.329, 0.4126, and 0.1201, respectively; the average values of MAE, RSME, and MAPE of the improved LSTM model based on PSO decrease by 0.0777, 0.0816, and 0.0404, respectively; the average values of MAE, RSME, and MAPE of the improved LSTM model based on CS decrease by 0.1548, 0.1937, and 0.0576, respectively; the average values of MAE, RSME, and MAPE of the improved LSTM based on PSO-CS decrease by 0.2211, 0.2880, and 0.0833, respectively. Compared with MAE mean, it can be seen that the prediction accuracy of the PSO-CS-LSTM model is the highest, followed by the CS-LSTM model.
In short, whether it is slow running, medium running or fast running, the average values of MAE, RSME, and MAPE of the LSTM model are higher than those of PSO-LSTM, CS-LSTM, and PSO-CS-LSTM, indicating that these optimized LSTM models can well reflect the trend of data changes. PSO, CS, and PSO-CS all improve the prediction accuracy of LSTM model, and the average values of MAE are all less than 0.3. Among them, the prediction curve of the PSO-CS-LSTM model is closer to the true comfort change, and the prediction results are more accurate than the LSTM model. At the same time, compared with LSTM, PSO-LSTM, CS-LSTM models, PSO-CS-LSTM has the lowest MAE mean, RSME mean and MAPE mean, indicating that compared with PSO, CS, PSO-CS could improve the time series prediction ability of LSTM better, and the prediction effect of the PSO-CS-LSTM model is the best, which verifies the effectiveness of the PSO-CS-LSTM model in improving the prediction accuracy of comfort perception in motion. It also shows that the PSO-CS-LSTM model is very suitable for the prediction of dynamic changes in comfort perception during running. Compared with the three optimization models, although the prediction error of LSTM is larger, its MAE mean is less than 0.4. For general time series problems, it is also a better choice,58–61 which also shows that LSTM is suitable for the prediction of comfort perception at different moments in the sports state.
Conclusion
This study proposes to analyze the dynamic changes of wearing comfort when running in winter tight sportswear, and it is found that the perception of wearing comfort changes over time. In addition, while analyzing the distribution characteristics and changing law of sports comfort, in order to improve the efficiency of clothing comfort research and reduce the research cost, and provide reference for the functional design and development of tights sportswear, a model suitable for analyzing the changes of wearing comfort in sports state was proposed, that is, PSO-CS algorithm optimizes long short-term memory neural network (LSTM). The conclusions are as follows: (1) Sports comfort perception reaches its peak in 40 min, and then falls back. It is found that thermal sense and humidity sense are the main perceptions that affect sports comfort, mainly occurring in bust, crotch and back, etc. Therefore, attention should be paid to the design of thermal-humidity function in these parts when designing tights sportswear. (2) LSTM model optimized by PSO or CS algorithm has improved the prediction effect of comfort perception in the exercise state to a certain extent. Using PSO or CS to optimize the important parameters of LSTM network can better solve the problem of parameter selection, significantly improve the ability of feature selection and reduce the influence of human factors. Both PSO and CS have improved the prediction accuracy of the model, but the LSTM model optimized by PSO and CS coupling algorithm has the highest prediction accuracy. It shows that PSO-CS coupling algorithm, compared with PSO, CS single algorithm, expands the global searching ability, could better overcome the state of falling into local optimum in the process of optimization, and greatly increases the efficiency of local optimization. (3) Compared with the PSO-LSTM, CS-LSTM, and LSTM model, the PSO-CS-LSTM model is more suitable for the prediction of comfortable perception time series in motion state, and effectively improves the prediction accuracy. In the face of complex motion comfort perception, PSO-CS-LSTM model can achieve faster and more accurate predictions. This model can more accurately predict the comfort perception in the next 10 min, providing a technical reference for analyzing and studying dynamic comfort changes.
Footnotes
Acknowledgements
This paper was financially supported by China Scholarship Council and Fujian Province Social Science Planning Project (FJ2020C049), and International Cooperation Fund of Science and Technology Commission of Shanghai Municipality(21130750100).
Declaration of conflicting interests
The author(s) declared no potential conflicts of interest with respect to the research, authorship, and/or publication of this article.
Funding
The author(s) received no financial support for the research, authorship, and/or publication of this article.