
Abstract
This study investigates the impact of movement speed on the overall comfort of tight-fitting sportswear, aiming to elucidate the dynamic mechanisms underlying comfort perception, temperature regulation, humidity levels, and pressure distribution. Utilizing a comfort evaluation system, this research examines both physiological and psychological changes at varying speeds while exploring the interplay among various comfort factors. The findings reveal that: (1) sensitivity to speed is particularly pronounced in the shank and thigh regions, where comfort levels can be easily modified; (2) movement speed significantly influences average pressure experienced on the back, hip, and shank areas—most notably affecting the shank and back; (3) temperatures in the back and thigh regions as well as leg humidity are affected by movement speed, with marked differences observed between slow, moderate, and fast movements. This research addresses a critical knowledge gap within this field and provides valuable insights for enhancing design practices related to tight-fitting sportswear. Furthermore, it offers guidance for the sports equipment industry in developing high-performance products tailored to athletes’ needs.
Introduction
With the popularity of global sports and the rise of fitness craze, the functionality and comfort of sportswear have become the focus of consumers and developers. Among them, tight-fitting sportswear is widely used in various sports scenes such as running, cycling and strength training because it can provide muscle support, reduce fatigue and improve sports performance.1–4 However, as a clothing category closely integrated with the human body, the dynamic response mechanism of its comprehensive comfort (thermal and moisture comfort, pressure comfort, and tactile comfort) under varying movement speeds has not yet been fully explored. A breakthrough in this scientific issue holds significant value for the design of high-performance sportswear. 5
In recent years, the research on the influence of tight-fitting sportswear on sports performance and comfort has made some progress. The research primarily focuses on the following three aspects: First, the optimization of thermal and moisture comfort. For instance, Dong et al. developed a regional ventilation structure using seamless weft knitting technology, which substantially enhanced thermal and moisture management efficiency in high-humidity environments. 6 Zhang et al. demonstrated that clothing looseness exhibits a nonlinear influence on moisture comfort during dynamic movement. 7 Second, the mechanism of pressure comfort, as exemplified by Liu et al., who uncovered the correlation between compression performance and physiological fatigue recovery. 8 Third, localized research on dynamic sports scenarios, such as Guo et al. optimized temperature and humidity control designs for high-intensity running pants, 9 and Cheng et al. predicted comfort perception distribution characteristics across different body parts at varying movement speeds using a deep learning model. 10 Notably, while the aforementioned studies provide a theoretical foundation for enhancing sportswear performance, their limitations are becoming increasingly apparent: on the one hand, most existing experiments are based on constant speeds or single movement modes (e.g., Sear et al., conducted an isolated analysis of intermittent high-intensity movement 11 ), making it challenging to reflect the compounded effects of continuous speed variations on comfort during actual movement; on the other hand, the research perspective is predominantly confined to a single dimension of comfort, lacking a comprehensive analysis of the multi-dimensional coupling among heat, moisture, pressure, and touch.
What is particularly critical is that movement speed, as the core variable influencing the intensity of human-clothing interaction, plays a pivotal role. Changes in this variable trigger two key effects: at the physiological level, the sweat secretion rate and the skin temperature-humidity gradient increase rapidly with the rise in speed12,13; at the psychological perception level, thermal and humid discomfort dominates at low speeds, while the local constraint caused by uneven pressure distribution becomes significantly more pronounced at high speeds. 14 Although Cheng et al. predict through their model that some body parts’ perception has a significant impact on dynamic comfort, their research lacks experimental data to validate the interaction mechanism of multi-dimensional parameters. 15 Additionally, the thermal and humid comfort evaluation method under the ISO standard system has yet to incorporate dynamic weight correction for the speed variable, thereby limiting the applicability of the existing evaluation paradigm in real sports scenarios. 16 Therefore, establishing a dynamic mapping relationship between movement speed and multi-dimensional comfort parameters and uncovering the multi-factor coupling mechanism have become the core pathways to overcoming the current technical bottleneck.
Based on this, through experiments and statistical analysis, this paper will examine the dynamic characteristics and dominant factors of comfort, pressure, temperature, and humidity at different movement speeds, revealing how comfort dynamically changes with time and speed from the perspective of movement speed. By leveraging multi-dimensional data interactive analysis, the correlation mechanism among different comfort dimensions is systematically explored, providing a new research paradigm for comprehensive comfort studies. Finally, this paper aims to refine the theoretical framework for tight sportswear comfort research, offering technical support and practical guidance for the sportswear industry to develop high-performance products tailored to multiple scenarios, thereby promoting technological advancement and market development in the field of sports equipment.
Methods
Experimental environment
The experiment was carried out in the climate room, with an temperature (20 ± 2)°C, a relative humidity (60 ± 5)%, and an average wind speed 1 m/s.
Subjects
According to the some relevant research, in the design of subjective experiment scheme, as long as the number of subjects is more than 8, enough subjective evaluation results can be obtained.17,18 Therefore, this study selected 10 men aged 19–24 as subjects. All subjects were healthy physically and psychologically, especially without skin diseases.
Meanwhile, some scholars have found that body shape differences (such as chest, hip, BMI values and other body shape parameters) can affect the comfort or thermal and moisture comfort of the human body when dressed, such as the feeling of constriction and heat.19,20 To reduce the impact of body shape differences on the comfort of tight-fitting sportswear, this paper will select subjects with similar body shapes. The average body size data of the subjects were (175.3 ± 0.6) cm in height, (45.6 ± 0.8) cm in total shoulder width, (52.9 ± 0.7) cm in middle thigh circumference, (93.9 ± 0.9) cm in chest circumference, (33.3 ± 1.4) cm in straight crotch length, (43.3 ± 0.5) cm in back length, (3.8 ± 0.2) cm in hip protrusion, (94.4 ± 0.9) cm in hip circumference, (33.7 ± 1.2) cm in hip width, (32.4 ± 0.8) cm in upper arm length, (21.5 ± 1.1)° in shoulder angle, (35.4 ± 0.9) cm in shank circumference, (47.6 ± 1.0) cm in thigh length, (79.0 ± 1.0) cm in waist circumference, (24.2 ± 1.2)° in back inclination angle, (11.8 ± 1.1)° in abdominal convex angle, (21.3 ± 0.9) in BMI.
Experimental tight-fitting sportswear
Parameters of tight-fitting sportswear fabric.

The tight-fitting tops and tight-fitting pants will be combined freely, and 10 subjects will wear all these combinations of tight-fitting tops and tight-fitting pants in turn.
Body parts for data acquisition
Figure 1 shows Back, Waist, Chest, Abdomen, Hip, Thigh and Shank which are designated as B1, B2, B3, B4, B5, B6, B7, respectively. These body parts are used for human body comfort perception evaluation and data acquisition of pressure, temperature, and humidity. Schematic diagram of data acquisition position.
Human body comfort evaluation scale
Evaluation of comfort perception and overall comfort.

In addition, this paper defines some comfort expression phrases, such as overall comfort, overall comfort perception, local comfort and local comfort perception. Overall comfort evaluation is based on human body (individual), while local comfort evaluation is based on a certain part of human body. Then, overall comfort means the whole comfort state of the human body, and the overall comfort is evaluated and scored according to very comfortable, relatively comfortable, generally comfortable, less comfortable and very uncomfortable; The overall comfort perception means the whole feeling of stuffy, sticky body, humidity, itching, restraint, rough and soft, that is, the overall evaluation of stuffy feeling, sticky body feeling and other feelings. Local comfort refers to the comfortable state of some body part, and local comfort is also evaluated and scored according to very comfortable, more comfortable, general comfortable, less comfortable and very uncomfortable, such as back comfort, which means that the comfortable state of the back is very comfortable, more comfortable or less comfortable, etc. Local comfort perception refers to the stuffy feeling, sticky body feeling, humidity feeling, itching feeling, restraint feeling, rough feeling and soft feeling of some body part, such as the stuffy feeling of the back and sticky body feeling of the chest.
Human local comfort evaluation consistency test
To ensure the consistency of human comfort evaluations, this project conducted a separate verification of the comfort assessments for each individual component and clothing combination. The Kendall correlation coefficient (KCC) was employed to determine whether the evaluation results from 10 subjects were consistent.21,22 The Kendall W coefficient, also referred to as the harmony coefficient, serves as a method for expressing the correlation among multiple columns of graded variables.
Consistency test of Kendall coefficient of every body part comfort.
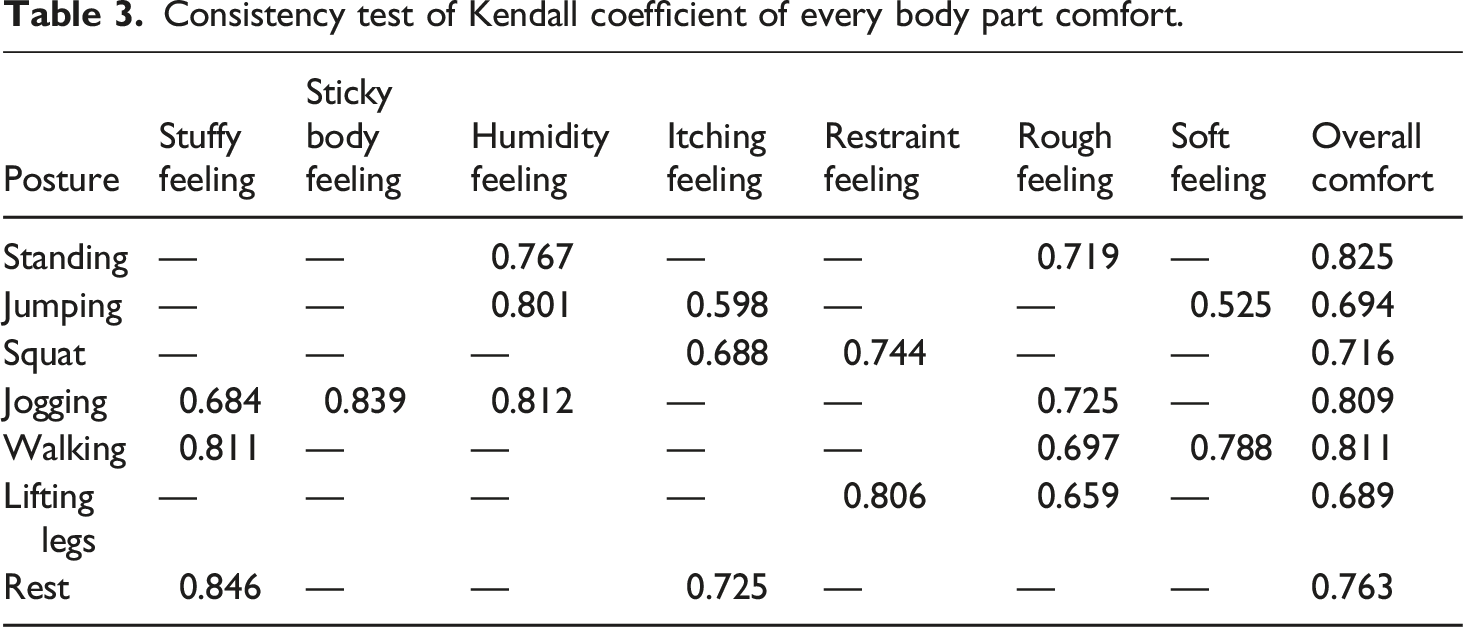
From Table 3, it can be seen that all subjects have high consistency in evaluating the local and overall comfort. Therefore, the local comfort value will use the average value of all participants.
Temperature-humidity-pressure data acquisition instrument
The data acquisition system is a multi-modal data acquisition system of temperature, humidity and pressure based on Arduino. The system is a simple, low-power measurement system that can obtain sports physiological parameter data and pressure data in real time, including temperature and humidity acquisition module and pressure acquisition module. The stability of the system has been confirmed by another literature.
23
The acquisition device is composed of FSR pressure sensor, DHT22 digital temperature and humidity sensor, 10kΩ resistor and Arduino 33 BLE, and is divided into two modules: sending module and receiving module. The sending module includes Arduino33 BLE, FSR pressure sensor, DHT22 digital temperature and humidity sensor, and 10kΩ resistor. The receiving module includes Arduino33 BLE, computer or mobile phone with Bluetooth function, as shown in Figure 2. Structure of temperature, humidity and pressure acquisition system.
While the FSR pressure sensor and DHT22 temperature and humidity sensor are collecting data, the Arduino Nano 33 BLE transmits the collected data to a receiving device such as a PC or mobile phone via Bluetooth. The transmitted data is displayed in real-time and automatically saved and visualized using Matlab, enabling a more intuitive understanding of the dynamic changes in pressure, temperature, and humidity. The sampling frequency is set at 0.5 Hz. Despite the high anti-interference capability of the employed sensors, noise may still be introduced during data collection, particularly when the device is in motion. To address this issue, the Kalman filter is selected based on the characteristics of the collected data to effectively denoise the pressure, temperature, and humidity measurements. This filtering technique not only facilitates real-time updates and analysis of the collected data but also enables the prediction of the state of a dynamic system from a sequence of noisy observations. 24
Movement scheme
Each subject wears all the experimental tight-fitting sportswear in turn and runs for 50 min on the running machine at the speed of 3 km/h (named as slow speed), 6 km/h (named as moderate speed) and 8 km/h (named as fast speed) respectively (refer to app running software such as Keep, Gudong, and Yuedong to count the average running speed and duration). At the same time, every 10 min, the comfort perception of the set part is subjectively evaluated, and each set of tight-fitting sportswear shares a subjective evaluation questionnaire; In order to fully study the dynamic changes of comfort perception, pressure, temperature and humidity, the whole movement process is divided into several stages, and every 10 min is recorded as a stage of movement, that is, the 10th minute before movement (0th min–10th min) is recorded as warm-up; The first 10 min of movement (10th min–20th min) is marked as step 2-1; The second 10 min of movement (20th min-30th min) is marked as step2-2; The third 10 min of movement (30th min–40th min) is marked as step 2-3; The fourth 10 min of movement (40th min–50th min) is marked as step 2–4; The fifth 10 min of movement (50th min–60th min) is marked as step 2-5; Take a rest for 10 min after the movement, and record it as step3.
Results and discussion
Influence of movement speed on local comfort perception and local comfort
At different movement speeds, the comfort perception of the same part may be different, for example, at 3 km/h, in Step2-1, the main perception of back is rough (the evaluation value is 3.8) and the main perception of chest is rough (the evaluation value is 3.5); the main perception of abdomen is soft feeling (evaluation value is 1.6), however, in the state of 6 km/h movement, the main perception of back: restraint feeling (evaluation value is 2.8); the main perception of chest is rough feeling (evaluation value is 3.1); the main perception of abdomen is stuffy feeling (evaluation value is 2.0). The perception of the same part may be different, even if it is the same, the evaluation value may be different. Therefore, when studying related research, we should fully consider the selection of speed.
To sum up the influence of movement speed on the comfort of tight-fitting sportswear. It is found that there is a time difference between the humidity reaching the wettest state and the humidity feeling reaching the maximum value in 6 km/h and 8 km/h movement states (that is, the change of humidity feeling lags behind the change of humidity), but in 3 km/h state, the time for the humidity feeling reaching the maximum value and the humidity reaching the maximum value are close, which indicates that the movement speed affects the synchronization between perception and physiological indexes. The speed of movement has a certain effect on the comfort of some parts or the overall comfort. For example, the main comfort perception of the abdomen in Step2-2 is soft feeling in the state of 3 km/h movement, and the main comfort perception of the abdomen in Step2-2 in the state of 6 km/h movement is restraint feeling; At 6 km/h, the main comfort perception of the hips in Step2–4 is restraint feeling, and at 8 km/h, the main comfort perception of the hip in Step2–4 is stuffy feeling. However, it has little effect on some parts, for example, the main perception of the back and chest at the stages of 3 km/h, 6 km/h and 8 km/h in Step2-3 and Step2–4 is humidity feeling. After the Step2–4 movement stage, until the end of the movement, the main perception that affects the upper body comfort is the feeling of humidity or sticky body. And it can be seen from results analysis that the change of movement speed has little influence on the main comfort perception of the shank. The change of local comfort perception affects local comfort, and the change of local comfort with the level of movement (that is, movement speed) also directly reflects the change of local comfort. The variation of local comfort with movement speed is shown in Figure 3. The overall comfort of each part changes with the movement speed.
Fluctuations (variance) of overall comfort of different body parts at different movement levels.

Influence of movement speed on overall comfort of various body parts.

Note. *means p < 0.05; **means p < 0.01.
Multiple comparison results of movement speed on overall comfort evaluation of various body parts.

Note. *means p < 0.05; **means p < 0.01.
Through multiple comparative analysis, it is found that there is no significant difference between 6 km/h (moderate movement) and 8 km/h (fast movement) in back comfort. Waist comfort is only significantly different between 6 km/h and 8 km/h; There is no significant difference in chest comfort between 3 km/h (slow movement) and 8 km/h; Abdominal comfort is only significantly different between 3 km/h and 8 km/h; There is no significant difference between 3 km/h and 8 km/h in hip; There are significant differences between shank and thigh in three kinds of movement speeds, which shows that shank and thigh are sensitive to movement speed, that is, with the increase of movement speed, the comfort of shank and thigh is easy to change. In short, the comfort of different parts will be affected by the change of movement speed.
Based on the analysis of experimental results, it can be inferred that the driving mechanism of comfort change may be related to the heat generated during movement, the evaporation rate of sweat and the friction between clothes and skin. With the increase of movement speed, the heat generated by the body increases, and the secretion of sweat also increases, which may lead to the increase of friction between clothes and skin, thus affecting comfort. In addition, the increase of movement speed may also lead to changes in the tightness of clothes, which in turn affects the comfort of the wearer. The results of this study are consistent with the findings of existing studies on the influence of sports speed on clothing comfort, that is, the increase of sports speed will significantly affect the comfort of the wearer. At the same time, the experimental results show that sportswear designers should pay special attention to the comfort design of calves and thighs. The research results of this part provide a scientific basis for sportswear design. It is suggested that the influence of sports speed on comfort should be considered when designing sportswear, and the pressure distribution and material characteristics of clothing should be adjusted according to the needs of different movement intensities.
Influence of movement speed on pressure, temperature and humidity
At present, there are some differences in the research on the pressure comfort threshold of each part. Many scholars have different views on the pressure comfort threshold. Makabe et al. analyzed the pressure feeling of tight-fitting sportswear, and obtained that the pressure range of waist discomfort is 0–1.47 kPa, slight discomfort is 1.47–2.46 kPa, and extremely uncomfortable pressure is over 2.46 kPa. 25 Some researchers have respectively obtained the pressure comfort thresholds of chest, back, waist, abdomen and buttocks of 0.64–1.04 kPa, 0.40–0.53 kPa, 0.14–0.31 kPa, 0.65–0.83 kPa and 0.62–0.83 kPa.26–28 Some scholars believe that the comfortable pressure in the movement state is 0.49–2.6 kPa, and the comfortable pressure in the static state is 0.14–1.19 kPa. 29 Wang used self-made pressure equipment to analyze the pressure comfort value of key parts of human body, and obtained that the comfort pressure of abdomen is 2.75 kPa, the comfort pressure of waist is 1.28 kPa, the comfort pressure of abdomen is 1.26 kPa, and the comfort pressure of chest is 0.94 kPa. 30 Wang and Yao think that the comfortable pressure in general movement state is 0.49-2.6 kPa, but in strenuous movement, the pressure comfort value in some parts must be increased by 1.96 kPa. 31 Senthilkumar et al. found that the comfort pressure of calf is 1.87 kPa, and that of thigh is 1.07–1.33 kPa. 32 In this study, according to the subjective evaluation and pressure measurement data of the pressure sense (that is, the sense of restraint) of the subjects wearing all the combined tight-fitting sportswear, the pressure threshold of the sense of restraint in different movement states is defined.
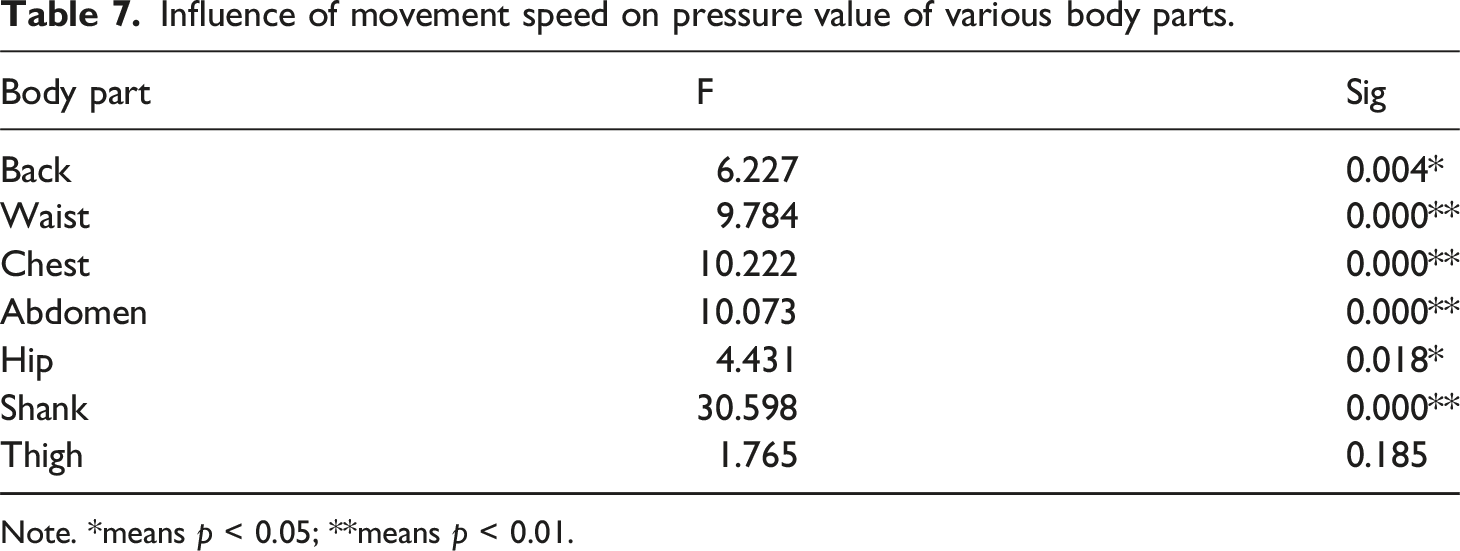
The pressure of hip and shank increases with the increase of movement speed, while the pressure of thigh is less affected by movement level (speed). At the speed of 3 km/h, 6 km/h and 8 km/h, the average pressure of thigh, chest, abdomen and waist at different speeds is close, and the average pressure of hip at 3 km/h is smaller than that at 6 km/h and 8 km/h.
Influence of movement speed on pressure value of various body parts.
Note. *means p < 0.05; **means p < 0.01.
As can be seen from Table 7, the speed of movement has a certain influence on the average pressure of the back, hip and shank, especially the average pressure of the shank and back is greatly influenced by the level of movement. Although the average pressure of waist, abdomen and chest is small, the speed of movement still affects their pressure. In order to clearly analyze the significant differences between the moving speeds of the pressure in each part, the LSD method is used to analyze the pressure differences between the speeds.
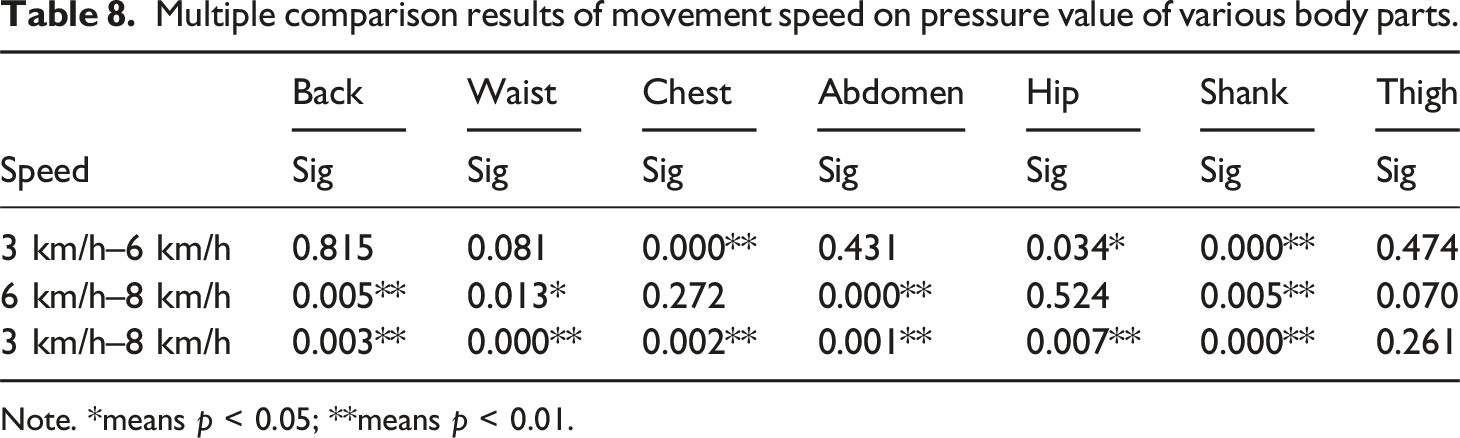
Multiple comparison results of movement speed on pressure value of various body parts.
Note. *means p < 0.05; **means p < 0.01.
Based on the analysis of experimental results, the design of tight-fitting sportswear should consider the influence of movement speed on body pressure, especially in the shank, which should be made of elastic materials to reduce the pressure caused by movement. At the same time, the design of waist, chest, abdomen and hip should pay attention to support and comfort to meet the needs of different movement speeds.
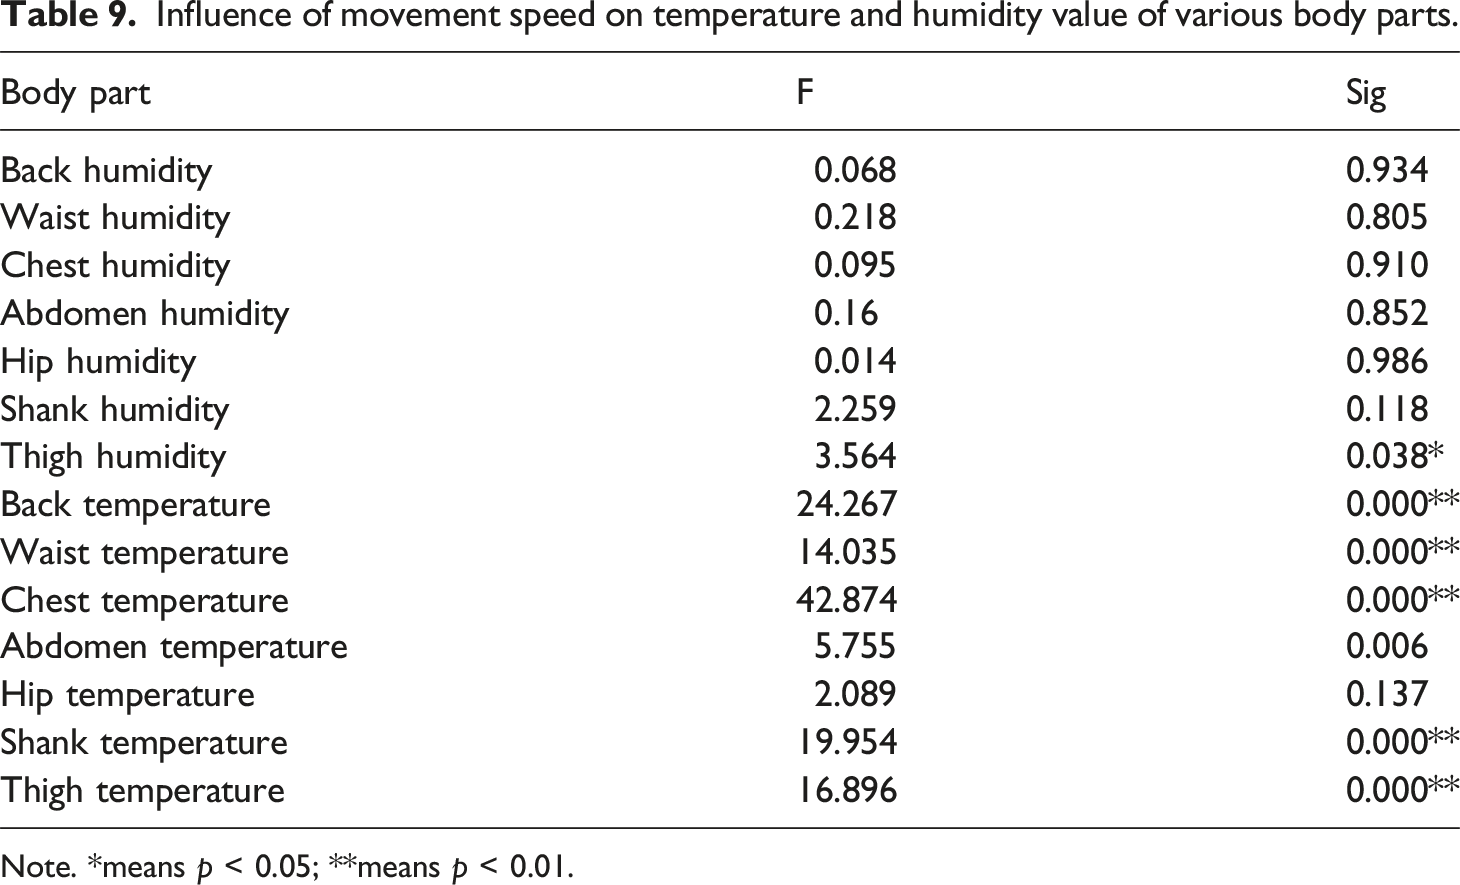
Influence of movement speed on temperature and humidity value of various body parts.
Note. *means p < 0.05; **means p < 0.01.
Through the analysis in Table 9, it is found that the speed has no significant influence on the humidity of the back and chest, which may be because these two parts have a large amount of sweating, and they reach the wettest state in a short time regardless of the speed, so the movement speed has no significant influence on them. The movement speed only has a significant influence on the thigh humidity, which also shows that there are certain differences in the humidity change of the thigh under different movement speeds, while the humidity change of other parts is less different under the three movement speeds. The movement speed has a significant influence on the temperature of most parts, except the temperature of the buttocks, which shows that the change difference of the buttocks is not very prominent under the three movement speed States.
Multiple comparison results of movement speed on temperature and humidity value of various body parts.

Note. *means p < 0.05; ** means p < 0.01; humi means humidity; temp means temperature.
According to the results of multiple tests, there are significant differences in the temperature of back and thigh among the three kinds of movement speeds, which means that the temperature of these two parts is easily affected by the change of movement speed; There are significant differences in the temperature of waist, chest and shank between slow and moderate movement, slow and fast movement; There are significant differences in abdominal temperature between moderate and fast movement, slow and fast movement; There is no significant difference in hip temperature among the three speeds, which shows that the change of hip temperature movement speed has little influence; There are significant differences in thigh humidity between slow and moderate movement, slow and rapid movement.
Based on the analysis of experimental results, it is found that the temperature of back and thigh increases significantly with the increase of movement speed, which is related to the increase of high-intensity muscle activity and heat production in these parts. There are significant differences in the temperature of waist, chest, calf and abdomen at different movement speeds, which may be affected by blood flow and muscle activity. In contrast, the hip temperature is less affected by the speed of movement, which may be due to less muscle activity or uniform thermal insulation of clothes. In addition, the thigh humidity changes significantly with the increase of movement speed, which is related to the increase of sweating amount and the moisture absorption and perspiration performance of clothes. These findings are consistent with the existing research, emphasizing the need to pay special attention to the temperature and humidity management of back, thigh, waist, chest and calf in sportswear design.
This study analyzed the changes of comfort, temperature, humidity and pressure of tight-fitting sportswear under different movement speeds, and found that the movement speed has obvious influence on the comfort of all parts, and has significant influence on the temperature, humidity and pressure of all parts in different degrees. In short, the dynamic response of comfort and its related factors (temperature, humidity and pressure) to different movement intensities was discussed, so when designing tight-fitting sportswear, the influence of movement speed on the comfort of tight-fitting sportswear should be considered, that is, when designing tight-fitting sportswear, designers should In addition, there is a certain interaction between the perception of the upper body and the lower body, and the interaction between perceptions will also have a certain impact on the evaluation of perception.
Clothing pressure is one of the most important clothing comfort parameters, because it will affect the physiological and psychological reactions. However, because this study takes the tight-fitting tops and tight-fitting pants as a whole to affect the sports comfort, the threshold of clothing pressure (restraint) felt by the wearer may be different from the previous research results. The subjective and objective data of 3 km/h, 6 km/h and 8 km/h are comprehensively analyzed, and finally the average pressure range corresponding to the sense of restraint in each part is obtained: the thigh is moderately constrained, with a range of 0.50–0.53 kPa; the shank exhibits slight restraint, with a range of 0.55–1.04 kPa; and the chest displays mild restriction, with a range of 0.13–0.27 kPa; the back is slightly restrained with values ranging from 0.19 to 0.31 kPa; the hip shows slight restraint within the range of 0.76–1.25 kPa; the shank is general restrained with values ranging from 1.21 to 1.37 kPa; the thigh is general restrained with values ranging from 0.61 to 0.90 kPa; the chest is general restrained with values ranging from 0.28 to 0.37 kPa; the hip is general restrained with values ranging from 1.32 to 1.55 kPa; the back is general restrained with values ranging from 0.31 to 0.36 kPa; the thigh is restrained with values ranging from 1.31 to 1.52 kPa; the shank is restrained with values ranging from 1.61 to 2.13 kPa. The perception threshold of different parts in the state of motion is different. There are some differences between the pressure comfort threshold of the main parts measured by the existing related research, the reasons are: (1) the gender, body shape and stress tolerance of the subjects are different; (2) the measuring instruments and methods used in the test are different; (3) the sample clothes used are different.
Conclusion
Through innovative experimental design and detailed data analysis, this study comprehensively compares the changing laws and influencing factors of pressure, temperature and humidity under different speed conditions, which provides a solid theoretical support for the research and application in related fields and draws the following conclusions: (1) Through multiple comparative analysis, it is concluded that the comfort of different parts will be affected by the change of movement speed. For example, the waist comfort is significantly different between 6 km/h and 8 km/h, the abdominal comfort is significantly different between 3 km/h and 8 km/h, and the shank and thigh are significantly different among the three sports speeds, indicating that the shank and thigh are sensitive to the sports speed, that is, with the increase of sports speed, the comfort of the shank and thigh is easy to change. This study further refines the comfort changes of different parts and provides more specific guidance for sportswear design. Based on the research results, sportswear designers should pay special attention to the comfort design of some parts. In the design, materials with better air permeability and stronger moisture absorption and perspiration function can be considered to reduce the influence of heat and sweat generated during movement on comfort. At the same time, we can improve the comfort of the wearer by adjusting the tightness and friction of the clothes. In addition, according to different sports speeds, designers can develop different styles of sportswear to meet the comfort needs of wearers under different sports intensities. (2) By analyzing the influence of the movement speed on the local pressure, it is concluded that only the pressure of the shank is significantly different among the three speeds, that is, the movement speed easily affects the pressure of the shank; There is no significant difference in back pressure between slow movement and moderate movement. There are significant differences in waist pressure between moderate and fast movement, slow and fast movement, especially between slow and fast movement. There is a significant difference in chest pressure between slow and moderate movement and between slow and fast movement. There are significant differences in abdominal pressure between moderate and fast, slow and fast movements; There are significant differences in hip pressure between slow and moderate movement and between slow and fast movement. At the same time, the distribution law and reasons of pressure comfort threshold are analyzed, and a brand-new method for measuring and calculating the pressure comfort threshold of clothing is explored, and the pressure comfort threshold distribution of key parts of male body at different sports speeds is obtained. This research results will help to establish a relatively perfect comfort evaluation system for pressure clothing, and provide some theoretical reference for the design and production of related products. (3) By analyzing the influence of movement speed on temperature and humidity, it is known that the temperature of back and thigh is significantly different among the three movement speeds, which means that the temperature of these two parts is easily affected by the change of movement speed; There are significant differences in the temperature of waist, chest and shank between slow and moderate movement, slow and fast movement; There are significant differences in abdominal temperature between moderate and fast movement, slow and fast movement; There is no significant difference in hip temperature among the three speeds, which shows that the change of hip temperature movement speed has little influence; There are significant differences in thigh humidity between slow and moderate movement, slow and rapid movement. This means that designers should choose materials with good air permeability and strong moisture absorption and perspiration function, and consider adding air holes or using mesh materials in these key parts to improve air circulation and sweat evaporation. These design improvements are helpful to meet the requirements of temperature and humidity adjustment at different sports speeds, and improve the sports performance and comfort of the wearer.
In a word, the results of this study have important practical significance for sportswear design, the speed of movement should be considered when designing tight-fitting sportswear, to improve the comfort of sportswear.
Future research can further explore the influence of different sportswear materials on temperature and humidity. For example, materials with different air permeability and moisture absorption and perspiration performance can be tested to determine which material can provide the best comfort at different moving speeds. And consider different environmental conditions, such as high temperature and high humidity or low temperature and low humidity, to evaluate the performance of sportswear in various climatic conditions. These research directions will help to fully understand the influence of sports speed on the comfort of sportswear, and provide more scientific basis for the design and material selection of sportswear.
Footnotes
Ethical statement
Funding
The author disclosed receipt of the following financial support for the research, authorship, and/or publication of this article: The authors would like to acknowledge the financial support from Supported by Scientific Research Foundation, Zhejiang Sci-Tech University (No. 24072193-Y), Zhejiang Provincial Department of Education General Scientific Research Project (No. Y202454304).
Declaration of conflicting interests
The author declared no potential conflicts of interest with respect to the research, authorship, and/or publication of this article.