
Abstract
In order to study the influence of human body parts on the overall comfort under different sports conditions, this paper designed a series of actions such as standing, squatting, running, walking, and so on, and obtained the key parts that affected the overall comfort at every experimental stage (i.e. every motion state) through subjective evaluation. That is, to study and analyze the comfort evaluation of every part and the whole body under different motions conditions, as well as the main parts that affect the overall comfort. In this paper, Analytic Hierarchy Process-Entropy weight, Fuzzy-Rough Set Theory, Analytic Hierarchy Process-Structural Equation Model, and Particle Swarm Optimization-Cuckoo Search were used to optimize the position index. At last, the prediction model of overall comfort was established by Adaptive Network-based Fuzzy Influence System. The input parameters are body part indexes screened by Analytic Hierarchy Process-Entropy weight, Fuzzy-Rough Set Theory, Analytic Hierarchy Process-Structural Equation Model and Particle Swarm Optimization-Cuckoo Search, respectively. And the output is the overall comfort evaluation value. Compared with the real value of overall comfort in every experimental stage, the effectiveness of Analytic Hierarchy Process-Entropy weight, Fuzzy-Rough Set Theory, Analytic Hierarchy Process-Structural Equation Model, and Particle Swarm Optimization-Cuckoo Search optimizing indexes is verified. The results show that: (1) About index optimization models, Particle Swarm Optimization-Cuckoo Search and Analytic Hierarchy Process-Entropy weight are better than Fuzzy-Rough Set Theory, so both Particle Swarm Optimization-Cuckoo Search and Analytic Hierarchy Process-Entropy weight could optimize index predicting overall comfort. (2) Different movements have great differences in the parts that affect the overall comfort.
Introduction
The comfort evaluation of sportswear has always been a hotspot in the study of clothing comfort. It is a result of the harmonious interaction between human physiological and psychological factors and sportswear under motion conditions. However, the research on the comfort of sportswear mainly focuses on the analysis of the physical and basic properties of clothing fabric, clothing esthetics, environment conditions, and other objective factors. With the in-depth study of the relationship between clothing and human beings, the research on wearable comfort including psychological and physical comfort, has become more and more important, and people have begun to pay attention to comfort perception that researchers rarely get involved in. Comfort is a subjective reflection of the human body. Only when the physiological, psychological, and physical factors interact in a satisfactory manner can a comfortable state be achieved. The physiological reaction of human body is the objective reaction of human body to external conditions in order to achieve a steady state, but the objective response may not truly reflect people’s subjective feelings, or there are some differences between subjective and objective responses of the human body to external conditions. Human feelings cannot be measured and can only be judged by observing related reactions. The comfort sensory of the human body and the psychological feeling of dressing are the main evaluation indexes describing the psychological reaction of human body. Hu et al. 1 compared the objective measurements with subjective perceptions of moisture sensations during exercise, the results shows there existed a significant correlation between them. Grujic and Geršak 2 designed an experiment that subjects wore two different models of summer clothing (women’s dresses and women’s blouse plus shorts) made from different raw materials, they found that there is a relationship between subjective assessment of wearing comfort and physiological parameters (mean skin temperature, skin relative humidity, amount excreted in sweat absorbed in clothing). Suganthi and Senthilkumar 3 conducted a wear trial for shuttle badminton players and they were ranked using thermal environment subjective judgment scale. Tadesse et al. 4 used subjective evaluation technique for assessing the tactile comfort of some functional textile fabrics. Lee et al. 5 evaluated the effect of the fabric for Bikram yoga clothing and fit measured in clothing pressure on the wearer’s physiological response and perceptive sensation before and after exercise in hot conditions and during a resting period in standard conditions. They found that the feeling of comfort was different between before yoga and after resting. Teyeme et al. 6 developed a questionnaire to evaluate the wear comfort of cycling outfits and address various key aspects such as tactile sensation, garment fit with reference to size, garment esthetics (style and shape), comfort (before, during, and after wearing) and overall satisfaction. The results show that the sensorial comfort was mainly correlated with fabric properties, fit and moisture sensation, and the thermophysiological comfort was affected by the fabric properties, the test environment conditions and level of activity. Wang et al. 7 examined the effects of the clothing insulation distribution between half-bodies by Fanger’s predicted mean vote model. The results indicated that different distribution index lead different subjective thermal evaluations. Although many scholars have studied and analyzed the evaluation of human body comfort mainly by subjective evaluation method of comfort, most of them only used simple questionnaire to directly ask the subjects about their thermal comfort or pressure comfort after exercise, and then took the evaluation value after exercise or the average value of all motion state evaluations as the basis of the whole movement comfort evaluation.
Sportswear affects the proprioception and changes the movement action, thus optimizing the technical action is very important. Doan et al. 8 proposed how custom-fit compression shorts affect athletic performance and to examine the mechanical properties of the shorts. Shimana et al. 9 developed a new method for designing compression sportswear from the viewpoint of force which effect of these forces on physical exercise. Britto et al. 10 analyzed the influence of a compressive garment on knee valgus during landing, they found the compressive garment decreased knee flexion and knee valgus range of motion. Zamporri and Aguinaldo 11 designed compression garments to prevent knee injuries by inducing changes in jumping mechanics. Silina et al. 12 Pointed out coverage of close-fit garments can affect the athlete’s range of motion and hinder to reach the peak of athletic achievement, so they proposed sportswear should preserve athletes ergonomic and pressure comfort. Maleki et al. 13 discussed the effect of fabric tensile property and garment size on the clothing pressure variation, and analyzed the pressure alteration during the body movement with various ranges. Wang 14 studied the wearing comfort of elastic tights in riding state, measured the objective pressure and subjective comfort evaluation of key parts, combined with the skin stretch in riding state, and finally optimized its pattern. Therefore, the main concern of the comfort of sportswear should be motion comfort. Different sports intensity will produce different sports loads on the human body. In order to achieve the steady state of the body, the human body will have different physiological and psychological reactions, which are not limited to pressure or thermal-moisture or tactile comfort, but the comprehensive sensory comfort of the three or the two, namely pressure comfort, tactile comfort and thermal-moisture comfort. Therefore, for motion comfort, we should not only study one kind of comfort, because there will be different perceptions in the process of sports, in order to study motion comfort more comprehensively, this paper directly takes wearable comfort as the research object, and does not specify a certain kind of comfort. In addition, the comfort caused by different motion loads is quite different. The comfort evaluation values in different movements states should not be simply averaged as the basis for the comfort evaluation of the entire motion state. The comfort in every motion state should be evaluated and analyzed. Moreover, the human body is a complex system, and there are some differences in perception and reaction to different motion loads among different parts. Therefore, specific research is needed, that is, to analyze the comfort of different parts. Only by understanding the comfort state of different parts in every motion state can we better design tight-fitting sportswear, ensure the wearable comfort during movement and improve sports performance. In a word, the overall comfort of the human body will be affected by the comfort of every part of the human body during the movement of the human body, so it is very necessary to study the local comfort and the overall comfort of the human body. The research on the comfort of tight-fitting sportswear mostly focuses on the research of overall comfort, and there are few researches on the local comfort, as well as the research on the relationship between local comfort and overall comfort. Most of the existing researches on subjective comfort take dynamic comfort as a whole, but the influencing factors are different in different motion states, so it is unreasonable to study movements comfort as a whole. In order to study the influencing factors of overall comfort in every movement state, this paper adopts Analytic Hierarchy Process-Entropy weight, Fuzzy-Rough Set Theory, Analytic Hierarchy Process-Structural Equation Model (AHP-SEM), Particle Swarm Optimization-Cuckoo Search (PSO-CS) to optimize the influencing index of overall comfort in every dynamic state, and then verify Adaptive Network-based Fuzzy Influence System (ANFIS) model to obtain the best model of index optimization. This research will provide a more accurate design basis for the comfort of tight-fitting sportswear and favorable technical guidance for maximizing motion comfort, proposes a new research method and theory for improving the quality of tight-fitting sportswear, which is perfect to a certain extent evaluation standard for comfort of tight-fitting sportswear.
Experiment
Selection and training of subjects
Eight healthy young men with similar age, size, and hobbies were selected. They all have long-term running experience, were all graduate students majoring in clothing and have sufficient knowledge of ergonomics. They were taken to the climate room for temperature, humidity, and pressure sensitivity tests. More details are as follows.
The room temperature of the climate chamber can be controlled between −5°C and 42°C with an accuracy ±0.5°C. The relative humidity of the room can be controlled between 10% and 85% with an accuracy ±5%.
Without being informed of the temperature and humidity of the environment, and under the control of the laboratory teacher in charge of the experiment, the temperature will increase or decrease by 2°C every 10 min under the condition that other climatic parameters such as humidity and windy speed which are unchanged, because every 1°C increase in air temperature, the average temperature of human skin will increase by 0.3246°C, 15 while the temperature of human skin will change by 2°C, and the thermal sensation of human body will change by at least one division. 16 And ask every subject about their feelings and eliminate those who are insensitive to temperature. And then, under the condition that other climate chamber parameters such as temperature and windy speed which are unchanged, increase or decrease humidity of the climate chamber, ask everyone’s feelings, eliminate subjects who are not sensitive to humidity. And finally carry out pressure sensitivity testing on the remaining subjects.
At first, we measured the upper arm circumference of the remaining subjects in turn, and sewed three simple upper arm sleeves (their dimensions are the average upper arm circumference subtract 1, subtract 2, and subtract 3, respectively) for every subject with knitted fabric with good elasticity (see Figure 1). The subjects put these sleeves on their upper arms in turn, and do some arm lifting and bending actions to test their sensitivity to pressure. After the test, the remaining five subjects in total were the participants of the whole experiment.

Upper arm sleeve.
During the temperature, humidity, and pressure sensitivity tests, in order to avoid the influence of other people’s answers to environmental changes (herd effect), to ensure that when a certain subject answers to environmental climate changes, the non-respondents can’t hear it, everyone should wear earplugs, and then ask everyone in turn.
And five young men (named M1, M2,. . .M5) were selected as participants in this experiment. See Table 1 for their body shape parameters.
Subjects’ body parameters.
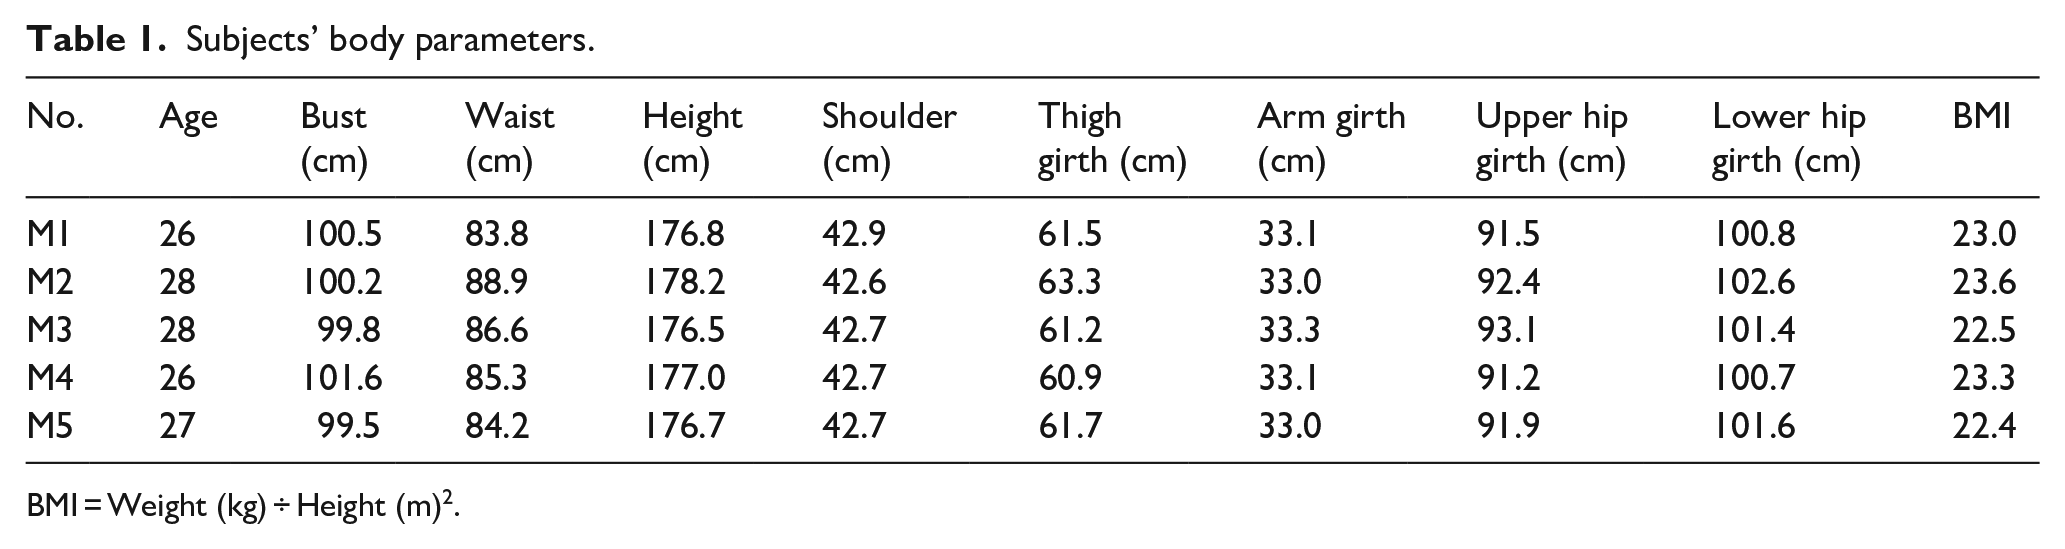
BMI = Weight (kg) ÷ Height (m) 2 .
Experimental clothing
According to the average body size of five subjects, three tight tops (T1, T2, T3) and three tight trousers (P1, P2, P3) were purchased from Decathlon store (All tops’ styles are the same or similar and all trousers’ styles are the same or similar, the specific information of tops and trousers are all shown in Table 2). Tops and trousers should be freely combined for trying-on, there are a total of nine sets of combined tights, which were labeled T1P1, T2P2, T3P3, T1P2, T2P3, T3P1, T1P3, T2P1, T3P2. During the whole experiment, five subjects wore nine sets of combined experimental tights in turn, so there were 45 questionnaires in total. And until every subject tried on all tight-fitting combinations (tops + trousers) in turn, wearing trials can be finished. The experiment take us nearly 8 days in total to finish testing.
Fabric parameters of tights.

Experimental environment and requirements
(1) The simulation experiment was carried out in a climate room, with an average temperature of 5.1°C, a humidity of 78% and an average wind speed of 19.1 km/h (realized by a high-power electric fan).
(2) Before participating in the experiment, the subjects must keep a good mood and emotion.
(3) Before the experiment, ensure that all experimental tights are restored to their original state and placed in the climate room for 24 h.
(4) Testers randomly select and try them on in turn without being told about the fabric of tights.
(5) Before the experiment, all subjects were given a unified explanation of the questionnaire, so as to ensure that all subjects have the same understanding of the questionnaire content and scale, and eliminate the systematic error of the experiment as much as possible.
Experimental content
The whole test process is divided into eight test stages, specifically as follows: preparing (20 min, adapt to the testing environment) → standing (10 min) → jumping (10 min) → squat (10 min) → squat down (10 min, 1 min as a group, rest 0.5 min after a group) → jogging (10 min, average speed: 5.5 km/h) → walking (10 min, average speed: 4.3 km/h) → lifting legs (10 min, left and right legs are raised alternately, 1 min as a group, rest 0.5 min after a group) → rest (10 min) → experiment end. Among them, during the standing process, the subjects all have limb movements, such as bending over, lifting their arms horizontally, lifting their arms vertically and lifting their arms laterally by 45°. At the end of every test phase, the staff shall record the subjective comfort evaluation value of every part and the whole.
By summing up the existing research and the authors’ research experience, this paper regards the shoulder, armpit, bust, back, back waist, body side, upper arm (inside and outside upper arm), elbow, forearm (inside and outside forearm), hip, thigh (inside thigh, outside thigh, back thigh), knee, shank, abdomen, and crotch as the initial evaluation parts of local comfort.17–23
Evaluation scale
Comfort types of every part and overall comfort is evaluated subjectively according to ISO 10551-2001 “Ergonomics of Thermal Environment Assessing the Influence of Thermal Environment by Subjective Judgment Scale,” which means very comfortable, comfortable, normal, uncomfortable, and extremely uncomfortable, as shown in Figure 2.
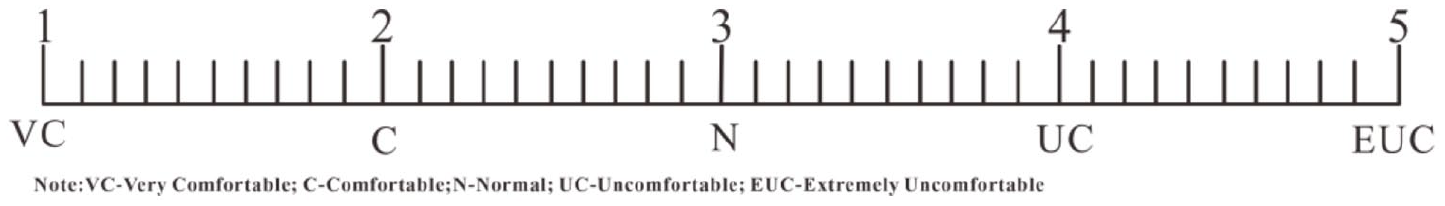
Comfort evaluation scale.
Comfort data collection
The comfort of shoulder, armpit, bust, back, back waist, abdomen, body side, hip, crotch, inside upper arm, outside upper arm, elbow, inside forearm, outside forearm, inside thigh, outside thigh, back thigh, knee, shank are recorded as BM1, BM2,. . ., BM19, overall comfort is recorded as OM. Because there are 45 questionnaires in total, this paper only takes the comfort evaluation of M3 trying on T2P1 as an example, as shown in Table 3.
Comfort evaluation of M3 trying on T2P1.

The comfort evaluation data of 45 questionnaires form the original data matrix according to the experimental stage, which are as follows: (Sstanding)45×20, (Sjumping)45×20, (Ssquat)45×20, (Ssquat down)45×20, (Sjogging)45×20, (Swalking)45×20, (Slifting legs)45×20, (Srest)45×20. For example, the data matrix of comfort and overall comfort evaluation of every part in the standing state (Sstanding)45×20:

Where, (Sstanding)45×20 indicates the evaluation data matrix of every part and overall comfort when all subjects wear nine sets of combined experimental tights in turn when indicating the standing state;
Modeling
When evaluating tights, most people choose as many comfort-related indicators as possible. However, this approach can easily lead to the complexity of the evaluation process, and even affect the evaluation results of comfort. Because some indicators have little contribution to the evaluation of comfort, in order to make the evaluation results comprehensive and accurate, it is necessary to reduce the indicators that have little impact on the evaluation results before the comfort evaluation, that is, dimensionality reduction. In this paper, AHP-Entropy weight, Fuzzy-Rough Set Theory, AHP-SEM, PSO-CS were used to optimize the part indexes, and then their optimized indexes are used as input parameters, and then the ANFIS model was used to predict the comfort of every experimental stage. In finally, by comparing comfort prediction values with the real values of the comfort, the better index optimization model and the best prediction indexes are found out.
Index preprocessing
Before using AHP-Entropy weight, Fuzzy-Rough Set Theory, AHP-SEM, PSO-CS to optimize the position index, the index dimension should be reduced, in order to eliminate redundant indexes and improve the accuracy of prediction results. Because the establishment of a good index system is the key to evaluate the comfort of tight-fitting sportswear, the index system in this paper is based on the subjective evaluation when subjects wear it. Although these evaluations can effectively use the actual meaning of the indicators, they cause the problems of redundant information content and weak discrimination ability when screening the indicators. Therefore, the complicated index layer (i.e. secondary indexes, index of every part of the human body) is simplified, and a small number of effective indexes are used to predict the overall comfort behavior, at the same time, the difficulty of subjective evaluation will be reduced.
Index dimension reduction
Sum of Squares of Deviations is used for R clustering of evaluation indexes. At first, the Sum of Squares of Deviations of every index is calculated, and the final cluster number is determined with the goal of minimizing the Sum of Squares for Total of all clusters.
Sum of Squares of Deviations of every index:

Sum of Squares for Total of all clusters:

Where, Di represents the Sum of Squares of Deviations of evaluation indexes of the ith clustering, n = 1, 2,. . ., m; Ni represents the number of evaluation indexes of the ith clustering; Aj i represents the normalized sample value vector of the jth evaluation index in the ith clustering, j = 1, 2,. . ., m; Ᾱi represents the vector of the average value of the ith clustering index samples.
Test of dimension reduction effect of index
The number of R clustering is set subjectively. Non-parametric K-W test is carried out for every kind of indexes after clustering, to test whether there are significant differences in numerical values of similar indexes, so as to judge whether the number of clusters is reasonable. If the significance level value Sig. of every kind of index is greater than 0.05, it indicates that there is no significant difference in similar indexes after clustering, that is, the number of clusters is reasonable.
Preliminary screening of indicators
The index information content in every clustering is analyzed by coefficient of variation. The larger the coefficient of variation of the index is, the stronger the information separation ability of the index is, and the better it can represent other indicators in the same category to represent the overall comfort. Coefficient of variation formula is as follows:

Where, Vj represents the coefficient of variation of the jth index in every experimental stage; n represents the number of objects to be evaluated;
Taking the preliminary screening results of indicators in the standing state as an example, the clustering process is illustrated. Substitute the indexes data into formula (2) and formula (3), and cluster the indexes data into four categories by SPSS 23.0. The clustering results are shown in Table 4.
Preliminary screening of indicators in standing state.

Y-Will be as evaluation indexes of the overall comfort; N-Will not be as evaluation indexes of the overall comfort.
It can be seen from Table 4, the K-W test Sig. Values are all more than 0.05. R-clustering and coefficient of variation index screening model were used to screen 19 standardized indexes data, and nine evaluation indexes were retained as the initial indexes of the overall comfort model (i.e. AHP-Entropy weight, Fuzzy Rough Set Theory, AHP-SEM, PSO-CS) when standing, which were bust, abdomen, elbow, inside forearm, inside thigh, back thigh, knee, shank, and crotch. Most of these indicators are concentrated in limbs. Through the coefficient of variation, it is preliminarily known that the upper body comfort is mainly affected by bust (0.703) and abdomen (0.680), inside thigh (0.803), back thigh (0.779), knee (0.768) and elbow (0.722), and the lower body comfort is mainly affected by the crotch.
The preliminary screening results of indexes under various sports conditions were obtained, as shown in Table 5.
Preliminary screening results affecting the overall comfort of every test stage.

It can be seen from Table 5 that there are many differences in the influencing indicators of overall comfort under different sports conditions. When the human body is in the state of squat, squat down, and lifting legs, the main influencing factors of overall comfort are the lower limbs, which may be due to the large activity of the lower body. In the state of jogging, walking, and rest, the main factors affecting the overall comfort are concentrated in the upper body. These indexes are only preliminary optimization, and can’t be used as the parts to characterize the overall comfort of every movement state (i.e. every experimental stage). These preliminary screening indicators should be selected as the final indicators through AHP-Entropy weight, Fuzzy Rough Set Theory, AHP-SEM, and PSO-CS.
AHP-Entropy weight evaluation model
Analytic Hierarchy Process (AHP), as a mathematical method combining qualitative and quantitative analysis, could get the importance sequence of all indexes, that is, the weight sequence, by calculating the pairwise importance evaluation matrix of indicators at all levels. However, when using qualitative method to construct the evaluation matrix, this method is easily interfered by subjective factors, which will lead to the loss of decision information of the discrimination matrix and makes the discrimination result too subjective.24,25 Entropy weight method could use information entropy to reflect the effective amount of information to obtain the weight of indexes, which belongs to objective discrimination method. Although using entropy weight method to discriminate and analyze indexes has a solid mathematical theoretical support, entropy weight method does not consider the influence of subjective factors on the analysis process, and relies too much on objective data, so its evaluation results are vulnerable to data fluctuations, which easily leads to the evaluation results being too objective. Therefore, the combination of AHP and Entropy weight method can effectively utilize the experience and professional knowledge of the subjects, and at the same time effectively utilize the objective information of the data, thus avoiding judgments that are too subjective or too objective. Finally, the comprehensive weight of every index is obtained by AHP and Entropy weight method, and the index which has less influence on comfort evaluation is removed, so as to reduce the dimension of the index.
AHP-Entropy weight evaluation method has better advantages in evaluating fuzzy nonlinear problems. The basic idea of using AHP-Entropy weight method is as follows:
(1) Determine the evaluation index level of the evaluation object. The evaluation subject U is divided into m evaluation dimensions, that is, U = {U1, U2, . . ., Um}, and secondary evaluation indicators Sσ = {Sσ1, Sσ2, . . ., Sσn} are obtained under different dimensions, where n represents the number of secondary indicators under a specific evaluation dimension.
(2) Construct judgment matrix J.
The first-class indexes of every experimental stage (i.e. every motion state) are upper body, lower body, and limbs. Secondary-class indexes are shoulder, armpit, etc., as shown in Table 6. During the experiment, at the end of every experimental stage, the subjects were asked about the comfort of different parts and overall body, according to the subject’s feelings during wearing, the subjects compare the importance of every layer of comfort index in every experiment state, score according to Table 7 and get the judgment matrix J:
Body parts indexes.

Setting the standard group of values (i.e. the scaling method of judgment matrix aij).
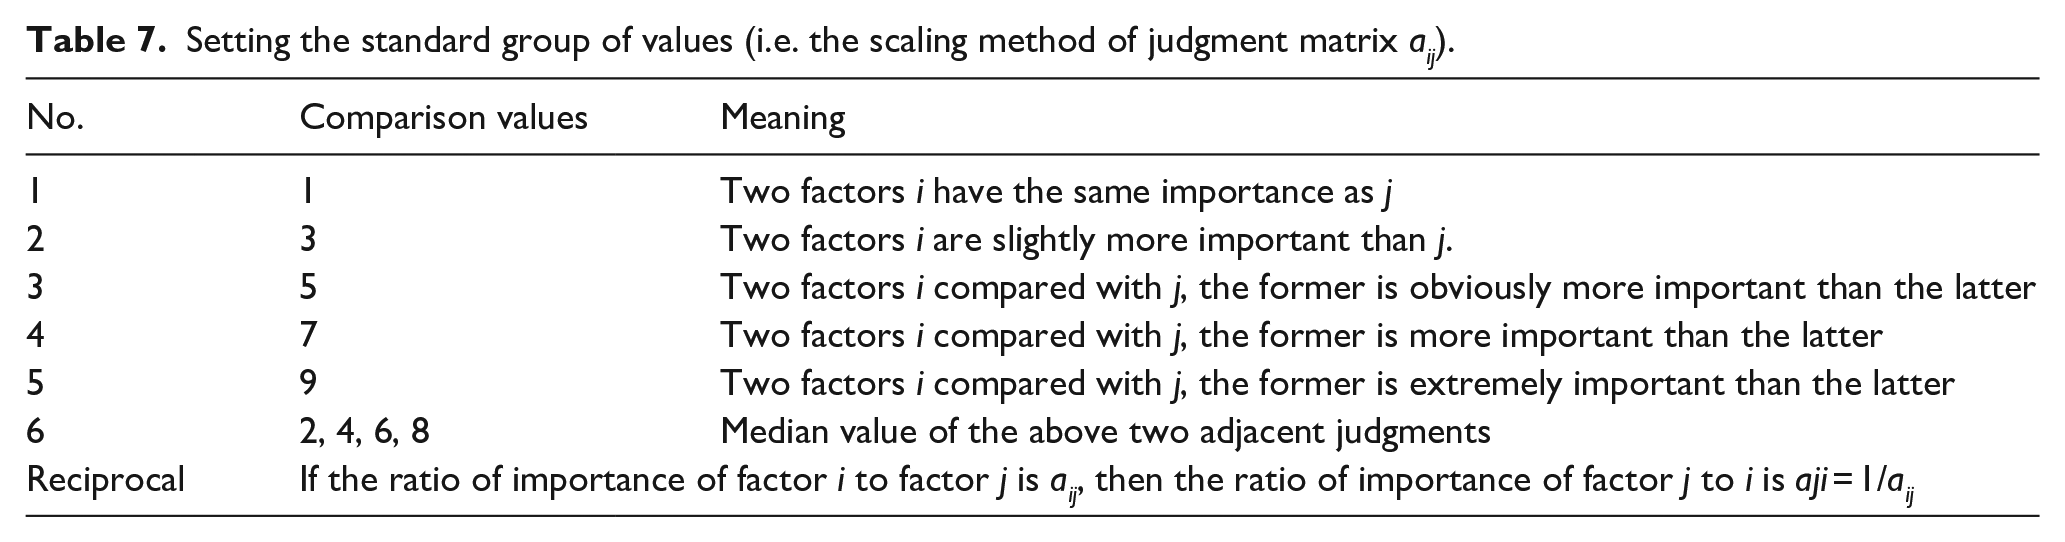
The judgment matrix is obtained by pairwise comparison of n indexes: J = (aij)n×m, where, aij > 0, aij = 1/aji. i = 1, 2,. . ., m; j = 1, 2,. . ., n.
(3) According to the definition of Entropy, the Entropy value and Entropy weight of evaluation index are determined.
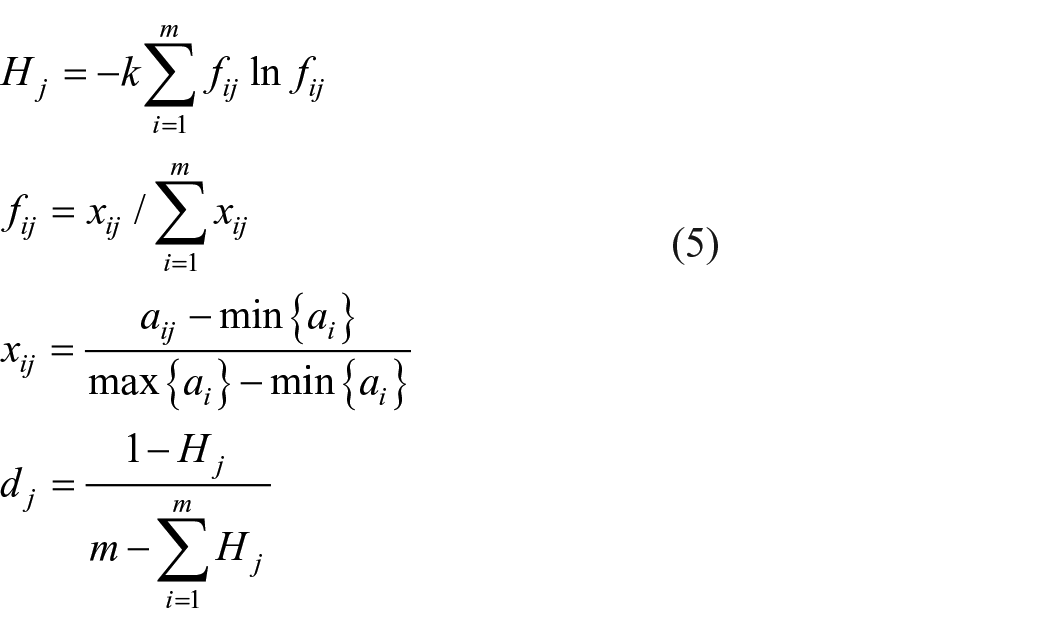
Where,
(4) Determine the comprehensive weight. According to the subjective weight obtained by AHP and the objective weight obtained by entropy weight, the linear weighting method is adopted to obtain the comprehensive weight, which comprehensively considers the subjectivity and objectivity and has good convincing power.

Where,
Fuzzy Rough Set theory model
Combining Fuzzy Rough Set with comprehensive evaluation, the Fuzzy Rough Set theory is used to obtain the indexes that have great influence on the evaluation results, thus simplifying the evaluation process without affecting the evaluation results.26 –29 In the Fuzzy Rough Set theory, the decision table is composed of conditional attributes and decision attributes. The decision table in this paper is composed of comfort evaluation of every part (i.e. the subjects’ scores of every part according to their wearing feelings), in which conditional attributes refer to the parts of the human body that affect the overall comfort, while decision attributes refer to the comfort scores of every part of the human body.
Specific steps:
(1) Construct membership function
The approximate space S = (U, R), where R is a fuzzy equivalent relation on the universe U. if X∈U, then X is a membership function of the upper RX′ and lower approximate sets RX″ of R.

(2) Membership function of fuzzy positive domain
For
(3) Attribute dependency function
The dependence of decision attribute Q on conditional attribute P is

AHP-SEM model
Combining Structural Equation Modeling (SEM) with Analytic Hierarchy Process (AHP), the comprehensive weight is determined and the comfort evaluation index system is constructed. AHP is a commonly used method of weight calculation subjectively. However, it is too subjective to objectively reflect the actual situation because it only compares two indexes of a complex problem by AHP and the weights are determined by expert scores. SEM method is a confirmatory analysis method, which can not only deal with the relationship among multiple variables and attach importance to the application of multiple statistical indicators, but also reflect the weight information of indicators in the correlation.30–33 However, SEM METHOD overcomes the influence of experts’ subjective factors to a certain extent, but it is easily influenced by the selection of sample data. When the sample data is not comprehensive, the obtained weights may seriously deviate from reality. Therefore, this paper adopts the method of combining SEM and AHP to calculate the weight. SEM can obtain objective index weight information, and AHP can make full use of the experience and knowledge of experts in related fields to obtain subjective evaluation results of the importance of indicators.

Where, Ai indicates subjective weight; Oi represents objective weight, and the value range of λ is [0,1], and the specific value depends on the actual situation.
PSO-CS model
Particle Swarm Optimization (PSO) and Cuckoo Search (CS) are both swarm bionic intelligent algorithms, which have different performances in global search ability and convergence speed. PSO algorithm has strong local search ability and easy convergence, but it is easy to fall into local optimum. CS algorithm has sufficient global searching ability, but it has weak local searching ability and is not easy to converge. Combining the advantages of Particle Swarm Optimization (PSO) and Cuckoo Search algorithm, a new method for optimizing comfort prediction index is proposed.
According to the principle that every particle in particle swarm optimization is moving toward the current global optimum and every particle searches for the current local optimum, after every Levi flight, an improved particle algorithm is used to update the result solution position of Levi flight, so that every bird nest in cuckoo algorithm can move toward the global optimum and local optimum just like every particle in particle swarm optimization.34 –36 The combination of PSO and CS not only keeps the randomness of searching, but also reduces the blindness of searching and accelerates the convergence of particles to the optimal solution. At the same time, the random elimination mechanism of CS algorithm makes the algorithm escape from local optimum smoothly, thus improving the performance of CS algorithm. Basic flow of PSO-CS algorithm:
(1) Parameter of PSO-CS algorithm are initialized, that numb of nests n, the maximum iteration times Nmax, the discovery probability Pa, the inertia weights wmax, wmin, the learn factors c1, c2, and the upper limits Ub and lower limits Lb of the search domain. Random initialization of bird’s nest position P0t = 0, the initial velocity v0t = 0 and the initial optimal individual Pbest = P0, and the optimal target value in P0 was defined as the initial population optimal Gbest.
(2) Inertial weight:
(3) The target values of P0t and P1t are calculated, and the nest positions in the top n of the target values corresponding to the number n of nests are selected to form P2t. Every nest in P2t is eliminated with a random probability of uniform distribution, and the random elimination probability matrix C = (C1, C2, . . . Cn) of every nest is compared with the discovery probability Pa.

Where, Ub, Lb are the upper and lower bounds of optimization; randn(n,1) is a normal distribution with mean value n and variance value 1.
(4) Calculate the target values of P2t and P3t, select the bird’s nest positions in the top n of the target values corresponding to the number of bird’s nests n to form P4t, extract the bird’s nest position with the best quality in P4t, and record it as Zbest, judge whether it meets the iteration times or error requirements, if so, stop and output the optimal solution; Otherwise, compare P4t with P0t, update individual best Pbest and group best Gbest, make P4t = P0t, t = t + 1, go to step (2) and enter the next iteration.
Results and discussion
Optimization results of different models
The overall comfort impact indicators of every test stage (i.e. different exercise states) are screened according to the weight, as shown in Table 8.
Comparison of optimization results of indicators.
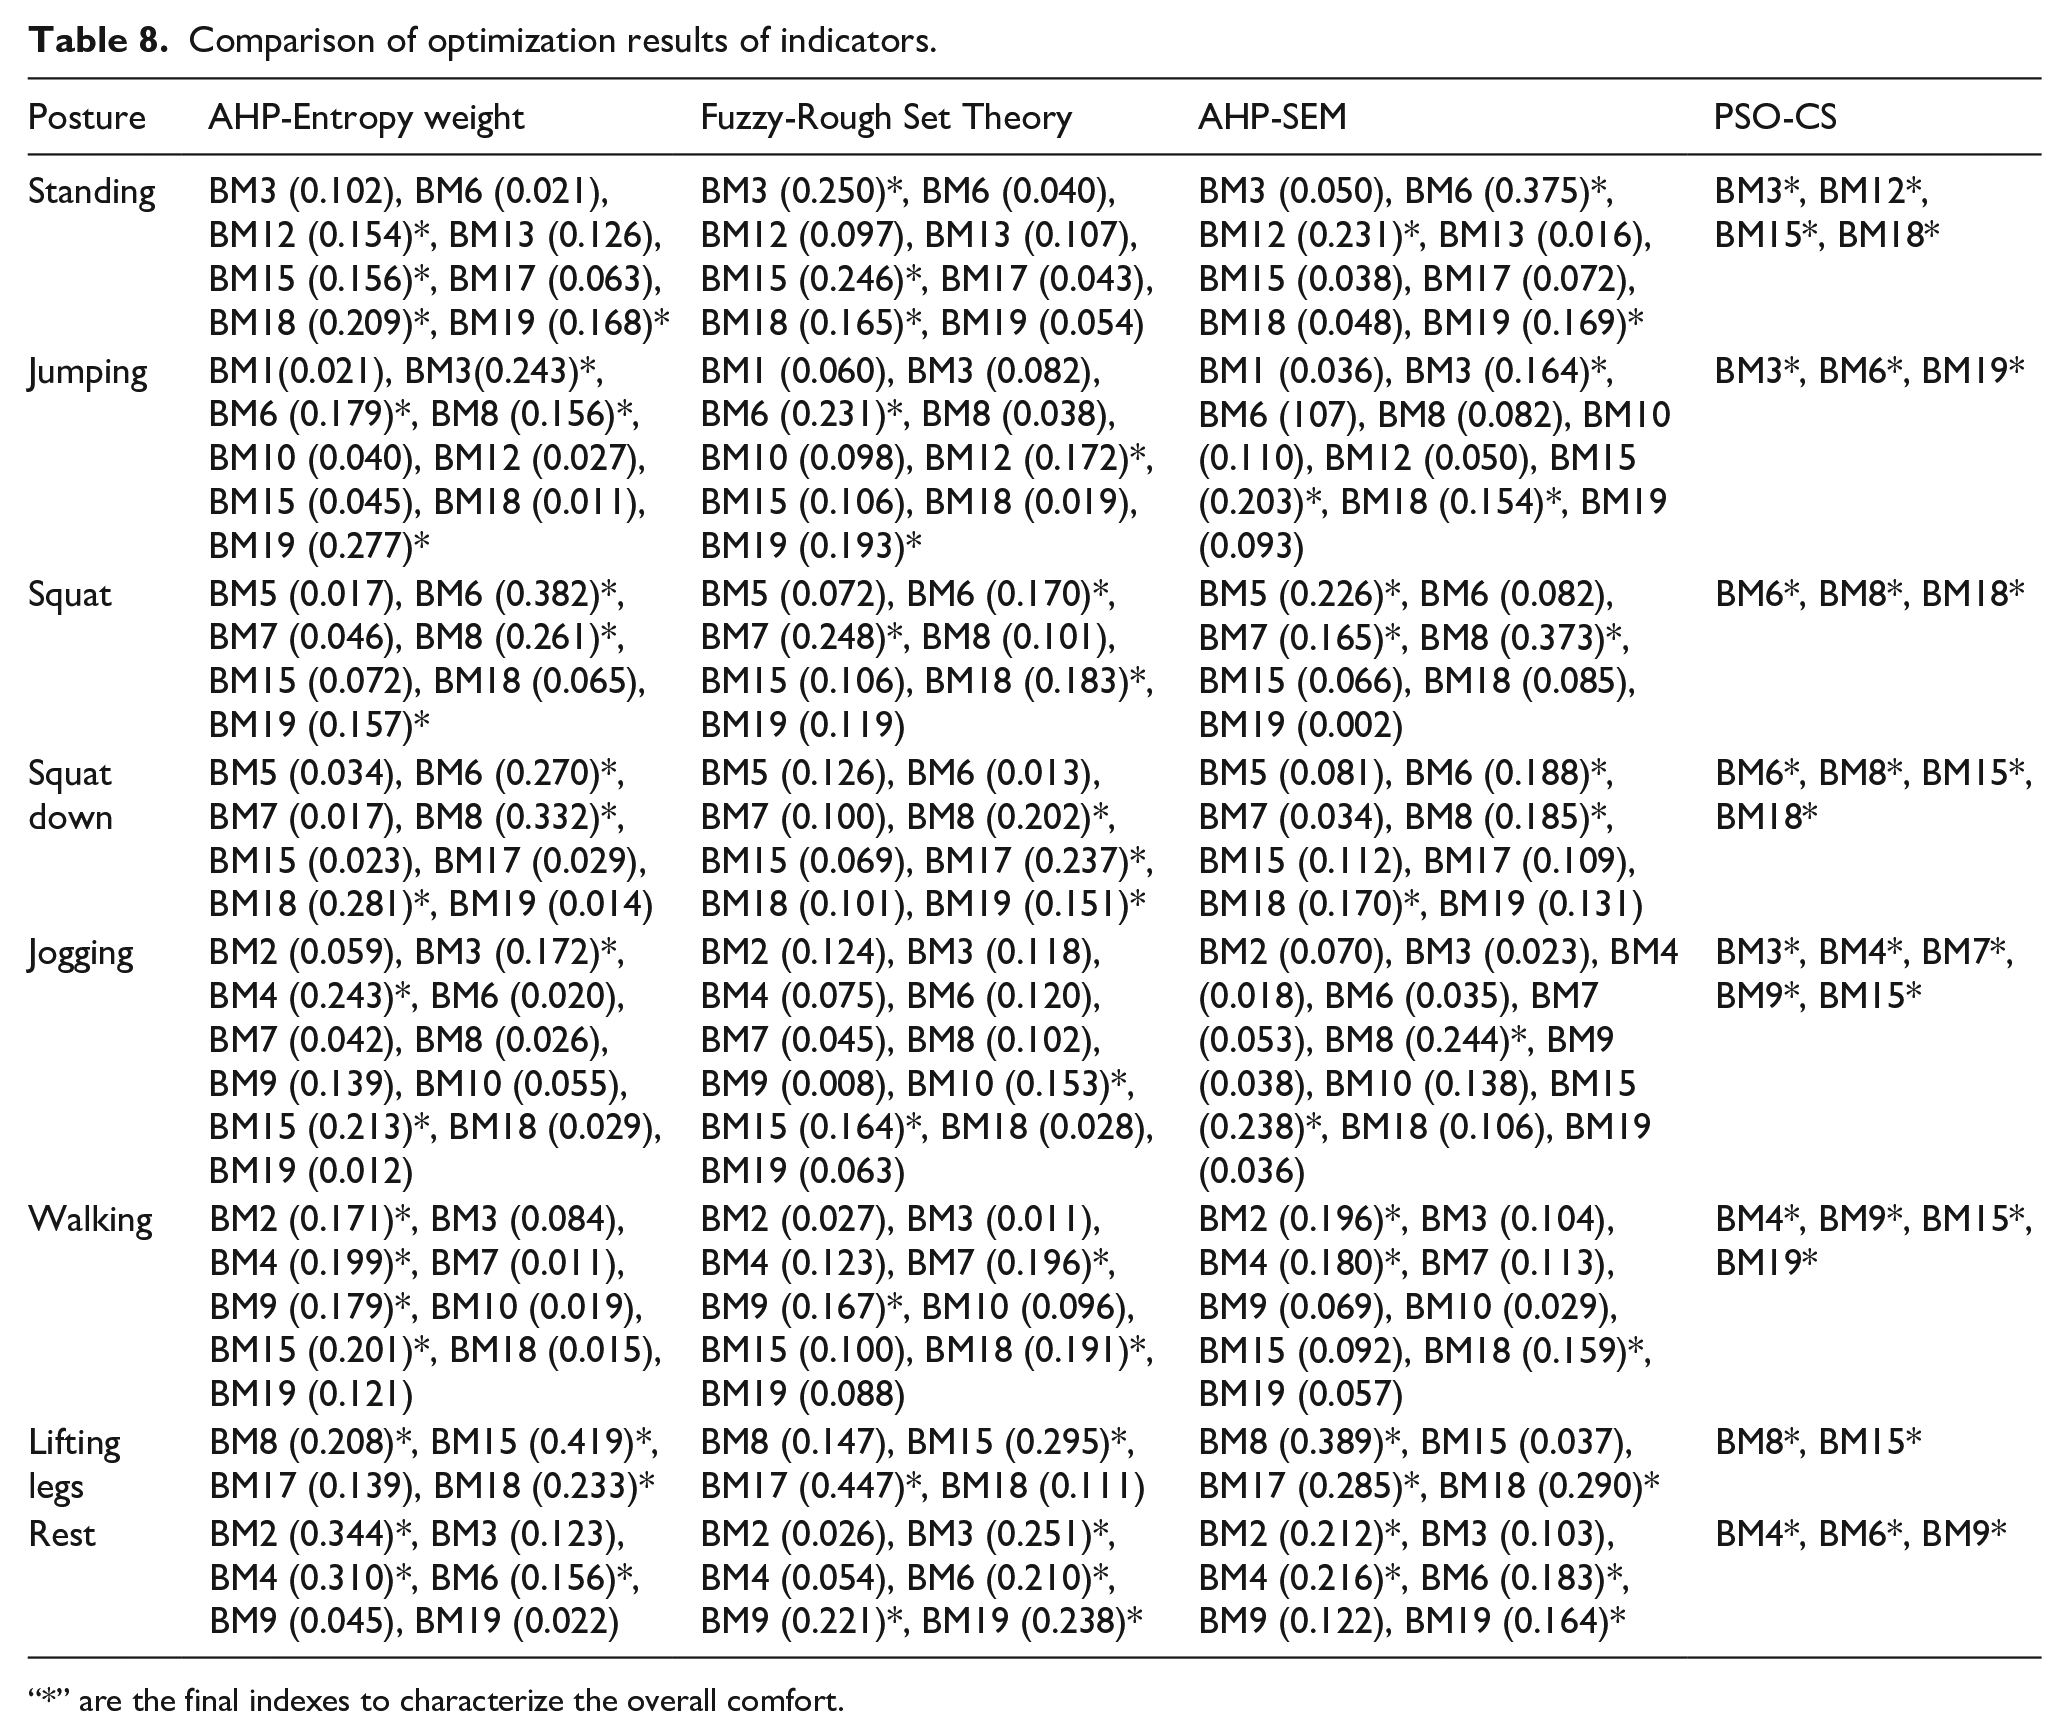
“*” are the final indexes to characterize the overall comfort.
It can be seen from Table 8 that: (1) There are some differences in the indicators that affect the overall comfort in different sports states, that is, the comfort in different parts is quite different, mostly due to the different senses of thermal and moisture, pressure or tactile in different parts.
(2) There are some differences in the optimization indexes of AHP-entropy weight, fuzzy rough set theory, AHP-SEM, and PSO-CS, among which, the optimization indexes of AHP- entropy weight and PSO-CS are similar, which shows that AHP-entropy weight, as an evaluation model combining subjectivity and objectivity, and intelligent model (PSO-CS) are similar to the overall comfort index optimization.
(3) Observing the four models at every experiment state, the optimization level of the indexes when standing is similar, and most of the indexes optimized by the four models belong to limbs, which shows that the comfort of limbs has the greatest influence on the overall comfort when standing. Under other conditions, there are great differences in the impact indicators.
Simulation results verification and analysis
To verify the effectiveness of AHP-Entropy weight, Fuzzy Rough Set theory, AHP-SEM and PSO-CS in optimizing indexes, the indexes of every experimental state optimized by them are taken as input parameters and the corresponding overall comfort is taken as output parameters, and the prediction is made by the Adaptive Network-based Fuzzy Influence System (ANFIS) model. And then compare the prediction values with the real overall comfort evaluation values.
Model for verifying simulation results
In this paper, Adaptive Network-based Fuzzy Influence System (ANFIS) was used to test the validity of optimization indexes of every model. Adaptive Network-based Fuzzy Influence System (ANFIS), in fact, is also an artificial neural network model. ANFIS combines the advantages of neural network and fuzzy system, and makes up for the shortcomings of them. It can extract fuzzy rules from data sets well, adjust corresponding parameters by learning, simulate ideal input-output correspondence, and complete fuzzy classification work well.37 –40 The biggest feature of ANFIS model is modeling based on data, in which fuzzy membership function and fuzzy rules are obtained by learning input data. In a word, ANFIS network is an optimized model and a combined model. Fuzzy control theory can enhance the reasoning ability of neural network and increase the accuracy of the model, which can effectively improve the problem that the traditional artificial neural network is easy to fall into local minimum. The ANFIS model structure is shown in Figure 3.

ANFIS model structure.
Layer 1: Fuzzy segmentation layer. The nodes in this layer are all adaptive nodes, and their node functions are shown in Formula (11).

Where, I1, I2 are the input of node i; Ai, Bi are the “identification language” related to the node function value, such as “comfortable” or “uncomfortable”; O1,i is a membership function, which represents the degree to which I1 and I2 satisfy Ai and Bi, and usually adopts Gaussian function or bell function.
Layer 2: Rule reasoning layer. In Figure 3, ∏ is used to represent the nodes of this layer, that is, the input signals are multiplied and the output is

Where, wi represents that output signal, which is the expression of the excitation intensity of I1and I2 under a certain rule.
Layer 3: Fuzzy layer. In the figure, the node of this layer is represented by N, and the ith node calculates the ratio of wi of the ith rule to the sum of w values of all rules.

Layer 4: Deblurring layer. For the adaptive node for parameter learning, the output node function is expressed as

Where, pi, qi, ri are parameters learned in fuzzy rules.
Layer 4: Output layer. Marked by symbol Σ, the nodes are fixed, and the total output of the system is obtained

Establishing steps of ANFIS model:
① Select sample data.
② The sample data are divided into two parts: training data and testing data. In this paper, the comfort questionnaires of M3 trying on T2P1, M2 trying on T1P1, M2 trying on T3P2 are randomly selected as the testing data, and others as the training data.
③ Set model training parameters.
④ Training model with training set data.
⑤ Verify model.
Analysis of prediction results
The prediction results of the overall comfort based on AHP-Entropy weight, Fuzzy Rough Set theory, AHP-SEM, and PSO-CS are shown in Table 9, and the error of the prediction results is shown in Figure 4. The smaller the error between the real value and the predicted value of the overall comfort is, the better the prediction index of the overall comfort is, that is, the model of the optimization index is better.
Comparison of predicted results of overall comfort.

Te1-M3 wore T2P1; Te2-M2wore T1P1; Te3-M2 wore T3P2.

Comparison of error values of overall comfort prediction results.
It can be seen from Table 9 and Figure 4 that the minimum average absolute error of the overall comfort of the four mixed models is 0.1485, that is, the maximum accuracy of the predicted value and the true value is about 85%. The maximum average absolute error is 0.3473, that is, the minimum accuracy between the predicted value and the true value is about 65%, the prediction level is higher.
The prediction performances of AHP-Entropy weight-ANFIS, Fuzzy-Rough Set Theory-ANFIS, AHP-SEM-ANFIS, and PSO-CS-ANFIS are quite different in every test stage, which shows that AHP-Entropy weight, fuzzy rough set theory, AHP-SEM, and PSO-CS have advantages and disadvantages in optimizing indexes. For example, as far as the predicted results and errors of overall comfort in the standing state are concerned, according to the average absolute errors, that is, the average absolute errors between the real and predicted values of overall comfort of M3 trying on T1P1, M2 trying on T1P1, and M2 trying on T3P2. It can be known that PSO-CS-ANFIS (mean absolute error: 0.2183) < AHP-Entropy weight-ANFIS (mean absolute error: 0.2274) < AHP-SEM-ANFIS (mean absolute error: 0.4585) < Fuzzy-Rough Set Theory-ANFIS (mean absolute error: 0.5123). It shows that there are big problems in the indexes optimized by Fuzzy-Rough Set Theory. The accuracy of the predicted value and the true value of PSO-CS-ANFIS and AHP-Entropy weight-ANFIS is about 78%, and the prediction ability can be accepted. For the study of overall comfort in the standing state, we can use PSO-CS-ANFIS or AHP-Entropy weight-ANFIS model to predict, that is, we can use PSO-CS or AHP-Entropy weight optimization index to study the overall comfort in this state, that is, the best index combination to predict the overall comfort in the standing state is: group a: BM3 (bust), BM12 (elbow), BM15 (inside thigh), BM18 (knee); group b: BM12 (elbow), BM15 (inside thigh), BM18 (knee), BM19 (shank).
In jumping state, the average absolute errors of the four models are AHP-Entropy weight-ANFIS (average absolute error: 0.1372), fuzzy rough set theory-ANFIS (average absolute error: 0.3022), AHP-SEM-ANFIS (average absolute error: 0.5705), PSO-CS-ANFIS (average absolute error). It shows that the index optimized by PSO-CS-ANFIS has the highest accuracy in predicting the overall comfort in this state, that is, BM3 (bust), BM6 (abdomen), and BM19 (shank) are the best indexes for predicting the overall comfort in jumping state.
In squat state, the average absolute errors of the four models are AHP-Entropy weight-ANFIS (average absolute error: 0.1894), fuzzy rough set theory-ANFIS (average absolute error: 0.2035), AHP-SEM-ANFIS (average absolute error: 0.1535), PSO-CS-ANFIS (average absolute error). Although the average absolute error of AHP-SEM-ANFIS is the smallest, the average absolute error of PSO-CS-ANFIS is very close to it, so the optimization indexes of AHP-SEM and PSO-CS can be used to predict the overall comfort of this state, that is, group a(BM5 (lumbar), BM7 (body side), BM8 (hip)) and group b(BM6 (abdomen), BM8 (hip), BM18 (knee)), respectively.
In squat down state, according to the average of absolute errors of the four models, we can know that the best models for index optimization are AHP-Entropy weight (average absolute error: 0.1527) and PSO-CS-ANFIS (average absolute error: 0.1772), that is, the best index combination for predicting the overall comfort in this state are respectively group a(BM6 (abdomen), BM8 (hip), BM18 (knee)) and group b(BM6 (abdomen), BM8 (hip), BM15 (inside thigh), BM18 (knee)).
In the jogging state, the average absolute errors of the four models are AHP-Entropy weight-ANFIS (average absolute error: 0.1217), AHP-SEM-ANFIS (average absolute error: 0.0945), PSO-CS-ANFIS (average absolute error: 0.1399), and the optimization indexes of these three models can be used as a whole in this state, but the indexes optimized by AHP-SEM are the best, namely BM8 (hip) and BM15 (inside thigh).
In the walking state, the minimum average absolute error is 0.1827, which belongs to AHP-Entropy weight-ANFIS model, that is, the best indicators for predicting the overall comfort in this state are BM2 (armpit), BM4 (back), BM9 (crotch), and BM15 (inside thigh). At this time, the average absolute error of PSO-CS-ANFIS is 0.2800, and the accuracy rate is 72%, which is an acceptable prediction level.
In the lifting legs state, the best model for predicting the overall comfort is PSO-CS-ANFIS (average absolute error: 0.1638), that is, the indexes optimized by PSO-CS are most suitable for predicting the overall comfort in the lifting legs state, and the indexes are BM8 (hip) and BM15 (inside thighs).
In the rest state, the better models for predicting overall comfort are PSO-CS-ANFIS (mean absolute error: 0.1471) and AHP-Entropy weight-ANFIS (mean absolute error: 0.1848), that is, the indexes optimized by PSO-CS or AHP-Entropy weight model are suitable for predicting overall comfort in rest state, and the indexes are respectively: group a: BM4 (back), BM6 (abdomen), BM19 (shank); group b: BM2 (armpit), BM4 (back), BM6 (abdomen).
Generally speaking, the optimal prediction model of every motion state contains PSO-CS-ANFIS model, so the optimization index of PSO-CS could be used as the prediction of the overall comfort of all States. Secondly, AHP-Entropy weight-ANFIS model can be used to predict the overall comfort under most motion conditions. At the same time, PSO-CS and AHP-Entropy weight could be used to optimize the human body part indexes that affect the overall comfort.
Conclusion
According to the prediction results of every experiment state (i.e. standing, jumping, squat, squat down, jogging, walking, lifting legs, rest), Fuzzy-Rough Set Theory-ANFIS prediction model has the worst effect (i.e. the indexes optimized by Fuzzy-Rough Set Theory are the worst), and the other three models have their own advantages in every experiment state. Among them, PSO-CS-ANFIS model and AHP-Entropy weight-ANFIS model perform well, that is, PSO-CS and AHP-Entropy weight can be used to optimize the overall comfort prediction index in every experiment state.
There are great differences in the influence indexes of overall comfort in every movement state, that is, there are great differences in the comfort of human body parts. Therefore, when studying dynamic comfort, it is best to subdivide the movements and study the comfort in every movement state, which is not suitable for studying the whole movement state as an entirety.
In short, this study proposed a model which can obtain the comfort of every motion state without wearing experiments, which improves the research efficiency of the comfort of tights, and provides more accurate design basis for the comfort of tights and favorable technical guidance for maximizing the sports comfort, and finally realized that wearers could gain a better sense of movement when wearing tights and then improve their sport performance. The research methods of this study can be used to predict the comfort of every movement in other sports events.
Footnotes
Author note
Jianping Wang is now affiliated to Key Laboratory of Clothing Design & Technology, Donghua University, Ministry of Education, Shanghai, China and Shanghai Belt and Road Joint Laboratory of Textile Intelligent Manufacturing, Shanghai, China.
Declaration of conflicting interests
The author(s) declared no potential conflicts of interest with respect to the research, authorship, and/or publication of this article.
Funding
The author(s) disclosed receipt of the following financial support for the research, authorship, and/or publication of this article: This paper was financially supported by China Scholarship Council and Fujian Province Social Science Planning Project (FJ2020C049), national key research and development plan “science and technology in Winter Olympic Games” (2019YFF0302100) and International Cooperation Fund of Science and Technology Commission of Shanghai Municipality (Grant NO. 21130750100).