
Abstract
Geotextiles, as a type of common filtration material, have broad prospects in emergency rescue of dike backward erosion piping (BEP). To investigate the filtration performance of geotextile in BEP emergency rescue, several experiments were conducted using nonwoven and woven geotextiles to simulate the process of rescuing BEP with geotextiles. The influence of geotextile specifications and types on hydraulic compatibility of the filter system was analyzed, and the clogging mechanism of geotextile during dealing with BEP was revealed at a microscopic level. The results showed that the nonwoven geotextile filter with an equivalent pore size of 0.103 mm had a gradient ratio value of less than 3, and it had a highest flow rate of 260 mL/min. Increasing the thickness and pore size of nonwoven geotextiles within a certain range helped enhance their anti-clogging ability. The main mechanism of clogging in nonwoven geotextiles was the deposition of fine sand particles on their surface, forming a layer of low permeability soil. Plain woven geotextiles experienced severe clogging with a 42% reduction in flow rate, and it was not suitable for rescuing BEP. The clogging mechanism of woven geotextile involved the blocking of horizontal water passages by fine sand particles.
Introduction
Dikes play a vital role in the flood control system and protecting coastal residents’ lives and properties. Backward erosion piping (BEP) is an internal erosion mechanism that can occur in the granular foundations of dams and dikes consisting of uniform silts and sands and covered by a cohesive layer.
1
The phenomenon occurs when the head loss across the structure results in a flow through the aquifer and a concentrated seepage flow downstream of the structure. This involves high local hydraulic gradients that cause upward forces on the sand grains that lead to the onset of erosion when the gradient is high enough. The subsequent erosion causes the development of shallow pipes in the upstream direction below the cohesive layer (Figure 1). Once a BEP incident occurs, timely emergency measures need to be taken to prevent the potential impact on the safety of dikes. If not addressed promptly, it may lead to dike collapse.2,3 The most effective and commonly used method for BEP emergency response is to lay filtration materials at the water outlet of BEP, this method helps to prevent continuous erosion of sand particles. Geotextiles own advantages such as low cost, energy efficiency, environmental friendliness, easy construction, quick installation, and reliable quality compared to traditional filtration materials like sand and gravel filter used for preventing BEP.4–6 Therefore geotextiles have broad prospects in BEP emergency rescue.7,8 Schematic diagram of dike backward erosion piping and emergency rescue based on geotextile filters.
To ensure optimal filtration performance of geotextiles, it is necessary to conduct research on their filtration performance in different engineering scenarios. Previous studies have investigated the filtration properties of geotextiles in various contexts such as filtering air, 9 tailings,10,11 and recycled materials.12,13 Moraci et al. 14 evaluated the long-term behavior of geotextile filters in contact with cohesionless soils with geometrical, experimental and micro-structural approach. Adachi et al. 15 studied the clogging and filtration process of geotextiles within silt fences under discharge cycles conditions. Pal and Deb 16 investigated the filtration capability of a geotextile encasement used to prevent clogging of stone column. Yan et al. 17 performed simplified indoor experiments to qualitatively analyze filtration performance of different types of geosynthetic materials (geotextiles, geogrids, and geonet). Variable head conditions were used in the experiment, however, constant head conditions are more similar to the on-site conditions. Zhang et al. 18 conducted filtration experiment on geosynthetic materials under high water pressure conditions, simulating the process of BEP rescue of the Yellow River dike. The horizontal seepage conditions were simulated in the experiment, but the actual seepage direction was vertically upward at the location of piping outlet. However, limited research has been conducted on the filtration performance of geotextiles used in BEP rescue.
The filtration performance of geotextiles in emergency response for BEP are affected by many factors such as soil gradation, geotextile pore size, and flow conditions. Currently, the relevant research is rare, and the micro-mechanism of geotextile clogging during BEP rescue is not yet clearly revealed, leading to a lack of scientific criteria for selecting geotextiles. Although geosynthetic materials significantly improve the efficiency of emergency rescue, the challenge lies in the rational selection of geosynthetic materials that match the soil characteristics of dikes and hydraulic conditions. Therefore, there is an urgent need for further investigation into the filtration performance of geotextiles in emergency response for BEP.
This paper focus on filtration performance of geotextiles during BEP emergency rescue. Indoor experiments were conducted using an improved gradient ratio (GR) apparatus with typical sandy soil from the Yangtze River dike. The experiments assessed the effectiveness of three nonwoven geotextile specifications and one woven geotextile in preventing BEP. The impact of pore size, thickness, and geotextile type of geotextile filter layers on their soil retention, clogging, and permeability properties was thoroughly analyzed. The distribution and morphology of clogging substances were investigated to reveal the clogging mechanism of geotextiles used for rescuing BEP. This research aims to provide a scientific basis for the selection of geotextiles in the emergency rescue of BEP in dikes.
Materials and methodology
Apparatus
The experiment was conducted using an GR apparatus, as shown in Figure 2. The apparatus consists of an upper, middle, and lower part, which are connected by flanges and bolts, and the flanges are sealed with rubber pads. The apparatus can accommodate soil samples with dimensions of 100 mm height and 100 mm diameter, and the soil sample in the apparatus is used to simulate the foundation soil at the location of BEP water outlet. The flow direction of the water is vertically upward, and the opening in the upper part of the apparatus is used to simulate the BEP outlet. To protect the sand sample from erosion by the inflow water, a perforated plate and a layer of nylon mesh (with a pore size of 0.12 mm) are placed at the bottom of the sand sample. The geotextile filter is placed on the top of the sand sample to simulate the filtration process of geotextile preventing BEP in engineering sites, and the edges of the geotextile are fixed with flange plates. There are five pressure measurement ports distributed on the side of the apparatus to measure the water head at different positions of the sample. Compared to traditional GR apparatus, the experimental apparatus was improved by installing a pressure gauge on the lower side of the geotextile, which call port #5. The distance between the center of port #5 and the geotextile is 3 mm, and this port is more sensitive to the changes at the soil-geotextile filter interface6,19 due to being closer to the geotextile. This port can capture the interaction between the protective soil and the geotextile filter, which is important to elucidate filtration mechanism. The water inlet is connected to the overflow system, which provides a constant water head for the test. The average hydraulic gradient of the system can be adjusted by changing the water head of the water inlet. Experimental apparatus (unit: mm). (a) Design image (b) Physical image.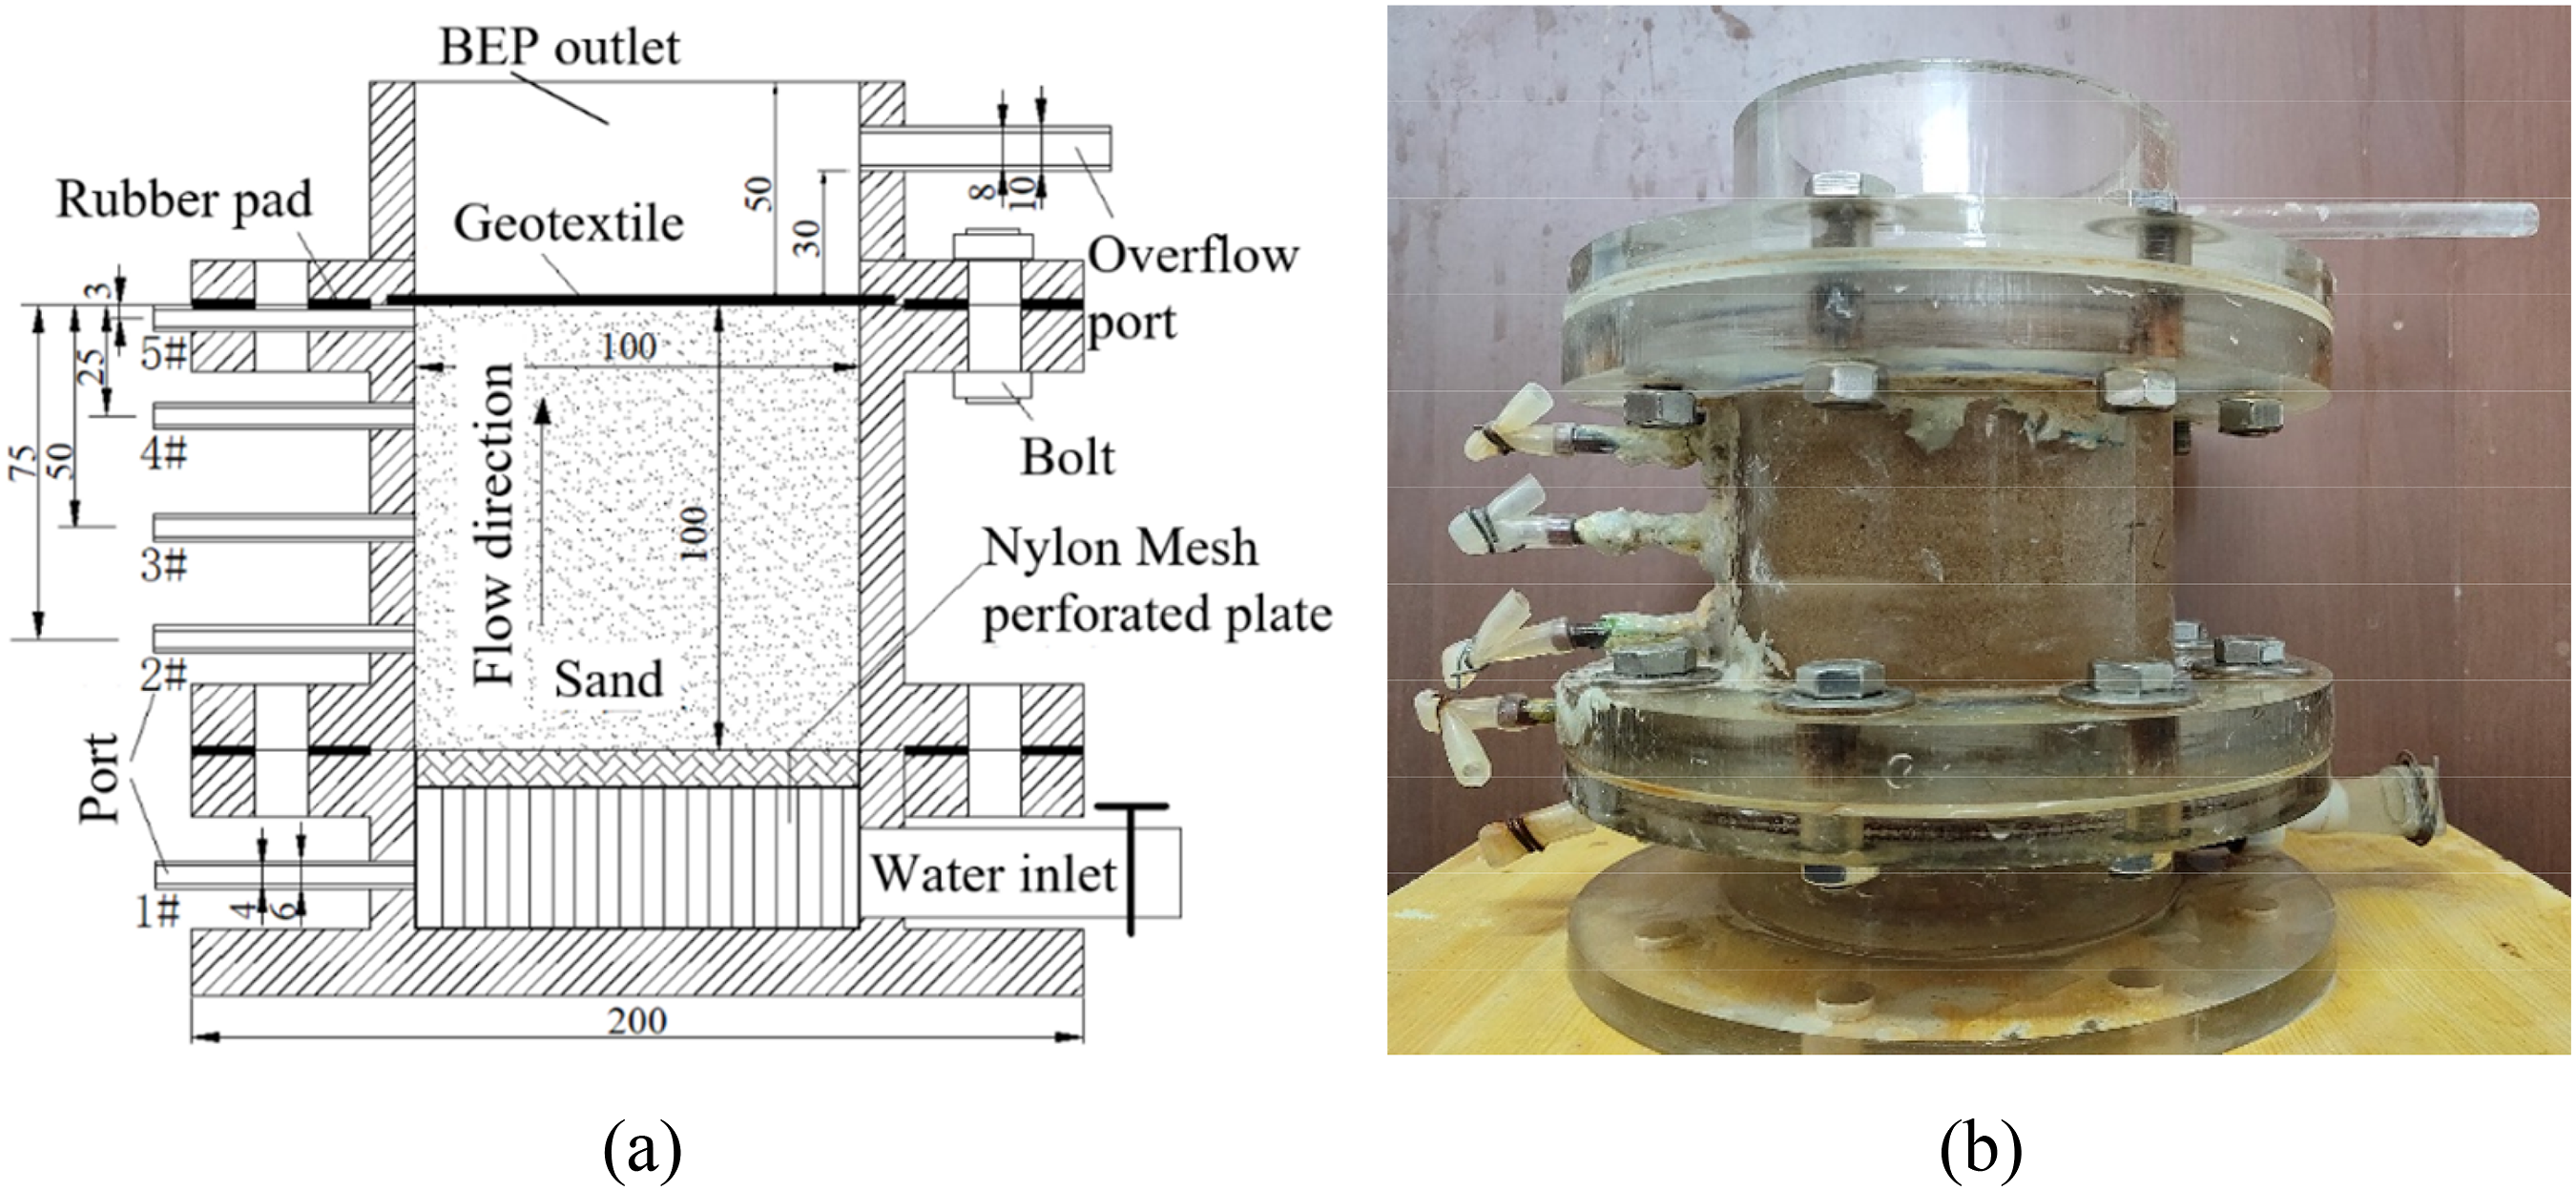
Materials
Needle-punched nonwoven geotextiles with short fiber and woven geotextiles were selected in this study (Figure 3), which are commonly used in geotechnical engineering for filtration and drainage. Geotextiles (a) non-woven geotextile (b) woven geotextile.
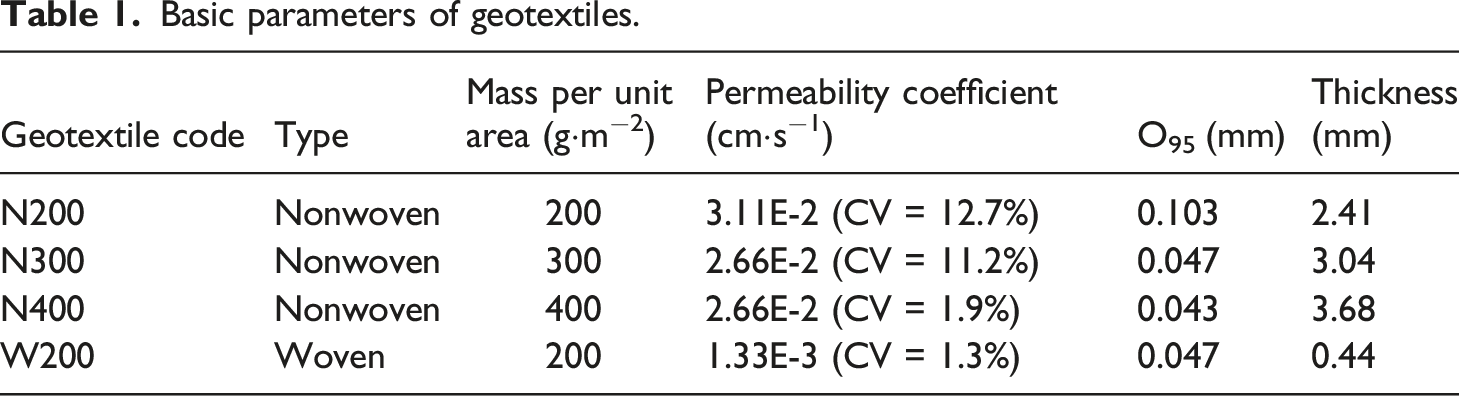
Basic parameters of geotextiles.

Pore diameter distribution curves of the geotextiles.
The sand used in the experiment is medium sand, which is a typical sand for foundation of the Yangtze River dike. The specific gravity of the sand is 2.52, and the grading curve is shown in Figure 5. Based on the interior stability criterion of Kenney and Lau,
20
the sand is classified as internally stable. The characteristic particle size of the sand sample is presented in Table 2, with a maximum dry density of 1.82 g/cm3 and a minimum dry density of 1.57 g/cm3. In the test, the relative density of the sand is 26.8%, which is in a loose state to simulating the actual situation. The corresponding permeability coefficient at the fill density is 2.33×10⁻³ cm/s. Grading curve of sand. Parameters of sand sample.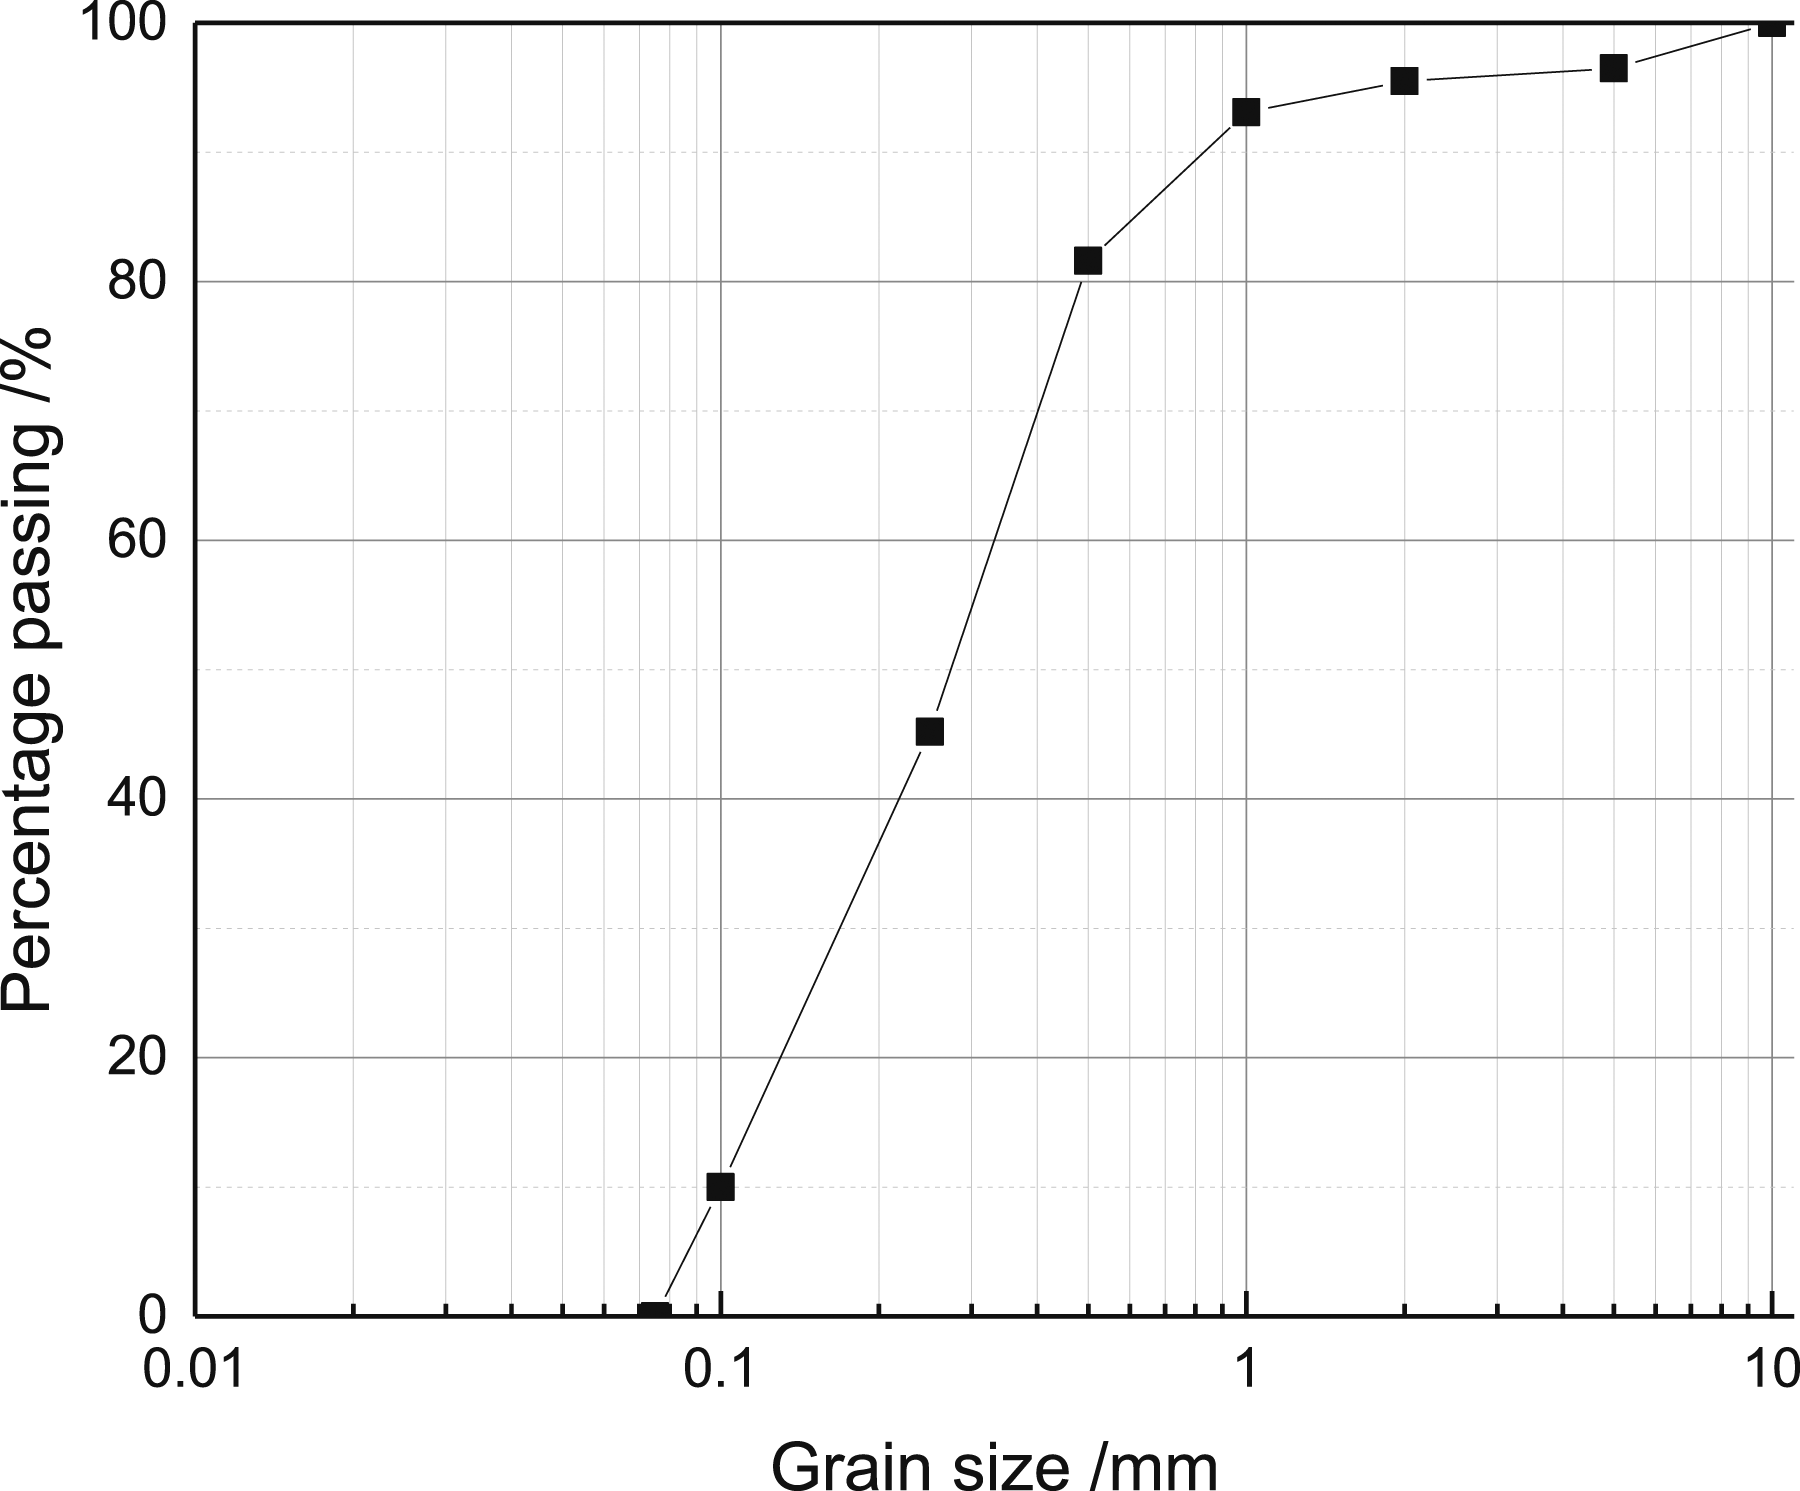

Experimental design
Experimental scheme.

Experimental procedure
Specimen preparation
To prevent sand from entering the pressure measurement tubes during sample installation, the inlets of the five pressure measurement tube interfaces were plugged with lightweight geotextile (150 g/m2). A perforated plate and a layer of nylon mesh were placed at the bottom of the GR apparatus. Then the sand sample was filled underwater with a dry density of 1.63 g/cm3 to ensure saturation. The height of the sand sample was 100 mm, and it was filled in four layers with a thickness of 25 mm each. After the filling process, a saturated geotextile with a diameter of 120 mm was placed on top of the sand sample. Afterwards, the upper part of the apparatus was installed with bolts and sealed using rubber pads to ensure the tightness of the apparatus. During the test, the apparatus was handled gently to avoid disturbing the sample structure. For convenient installation, the geotextile was cut into original pieces with a diameter of 120 mm, and its mass was then measured. The saturation process of geotextiles was to place them in a solution with a 0.1% volume fraction of sodium dodecyl benzene sulfonate for 12 h. The experimental process is illustrated in Figure 6. Experimental procedure. (a) Filling samples underwater (b) Installation of geotextiles (c) Conducting tests.
Experimental process
The water inlet valve was closed and the water level of the overflow system was adjusted to the top surface of the sample. Then, the inlet valve was opened, and the upstream water level was raised to the designed height once the water heads of the five pressure measurement tubes were equal. For Test-1, the upstream water level was raised step by step, with an initial increment of 2 cm each time in the early stage and 1 cm each time in the later stage to determine the critical hydraulic gradient of BEP. Based on the experimental results of Test-1, The average hydraulic gradient was set to 2.0 in Test-2 to Test-5 to ensure the occurrence of BEP, and the water head was raised to the design height in one step. The experimental process refers to ASTM D5101, however, the total test time was adjusted from 24 h to 12 h based on the actual engineering situation. To minimize the harm of BEP, the engineering rescue time for the BEP is generally kept within 12 h. The water heads of the pressure measurement tubes and the system flow rate were recorded at 2, 5, 10, 15, 20, 30, 45, 60, 80, 100, 120, 240, 360, 480, 600, 720 min. After the test, the sand particles that passed through the geotextile filter was collected, dried and weighed to analyze the soil retention of the geotextile. The geotextile was taken out for drying, weighing, and clogging analysis.
Analytical method
Geotextile filters used in emergency rescue of dike BEP must possess good filtration properties, including the soil retention, permeability, and anti-clogging properties.
21
By comparing the GR value, flow rate, and variations of geotextile mass and other parameters across different tests, the filtration performance of geotextile filters were analyzed. The GR value is a significant indicator of geotextile clogging. The GR25, in particular, is defined as follows
6
:
Results and discussion
Critical hydraulic condition of BEP
In Test-1, no geotextile was installed to study the critical hydraulic gradient of BEP in selected sand, and this test was taken as a control group. The upstream water level was raised step by step, and sand boiling began to occur when the average hydraulic gradient reached 0.84, with a sand boiling diameter of 2 cm. When the average hydraulic gradient increased to 1.04, the muddy water containing a large amount of sand particles rapidly gushed at the BEP outlet, resulting in failure of the sand specimen (see Figure 7). In Test-2 to Test-5, geotextile filters were installed above the sand to study the filtration performance of geotextile in preventing BEP. To ensure that BEP could occur when there was no geotextile filter in Test-2 to Test-5, the average hydraulic gradient was set to 2.0 in these tests. Table 4 provides the experimental results for Test-2 to Test-5, and the GR25 and flow rate were the final stable values. Picture of the failure for sand at critical hydraulic condition. Experimental results of different tests.

The geotextile filter needs to satisfy the requirement of soil retention during the usage process. Soil retention means that the pore size of the filter should match the particle size of the protected soil to prevent seepage deformation of the protected soil caused by the loss of skeleton particles. After the test, the sand particles that passed through the geotextile filter were collected, dried and weighed. The mass of sand that passed through the geotextile in all tests was close to zero, indicating that all geotextile filters met the soil retention requirements. Based on GR value, flow rate of the filter, and distribution pattern of clogging substances, the clogging and permeability characteristics of geotextile filters during the prevention of BEP were analyzed in following part.
Influence of geotextile specifications on its filtration performance
Clogging analysis of geotextile filter
Figure 8 shows the variation of GR value over time for different specifications nonwoven geotextile. The 300 g/m2 nonwoven geotextile system had the highest GR value and changed little over time. Throughout the entire experiment, the GR25 of the 300 g/m2 system was consistently greater than 3.0, indicating significant clogging of the geotextile system. The GR values of the 200 g/m2 and 400 g/m2 nonwoven geotextile systems gradually decreased over time, and they were similar at the end of the experiment, with GR25 both less than 3.0. This indicates that there were no severe clogging of these two geotextiles. Variation of GR of nonwoven geotextile system over time.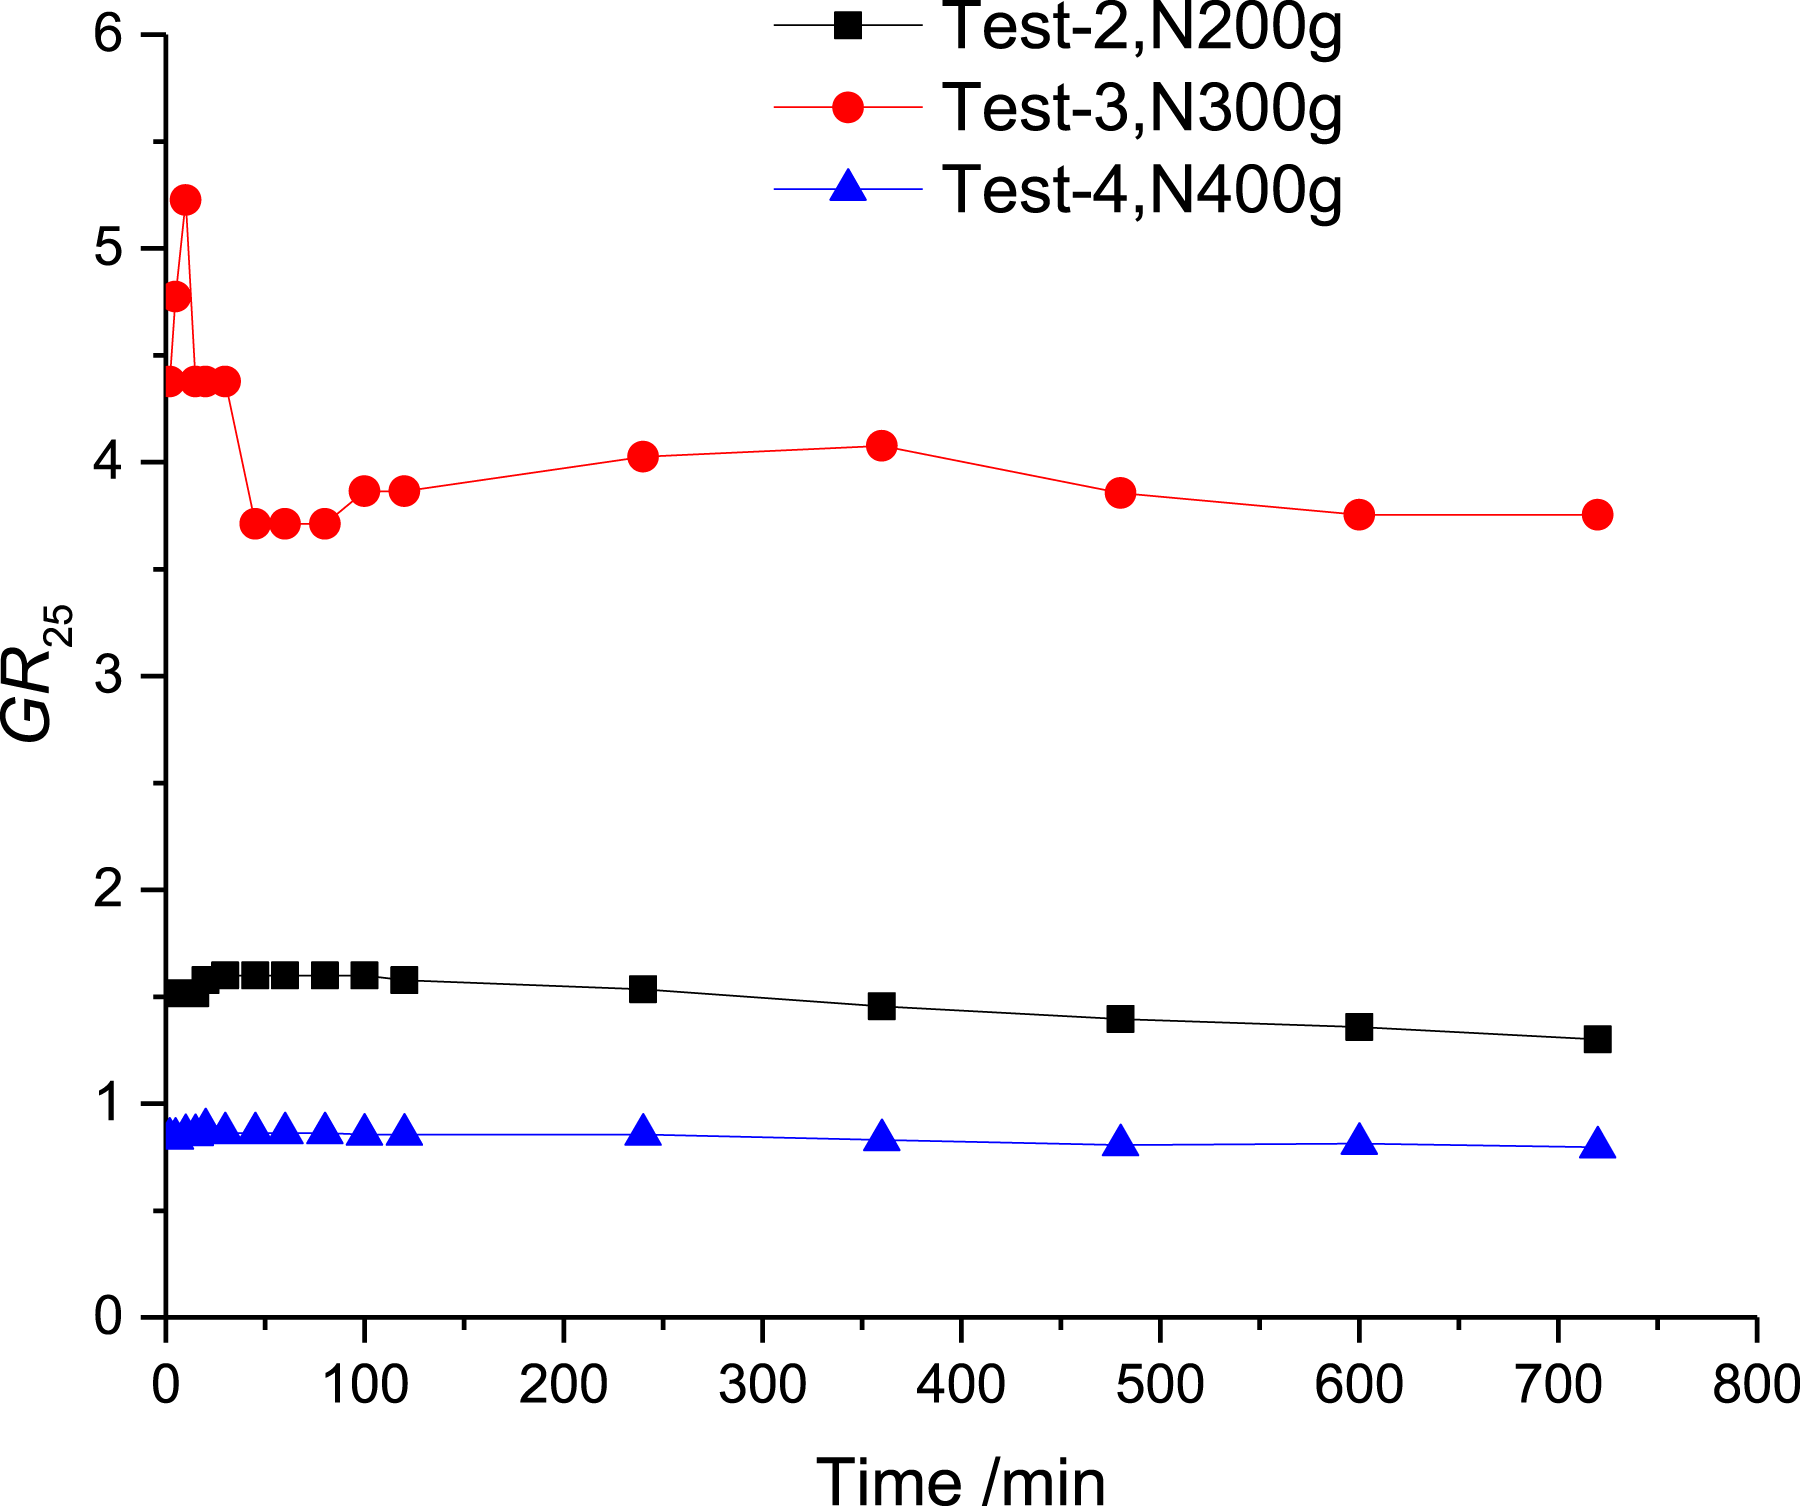
In the later stage of the experiment, the GR value of the 300 g/m2 nonwoven geotextile system tended to stabilize, with a GR25 of 3.75 at 720 min. The main reason for clogging of 300 g/m2 geotextile was the small pore size of the filter, which caused fine-grained sand to easily block on the surface of the geotextile or clog inside it. For the 200 g/m2 nonwoven geotextile, there was little variation in the GR value from 30 to 240 min, after which the GR value gradually decreased over time. This indicates the formation of a stable natural filter layer on the surface of the geotextile. The GR25 of 200 g/m2 nonwoven geotextile decreased to 1.30 at the end of the experiment, indicating no severe clogging compared to the 300 g/m2 nonwoven geotextile. This is mainly due to the larger pore size of the 200 g/m2 geotextile (O95 is 0.103 mm), which provides stronger anti-clogging ability.
For the 400 g/m2 nonwoven geotextile, the GR value was relatively stable during the experiment, less than 1.0. The GR25 of geotextile system was 0.80 at 720 min, lower than that of the 300 g/m2 nonwoven geotextile. Although the pore size of the 400 g/m2 geotextile was slightly lower than that of the 300 g/m2 geotextile, its thickness was greater. The thicker the geotextile, the more filtration paths it has. When a part of filtration paths of thick geotextile are blocked by soil particles, there are still abundant filtration paths for drainage. As a result, thicker geotextiles have a stronger resistance to physical clogging. 23 The results show that larger pore size and greater thickness within a certain range contribute to a stronger resistance to the physical clogging of nonwoven geotextile.
Flow rate
To ensure the smooth discharge of seepage water, the geotextile filter needs to meet the permeability requirement during usage. Figure 9 shows the variation of flow rates over time for geotextiles with different specifications in the experiment. It is observed that the 400 g/m2 nonwoven geotextile had the lowest flow rate, mainly due to its smallest equivalent pore size (0.043 mm) and permeability coefficient. Hence the pore size greatly affects the water permeability of the geotextile filter. In the early stage of the experiment, the flow rates of the 200 g/m2 and 300 g/m2 geotextiles were similar. After that, the flow rate of the 200 g/m2 geotextile was higher than that of the 300 g/m2 geotextile. Variation of flow rate of nonwoven geotextile filter over time.
The flow rates of the 200 g/m2 and 400 g/m2 nonwoven geotextiles changed little in the early stage of the experiment (0–120 min). After 120 min, both decreased gradually over time. The speculated reason is that in the initial stage of the experiment, the migration distance of fine sand particles under the action of seepage force was limited, resulting in little impact on the permeability of the entire sand sample. As the experiment progressed, fine sand particles continued to migrate, causing localized compaction in the sand sample. At the same time, part of the fine-grained sand was blocked on the surface of the geotextile or trapped inside it under the action of seepage force. These factors led to the reduction of permeability of the sand-geotextile filter system in the late stage of the experiment. At the end of the experiment, the flow rates for the 200 g/m2, 300 g/m2, and 400 g/m2 geotextile filter were 260 mL/min, 206 mL/min, and 192 mL/min, respectively. The flow rate of the 200 g/m2 geotextile was 35.4% higher than that of the 400 g/m2 geotextile. The larger the equivalent pore size of the nonwoven geotextile, the higher its drainage capacity. Compared to the 300 g/m2 and 400 g/m2 geotextiles, the filtration performance of the 200 g/m2 geotextile was better in preventing BEP.
Both the pore size and thickness of geotextiles play a significant role in their filtration properties for preventing BEP. The pore size of the 200 g/m2 nonwoven geotextile was the largest (O95 = 0.103 mm) among the geotextiles tested, and its stable GR value was 1.30 (less than 3.0), indicating no severe clogging occurred. In addition, it exhibited a larger flow rate compared to that of 300 g/m2 and 400 g/m2 nonwoven geotextile, demonstrating good filtration performance. The 300 g/m2 nonwoven geotextile had an O95 of 0.047 mm, and its GR value reached 3.75 by the end of the experiment, signifying significant clogging. Although the pore size of the 400 g/m2 nonwoven geotextile was small (O95 = 0.043 mm), its thickness was greater than that of the 300 g/m2 nonwoven geotextile. Consequently, its stable GR value was less than 3.0. The increased thickness of the nonwoven geotextile provides more seepage paths, resulting in stronger resistance to physical clogging, and Giroud arrived at the same conclusion when studying the filtration criteria of geotextiles. 23 However, due to the 400 g/m2 nonwoven geotextile having the lowest permeability coefficient, its flow rate was the lowest. Increasing the thickness and the pore size of the nonwoven geotextile within a certain range improves its filtration performance. 24
Influence of geotextile type on its filtration performance
To study the effect of the structure of geotextile material on the filtration performance of geotextiles used to prevent BEP, two types of geotextiles were selected for experimentation: a 200 g/m2 nonwoven geotextile and a 200 g/m2 plain woven geotextile (referred to as woven geotextile). As shown in Figure 10, the GR value of the woven geotextile was significantly higher than that of the nonwoven geotextile, and the gap between the two increased over time in the later stage of the experiment. This indicates that the clogging degree of the woven geotextile was much higher than that of nonwoven geotextile. Variation of gradient ratio of 200g nonwoven geotextile and woven geotextile systems over time.
In Test-5, the GR value of the system with the woven geotextile experienced a rapid growth before 100 min, reaching 7.08 at 100 min. However, from 100 to 120 min, the GR25 suddenly dropped to 5.73. After 120 min, the GR25 showed a slow upward trend. At the end of the experiment, the GR25 of the system was 6.69, significantly greater than 3, indicating severe clogging of the woven geotextile. On the other hand, in Test-2, the GR value of the nonwoven geotextile remained flat before 100 min, and then the GR25 gradually decreased to 1.30 (720 min), indicating no severe clogging in the nonwoven geotextile filter. Compared to nonwoven geotextiles, the main reason for the heavier clogging of woven geotextiles is that they have fewer pores and smaller aperture.
Figure 11 presents the variation of flow rate for the 200 g/m2 nonwoven geotextile and woven geotextile over time. From Figure 11, it can be observed that the flow rate of the nonwoven geotextile was significantly higher than that of the woven geotextile. After 100 min, the gap between the two further increased. At 720 min, the flow rate of the nonwoven geotextile was 260 mL/min, while that of the woven geotextile was 120 mL/min. The flow rate of the nonwoven geotextile was 117% higher than that of the woven geotextile. The reduction in flow rate for the woven geotextile was the result of combined effect of sand clogging and geotextile clogging. As the experiment progressed, the pore size of woven geotextile changed little due to the surface filtration mechanism, that resulted in reduced flow rate and increased GR value. The flow rate of woven geotextile dropped sharply at 120 min, and then it decreased lowly. However, the flow rate of nonwoven geotextile dropped more slowly compared to that of woven geotextile. During the test, the flow rate of the nonwoven geotextile decreased from 320 mL/min to 260 mL/min, with a decrease of 18.8%. While the flow rate of the woven geotextile decreased from 207 mL/min to 120 mL/min, with a decrease of 42%. Compared with the nonwoven geotextile, the woven geotextile exhibited a larger decrease in flow rate, indicating a more severe clogging. Variation of flow rate of geotextiles with different fibric types over time.
It is found that the geotextile type has an crucial influence on their filtration properties. 25 The plain woven geotextile experienced severe clogging during the experiment (GR25 = 6.69), leading to a significant decline in its drainage capacity, indicating that it was unsuitable for emergency rescue of dike BEP. At the end of the experiment, the flow rate of the woven geotextile decreased by 42%, and its flow rate was 53.8% lower than that of the 200 g/m2 nonwoven geotextile. Upon analyzing the magnified image of the woven geotextile after the experiment, it was observed that the main mechanism of physical clogging was fine sand blocking its horizontal water passages, reducing the water passage area. Additionally, this type of geotextile has a thin thickness, hence its permeability would be greatly affected once the limited water passages are blocked.
Clogging mechanism
Clogging mechanism for nonwoven geotextile
To analyze the clogging mechanism for nonwoven geotextile, pictures of the nonwoven geotextile were taken (Figure 12) after the test, and the distribution law of clogged particles on the nonwoven geotextile were observed using electron microscopy. The geotextile has been magnified 20 times in Figure 12. Due to the similar distribution law of clogged substances on the nonwoven geotextile in different tests, the geotextiles from Test-2 and Test-3 were selected for analysis as examples. It is observed that the amount of clogging particles on the surface of the 300 g/m2 nonwoven geotextile was higher than that of 200 g/m2 geotextile, which further confirmed that the 300 g/m2 geotextile experienced more seriously clogging. By the partially enlarged images, it is found that most of clogging particles were attached to the surface of the geotextile, with only a few embedded inside the geotextile. Images of nonwoven geotextile after test. (a) N200 in Test-2 (b) N300 in Test-3 (c) Partially enlarged image of N200 (d) Partially enlarged image of N300.
The geotextiles were dried and weighed after the test, and the mass of the 200 g/m2 and 300 g/m2 nonwoven geotextiles increased by 0.27 g and 0.55 g, respectively. The increase in mass of the 300 g/m2 nonwoven geotextile was larger than that of the 200 g/m2 geotextile. Overall, only a small amount of sand particles were attached to the surface or embedded inside the geotextile, with the increase in mass less than 1 g.
To further analyze the clogging mechanism of nonwoven geotextiles, the variation of permeability coefficient for different soil layers over time in Test-3 is presented in Figure 13, which could be used to analyze the changes in soil structure of different soil layers during the test. Based on Figure 13, it is found that the permeability coefficient of the nonwoven geotextile and 3 mm thickness soil layer below it was the lowest. Sand samples near the geotextile had a lower permeability coefficient, this indicates that clogging mainly occurred in the area near the geotextile filter layer. As the fine sand particles in the lower part of sand sample migrated upwards and accumulated near the lower surface of the nonwoven geotextile under seepage force action, forming a thin soil layer of low permeability, known as a filter cake.26,27 The filter cake reduced the permeability of the nonwoven geotextile and its adjacent area. Therefore, and the main reason for clogging in the nonwoven geotextile was the deposition of fine sand particles on the upstream surface of the filter layer, forming a thin layer of filter cake, rather than sand particles embedded inside the geotextile. Variation of permeability coefficient of soil layers with different thicknesses in Test-3.
Clogging mechanism for woven geotextile
Picture of the woven geotextile after the test is presented in Figure 14, the geotextile has been magnified 10 times. The plain woven geotextile has a thin thickness, and the water passage of the geotextile is the intersection of warp and weft yarns. Consequently, the water passages did not directly face the sand layer. It was observed that the clogged sand particles primarily accumulated at the horizontal water passages of the woven geotextile, thereby reducing the drainage capability of the woven geotextile. As physical clogging further developed, the clogged substances could completely obstruct the water passages of the woven geotextile, rendering the geotextile filter ineffective. Image of clogged woven geotextiles in Test-5.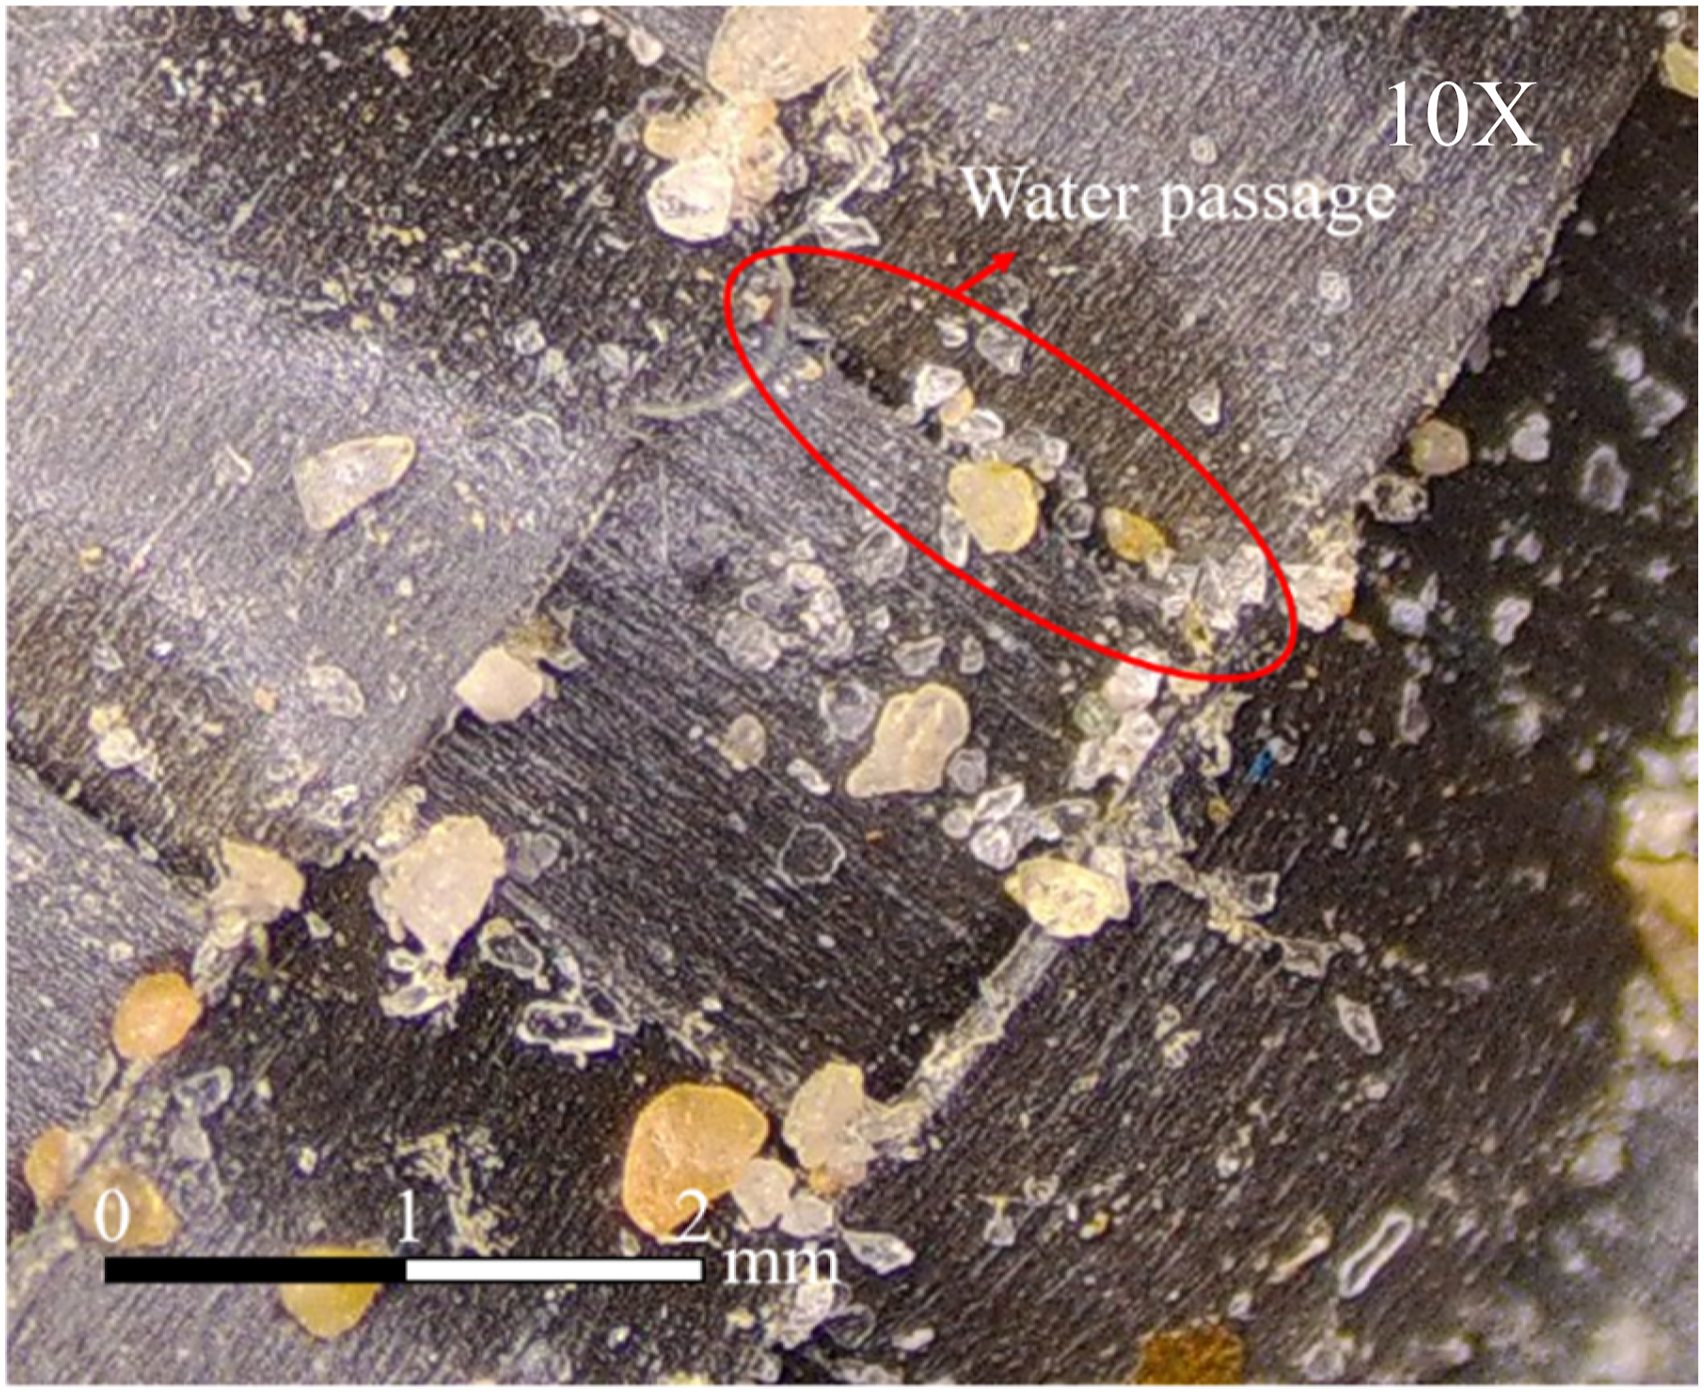
After the test, the geotextiles were dried and weighed, and the mass of the woven geotextile and nonwoven geotextile increased by 0.86 g and 0.27 g, respectively. The increase in mass of the woven geotextile was larger than that of the nonwoven geotextile, indicating more clogged particles in the woven geotextile. During the removal of geotextile material after experiment, clogged particles at the contacting surface of nonwoven geotextile will not stick to its surface, and only nonwoven geotextile will be removed without filter cake formed during the filtration. Whereas in woven geotextile, due to surface filtration, the particles get trapped at the interlaced yarn and comes along with the geotextile material while removing after the experiment, this could be the main reason for increased weight of woven geotextile. Based on the above experimental results, it can be concluded that the woven geotextile used in this study is prone to clogging in preventing BEP, making it unsuitable for emergency rescue of dike BEP.
Conclusions
In this work, the filtration performance of geotextiles used in emergency rescue of dike BEP were studied through indoor experiments, and the effectiveness of three nonwoven geotextile specifications and one woven geotextile in preventing BEP was assessed. Several main conclusions were obtained as follows: (1) Nonwoven geotextiles showed better filtration performance than woven geotextiles in emergency rescue of dike BEP. Among the geotextiles tested, the 200 g/m2 nonwoven geotextile demonstrated best filtration performance in medium sand. Increasing the thickness and pore size of nonwoven geotextiles within a certain range enhances their anti-clogging ability. (2) The nonwoven geotextile with an equivalent pore size of 0.047 mm was clogged. Clogging particles were mainly distributed on the surface of the nonwoven geotextile rather than inside it. The main clogging mechanism for nonwoven geotextile was the deposition of fine sand particles on its surface, forming a thin layer of soil with low permeability. (3) Plain woven geotextiles experienced severe clogging with a 42% reduction in flow rate, making them unsuitable for emergency rescue of dike BEP. The main reasons for clogging of woven geotextiles were the few pore numbers per unit area and the surface filtration mechanism. (4) If experiments are conducted with more geotextile samples, more comprehensive conclusions can be drawn. It is recommended that future studies could explore the filtration performance of the composite filter during BEP rescue using new methods such as 3D imaging technology.
Footnotes
Acknowledgements
Thanks to AI model of Chat GPT 3.5 for its assistance in refining language.
Declaration of conflicting interests
The author(s) declared no potential conflicts of interest with respect to the research, authorship, and/or publication of this article.
Funding
The author(s) disclosed receipt of the following financial support for the research, authorship, and/or publication of this article: This work was supported by the National Natural Science Foundation of China under grant No. 52179100 and grant No. U2240210.