
Abstract
Solid particles in a suspension can be separated effectively through cake filtration where the filter medium is decisive particularly during the initial stage when particle breakthrough can be high. To improve the filtrate quality and throughput, filtration aid additives are used, which are known to alter filter cake structure and thus reduce flow resistance but, in forming clusters, also stabilize fine particles that would otherwise pass through the filter (cake) easily. However, filter aids are costly, increase the complexity of the system and may have adverse effects for subsequent mechanical drying and washing. Instead of supplying additives, four alternative filter media were tested exhibiting an open, three-dimensional structure that reached deeply into the depth of the forming filter cake. An aqueous limestone suspension was investigated in a conventional laboratory test unit. Composite filter medium set-up delivered up to 15% faster filtration. The results indicate that the fiber structures give better performance that reach far into the cake and are oriented not only axially but also radially. In contrary to the initial hypothesis that an axial fiber structure would produce additional drainage channels along the surface of these fibers and thus support but deliquoring, the actual deliquoring performance with air blowing appeared to be slightly less efficient. Although not investigated yet, cake discharge with a 3-D filter layer present poses an additional challenge, rendering the concept of composite filters unpractical.
Introduction
Filtration is widely used to separate solid particles from a liquid fluid. Filtration can be further subdivided into press filtration, cross-flow filtration, depth, surface and cake filtration. They all have in common that a filter medium is present, which allows the fluid to pass through whereas the particles are either collected in the filter medium structure or on top of the filter medium. While depth filtration targets a particle free filtrate, cross flow filtration may result in a retentate with an increased solid concentration (thickening) and cake or surface filtration are often employed to obtain the solid particles with minimum fluid content. To improve filter cake dryness, the filter cake may be exposed to mechanical pressing and/or gas blowing. Mechanical pressing aims for a minimization of the void volume of the filter cake to be filled with fluid whereas gas blowing is preferentially driven by a displacement of the liquid by gas. For driving the filtration, a pressure difference across the filter is provided which augments with increasing filter loading, cake compression or cake thickness [1].
Cake filtration is often operated at a constant pressure difference. Consequently, the flow resistance increases with increasing cake thickness, which is compensated by a decreasing rate of throughput. Cake formation may be followed by cake deliquoring through cake blowing and finally cake discharge to restore the starting situation, allowing for semi-continuous operation. In an attempt to optimize overall operation, the filter medium and specific cake resistance shall be low without compromising filtrate quality by high solid particle breakthrough. The gas deliquoring shall be fast and effective, i.e., low gas consumption and yet low residual moisture of the filter cake. Cake discharge shall be easy and thorough while, at the same time, the functionality of the filter medium shall remain unaltered [2,3].
Various filtration aid materials are added to improve the overall cake filtration process, e.g., providing a pre-coat material for the filter medium to avoid rapid filter clogging and to improve the filtrate quality, and by adding mineral or organic (e.g. polymeric flocculants, cellulose fibers) materials (as body-feed) to influence the filter cake formation and reduce flow resistance through the filter cake [4–6]. However, added materials are intrinsically alien materials and as such maybe unwanted in the system. Moreover adding these materials adds to a complexity of the filtration process and increases costs both in investment as well as for operation. Sometimes measures can be utilized by optimizing the overall separation design, careful selection of operating parameters and using tailored filter media reducing and maybe eliminating the need of using filtration aid materials [7,8]. Alternatively, specially designed (composite) filter materials are reported to improve filtration performance by reducing filter media blockage and improved filtrate quality [9–12]. Different woven or non-woven filter media have been tested for press filtration [13,14].
In this paper, using various 3-D structured filtration media on top of a conventional woven filter medium, solid/liquid separation experiments for a limestone suspension were carried out, aiming to improve the filtration efficiency without aid additives. A specially designed (composite) filter cake was formed and subsequently deliquored by gas blowing. The experimental results were fitted by Darcy’s law, interpreted by both the flow resistance data and finally correlated with 3-D structural data.
Experimental part and data evaluation
Set-up and procedure
Filtration tests were performed with a pressure filter setup as recommended by [15] but additionally equipped with a stirrer with the attempt to reduce the influence of particle segregation and sedimentation [16] and to mimic the large-scale situation of a disc or drum filter better, where the suspension is kept agitated [17]. Experimental tests with and without the stirrer were performed.
In Figure 1, a cross-section of the bottom part of test device is displayed together with the characteristic dimensions. The effective filter diameter was dF = 26 mm giving a filter area AF = 21.24 cm2. The distance hR between the bottom end of the shaft and the filter medium surface was varied between 1 to 5 cm. Since the influence of the distance hR on the cake formation was found not to be significant – at least at a rotational speed of 300 and 600 min−1 – a distance of 1.5 cm was chosen. (Experiments 31 to 46, which are not reported here.)
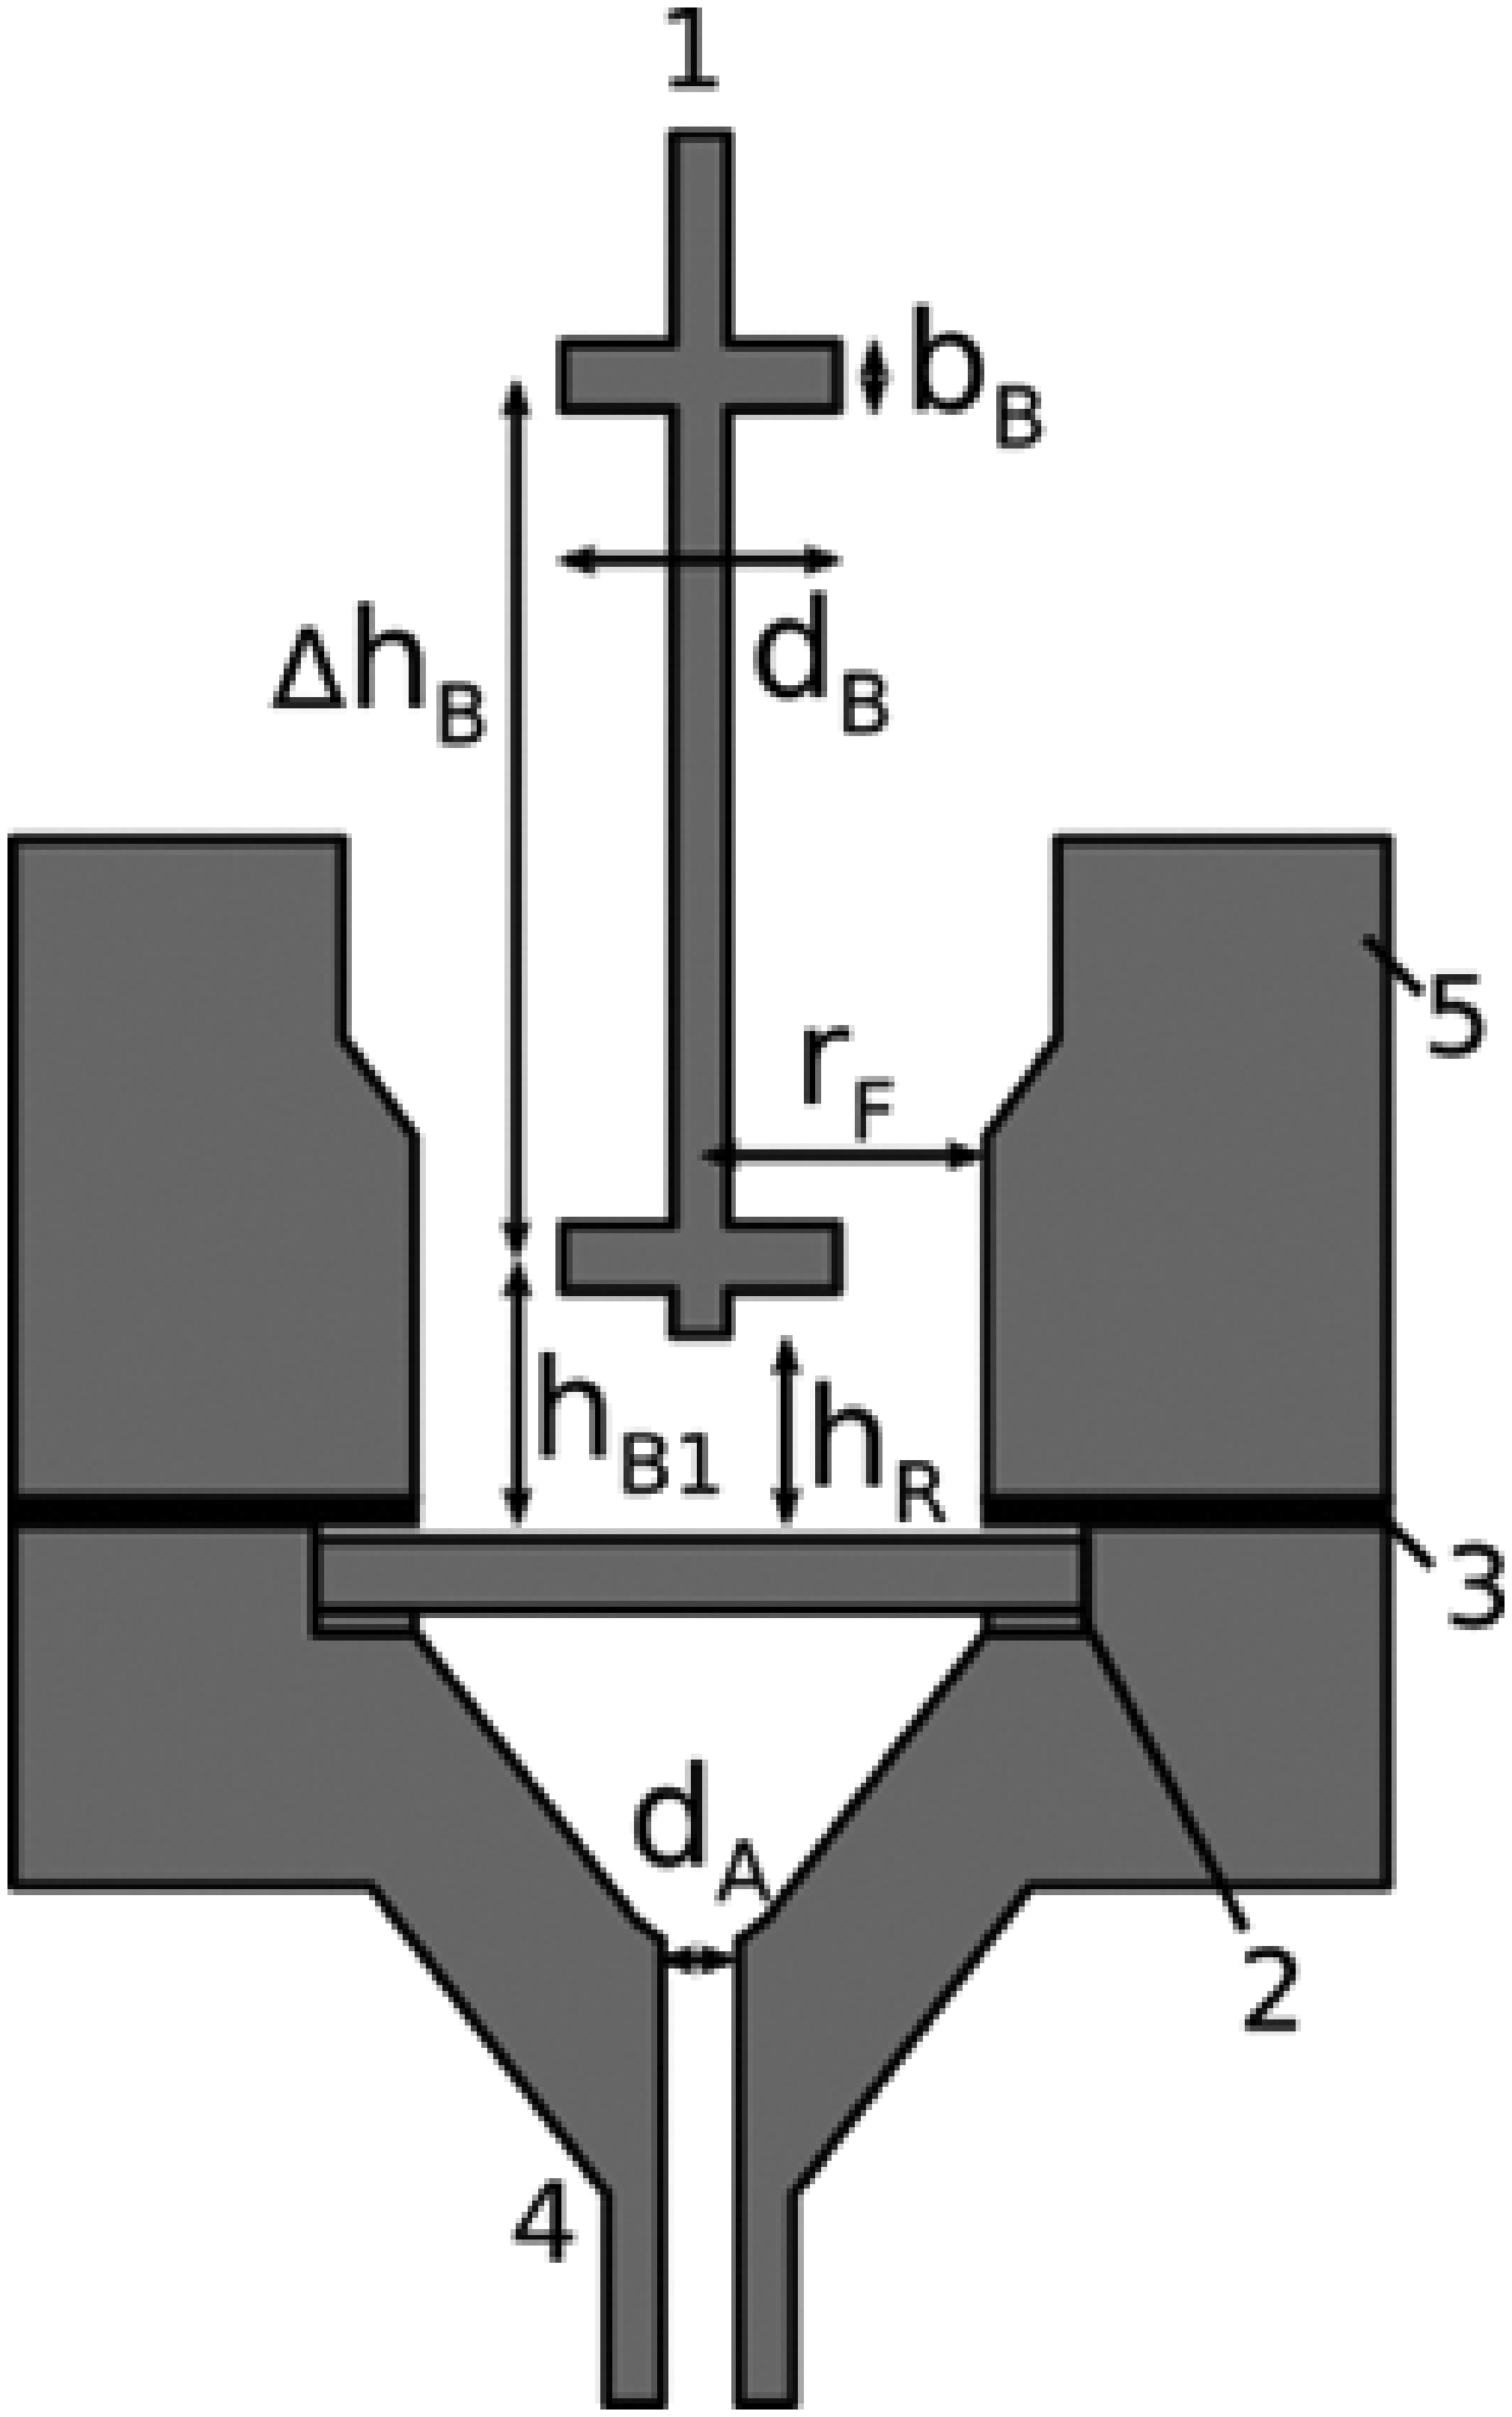
Cross-section of the bottom part of the experimental setup: blade agitator (1), perforated filter medium support, filter medium and support (2), washer (3), cone with valve and exit (4), suspension container (5).
After assembling the bottom part and closing the valve of the bottom filtrate outlet, the top plate was screwed tightly to the suspension container. The stirring shaft with the agitator blade at the bottom was positioned centrally and it exited the top plate through a double acting sealing gate. The shaft was connected with the stirring motor. The top plate had two additional openings, one where the air pressure line was connected and one where the suspension was fed into the cylinder through a rod-guided funnel.
Once all of the suspension was introduced into the cylinder, this feed port was closed and the bottom valve was opened and from this time onwards filtrate was collected on the scale, initially only driven by the hydrostatic head but once the cylinder was pressurized also through imposed pressure difference. At the same time, the stirrer was turned on to keep the suspension homogenized. After at least 1 minute, the cylinder was pressurized (0.75 bar gauge), i.e., the pressure induced filter cake formation stage was initiated.
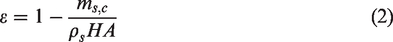
The filtrate weight and pressure difference were measured over time. Without interruption, the filter cake formation process was followed by deliquoring through air blowing. The experiment was terminated after approximately 25 seconds of deliquoring. Thereby the air flow was stopped, the motor of the stirrer was turned off, and the pressurized chamber was vented through a venting valve on top of the chamber. The bottom part of the filter cell was dissembled and the cake thickness was measured, which was difficult since the filter cake surface was not flat due to the turbulent flow caused by the stirrer. Moreover, a sample of the filter cake was taken where the weight was measured before and after thermal drying in a drying oven at 105°C to determine the residual moisture of the filter cake [18] according to

Where the indices t and f denote the thermally dry and mechanically deliquored filter cake sample.
In a series of pre-tests the reproducibility was checked and a standard deviation of approximately 8% was calculated based on cloth resistance parameter. Balance errors were calculated and found to be significantly below 1% (except for one outlier). For each set of parameters at least two independent experiments were performed.
In Figure 2, the transient cumulative filtrate is depicted schematically for a typical experimental run. Thereby the time to denotes the start of the experiment where the suspension is poured into the vessel. The time span between to and tc,s signifies the time until the lid of the vessel is closed and the air pressure hose is connected. During this time-period, some filtrate is obtained on the downstream scale, which can be attributed to mere gravitational drainage. This gravitational drainage period shall be termed 1st stage of cake formation. At the time tc,s the vessel is pressurized which results in a higher rate of filtrate (shown by a more pronounced increase of the cumulative filtrate quantity. The extrapolated (dashed) line towards tc,o is obtained by application of the filtration model given in equation (5). This time is the hypothetical filtration start time if the introduction of the suspension, closing the vessel and pressurizing the vessel would have occurred instantaneously. The time span from this hypothetical start time until the filter cake is formed, namely at tc,e is termed filter cake formation time tc. This cake formation under elevated pressure shall be termed 2nd stage. The end of cake formation is optically identified when the free liquid on the surface of the filter cake has vanished and the filter cake is still fully saturated (S = 1) which is linked to the cumulative filtrate quantity obtained hitherto, i.e., Vf,c,e. Since the deliquoring by gas blowing is immediately following the cake formation, the end time of cake formation collapses with the start time of deliquoring, i.e., td,s. This also holds for the cumulative filtrate volume, i.e., Vf,c,e = Vf,d,s. Deliquoring by gas blowing is sustained until time td,e, i.e., the pressure in the vessel is kept constant. At time td,e the pressurized vessel is vented instantly and no further filtrate is collected thereafter. That means that Vf,d,e is the final total cumulative filtrate quantity comprising of filtrate obtained during cake formation and cake deliquoring. The time span td which is the difference between td,e and td,s gives the total duration for deliquoring by gas blowing.

Schema of transient filtrate Vf: at time t0 the filtrate started to arrive on the downstream scale, at tc,s the vessel was pressurized and at tc,e cake formation was finished and at the same time also deliquoring started and at td,e deliquoring was terminated.
Materials – Suspension and filter media
Limestone was used as a solid material with a mean particle size of 36.15 µm and a solid density of ρS = 2700kg/m3. The particle size distribution was measured by laser diffraction (Helos Sympatec) and it is given in Figure 3. Besides of particle size distribution many other parameters are relevant to fully characterize a suspension in terms of its filterability [19]. Tap water was used (ρL = 1000kg/m3) for making the suspension with limestone. (Details about the solid concentration of the suspension are given in Tables 2 and 3.) The viscosity of the filtrate is given by η = 0.001 Pa s. The filter cake porosity is calculated by using geometric data, mass balance and densities of constituents, which gives

Particle size of limestone – cumulative (left ordinate) and density (right ordinate) distribution function where the mean particle size is related to 50% of the cumulative particle size.
Filter media.
Experimental and calculated data – influence of stirrer.
Experimental results all performed with a stirrer rotational speed of 300 min−1.

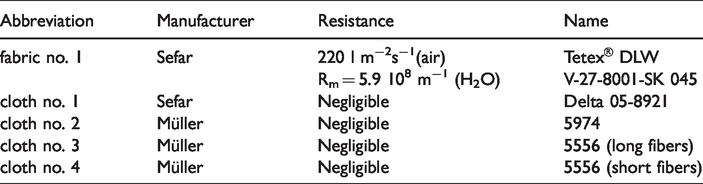
For the experiments different filter media were used, as listed in Table 1. In this table, the manufacturer as well as the commercial brand identification are provided. In the column that refers to resistance, measurements of the fabric no. 1 give an air resistance of 220 l m−2s−1, which is measured at 20 mm water gauge according to the standard. The filter medium resistance Rm is calculated according to equation (3) with Rc = 0. (The other cloth materials showed negligible flow resistance.) Fabric no. 1 was a regular filter medium whereas cloth no. 1 to no. 4 represented the open top support structures. Pictures of the various filter cloths are shown in Figure 4. Cloth no. 1 was a typical drainage material (polypropylene) to support filtrate flow downstream the filter medium. The fiber thickness is around 200 µm. Cloth no. 2 to 4 were the synthetic materials used in cushions and mattresses. The top mesh of cloth no. 2 was cut off to obtain a filter structure of around 70 fibers per cm2 with a vertical length of 10 mm. The fibers were connected pair-wise on a bottom support mesh. With a filter density of around 100 #/cm2, cloth no. 3 and 4 differed by their fiber length only, which were approximately 7 mm and 3 mm, respectively. The fibers are connected on a bottom support structure and they reach vertically upwards. The original filter medium of cloth no. 3 & 4 is symmetric with respect to top and bottom layer, holding the interstitial connecting fibers. After fixing the support on one side on a plane table, only small bundles of fibers were cut with a pair of sharp scissors at a time. The pair of scissors was kept at defined distance with a distance support. With one cut, both samples, i.e., 3 & 4 were available at the same time.

Pictures of cloth no. 1, 2 and 3.
Results and discussion
Two series of experiments were performed, one that elucidates the influence of the stirrer on cake formation and the other one that shows whether an additional top layer of a filter cloth has an influence on cake formation and deliquoring, respectively.
Experimental data are evaluated based on Darcy’s law [15] accounting for the two different stages, i.e., filtration by the hydrostatic head (1st stage) followed by the externally imposed pressure (2nd stage). With this model the flow through porous media, i.e., flow at very low Reynolds numbers can be described where the velocity is directly proportional to the pressure difference [20].
Where A and η denote the filter area and the dynamic viscosity of the filtrate, respectively; Rc and Rm denote the resistance of the filter cake and filter medium, respectively. As is well known, the filter media resistance Rm is significantly higher than the value obtained for mere fluid flow without actual filter cake formation, i.e., as is obtained by the medium fluid flow test. This is explained by the immediate formation of a layer of particles on the filter medium and in part by experimental handling where the start of the filter is not very well defined in terms of instantly set pressure difference and time correlated filtrate quantity measurement. Under ideal conditions the filter cake resistance rises linearly with the cake height H
Where
In turn, the filter cake height H is linked with the cumulative filtrate volume Vf by mass balance. For the situation of a constant pressure difference, Darcy’s equation can be solved and rearranged to give the cumulative filtrate volume.
By fitting this equation to experimental data, the values a and b can be obtained be least square root error minimization routine. Since the fluid viscosity η, the pressure difference Δp, the volumetric solid concentration of the suspension
Influence of stirrer on filtration
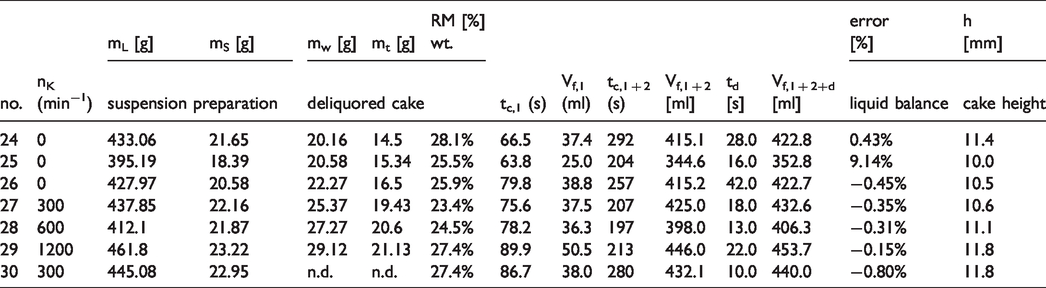
After the pre-tests, tests were performed without the stirrer in operation and with different stirrer rotational speeds as listed in Table 2. For the experiments 24 to 30, the operating parameters are listed, i.e., the number of rotations of the stirrer nK, the constituents of the used suspension, water and limestone. Moreover also the analyses results of the sample of the deliquored cake before and after thermal drying which enables the calculation of the residual moisture RM of the filter cake. Data about time t and corresponding cumulative filtrate volume V are also given and their meaning can be extracted from Figure 2. The liquid balance error is calculated by comparing the liquid supplied through the suspension mL and the liquid that collected cumulatively as filtrate Vt,d,e and the remained in the cake as residual moisture after deliquoring mf. Except for experiment no. 25, the balance error is below 1%, which is excellent. Please note, that the average cake height was calculated from mass balance except for experiment no. 30, which is a measured value.
In Figure 5, the resistance parameters are displayed over the stirrer rotational speed. While the specific filter cake resistance parameter remains about constant for the 1st stage, it increases by approximately a factor of two in the 2nd stage. On the other hand, the apparent filter medium resistance increases by a factor of approximately two in the 1st stage but decreases by a factor of 2 in the 2nd stage.

Resistance parameters of 1st and 2nd stage over rotational speed. (The data points next to those indicated by a star relate to test no. 30 where the suspension was stirred during the 1st stage but once pressurized, i.e., 2nd stage, the stirrer was shut off.).
The apparent filter medium resistance value Rm of the 2nd stage is the consequence of the situation during the 1st stage expressed by both resistance parameters, i.e., by the filter medium resistance of the 1st stage together with the filter cake resistance that has been formed during the 1st stage. This gives the apparent filter medium resistance Rm,a
Thus, Rm,a was expected to be slightly rising or constant, which was, however, decreasing. A possible explanation can be found when assuming that the filter cake builds up differently with changing number of rotations during the 1st stage. Subsequently, when the pressure difference increased, the already formed cake changes its structure (generally becoming more compact). These changes become more pronounced with increasing number of rotations which is shown in Figure 6 by showing the deviation D which is calculated by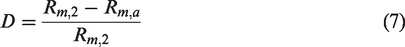

Deviation D (between the apparent overall resistance of the first stage and the fitted filter medium resistance of the 2nd stage) is displayed over the number of rotations. (The data point next to the one indicated by a star relates to test no. 30 where the suspension was stirred during the 1st stage but once pressurized, i.e., 2nd stage, the stirrer was shut off.).
When the stirrer was only active during the 1st stage (see experiment no. 30), the deviation but also the individual resistance values of the 2nd stage are comparable with the situation when the stirrer was not in operation at all. It is suggested that sedimentation effects occur while filling and pressurizing the filter cell seems to have little to no effect on the subsequent filtration experiment.
According to Table 2, the calculated residual moisture of the deliquored cake and the calculated cake porosity are displayed over rotational speed, as is shown in Figure 7.

Residual moisture of deliquored filter cake and cake porosity over the rotational speed. (The data point next to the one indicated by a star relates to test no. 30 where the suspension was stirred during the 1st stage but once pressurized, i.e., 2nd stage, the stirrer was shut off.).
In Figure 7, a minimum value of both the cake porosity and the residual moisture is found with the rotational speed at around 300 min−1, giving the lowest cake porosity as well as the lowest residual moisture. It is assumed that mixing during the 1st stage and no stirring during the 2nd stage does not show any effect on cake porosity or residual moisture.
Influence of 3-D structure filter media on filtration
The influence of 3-D structure filter media on filtration was investigated under experimental conditions with hR = 1.5 cm and a rotational speed of 300 min−1. This setting was chosen because it gave the lowest residual moisture.
The reference test was carried out with only the basic layer made of fabric no. 1 cloth. All the others had an additional top layer of a filter cloth. Experimental parameters and results are listed in Table 3.
In Figure 8, the resistance parameters as fitted are shown for all experiments. The apparent filter medium resistance parameters were approximately the same no matter that an additional cloth layer was present and which type of cloth layer was used. This was also found for the specific filter cake parameter αH for the 2nd stage. But for the 1st stage, the specific filter cake resistance parameter αH was significantly higher without a cloth and – to smaller extent – for cloth no. 4. It was indicated that the filter cake was built up differently though only during the initial cake formation stage.
Resistance parameters (cake and filter medium) for different experiments as indicated in Table 3. (Exp. no. 49 has been identified as an outlier with respect to the 1st stage as the values, particularly the specific filter cake resistance, are significantly different compared to all others as well as exp. no. 50 which was performed with the same settings.)
In Figure 9, the residual moisture of the deliquored filter cake was plotted against the filter cake porosity. Data are associated with large scatter without a clear trend. Even when taking the mean values of the experiments performed under the same settings, the scatter persists. The results of the averaged pairs show that at least in terms of residual moisture, cloth no. 3 & 4 perform worst, whereas the other cloths 1 & 2 give similar results compared with the situation without an additional layer. But when plotting the saturation over the porosity a clear tend is apparent visualized by a linear trend line, i.e., with increasing cake porosity the saturation of the deliquored cake becomes lower. In other words, a more porous filter cake after cake formation will result in the same final cake dryness though more liquid is – and seemingly can be – removed during the deliquoring stage, at least, for adequate deliquoring times.

Residual moisture and saturation over the cake porosity.
In Figure 10, the transient saturation curves are depicted where the symbols indicate when the deliquoring stage was terminated experimentally. Saturation levels were approximately constant after less than 20 seconds indicating that deliquoring by mechanical displacement principle was already finished. Thus a prolongation of the deliquoring stage would not have resulted in a significantly lower residual moisture.

Transient deliquoring curves where the final saturations are indicated by symbols, i.e., when the experiment was terminated.
These experimental curves were fit by the equation suggested by [21] where the left-hand-side resembles a dimensionless reduced saturation level [22].
Where S∞, a and b denote the final saturation level obtained by mechanical deliquoring, and constants, respectively. The parameter K is a function of the pressure difference, the filter cake height, fluid viscosity, cake porosity, time and the saturation pressure, which implicitly depends upon the final saturation level. When rearranging this equation it gives
Where -b was replaced by
The curves depicted in Figure 10 are fitted by equation (9) and the obtained parameters are displayed in Figure 11. Clearly all three fitting parameters n, a+ and S∞ are linked but while S∞ dictates the value at long deliquoring times, the parameter n decides on the curvature while a+ has a strong impact on early rate of deliquoring. For maximizing throughput, equilibrium saturation is often not achieved since deliquoring time is shortened. Therefore the parameters a+ and n are more relevant. In this context, a large value of a+ and small value of n are favored. Also from this point of view, the setups without a covering cloth and those with cloth no. 1 or 2 are to be preferred over cloths 3 & 4.

Fit parameters (equation (9)) of transient saturation curves shown in Figure 10. (Numbers relate to exp. no. as listed in Table 3.)
Conclusions and outlook
Filtration medium of cloth no. 2 exhibited a significantly faster filter cake formation (around 15%) compared to other 3-D structured filter medium as well as the reference filter without a 3-D layer. Cloth no. 2 had a structure that reached well into the depth of the filter cake filter structure with a vertical length of 10 mm and around 70 fibers per cm2 while cloth no. 1 was rather thin. While cloth no. 2 and 4 had similar axial expansions, cloth no. 4 (as well as cloth no. 3) had a fiber structure that was regularly aligned vertically, whereas cloth no. 2 had an angled structure reaching not only in axial but also in radial directions. In contrary to the initial hypothesis that an axial fiber structure would produce additional drainage channels along the surface of these fibers and thus support both filter cake formation and subsequent deliquoring, the performance was generally worse. During the deliquoring stage, cloth no. 2 performed less favorably when considering the rate of deliquoring though the final filter cake dryness was comparable to those with cloth no. 1 and without a cloth layer. Again, cloths no. 3 and 4 did not perform significantly better.
Compared with the mere filter medium, the setup with cloth type no. 1 & 2 produced a filter cake exhibiting a lower filter cake porosity, which is directly proportional to the residual moisture at full saturation. Consequently, less liquid needs to be removed from the filter cake during deliquoring stage to arrive at the same final residual moisture.
The selected suspension – limestone dispersed in water – is easily filterable and does not necessarily require filter aid materials. Consequently, any benefit of 3-D structures filters would have displayed only marginally. Moreover, variations between experiments are unavoidable and the significance of trends are easily blurred in the data scatter. Thus a different suspension should be selected where filter aid material would show a significant impact on the filtration performance.
Unless other systems show a more pronounced improvement in cake formation and/or deliquoring, 3-D top layer filtration medium do not seem to be practically useful since they add additional costs to the system and cake discharge after cake formation and deliquoring will be significantly more difficult. But the concept may still prove viable when the constituents of the suspensions must not be contaminated with alien substances.
Footnotes
Declaration of conflicting interests
The author(s) declared no potential conflicts of interest with respect to the research, authorship, and/or publication of this article.
Funding
The author(s) received no financial support for the research, authorship, and/or publication of this article.