
Abstract
The use of 3D printers is expanding across various industries. The incorporation of reinforcing fibers and structures, such as negative Poisson, has the potential to enhance the mechanical properties of three-dimensional products. In this study, a specialized nozzle is developed for 3D Fused Deposition Modeling (FDM) printers dedicated to the production of continuous fiber-reinforced thermoplastic (CFRT) composites. The primary objective is to enhance the tensile strength and impact resistance of 3D-printed samples. It is achieved through the investigation of strategies such as fiber reinforcement, variation in the number of fibers within the reinforcing yarn, and the creation of samples featuring an internal structure with a negative Poisson’s ratio (NPRS). In this regard, four types of 3D samples are prepared including polymer only, polymer with a negative Poisson’s ratio structure, polymer reinforced with continuous fibers (glass and carbon fibers), and polymer reinforced with continuous fibers featuring a negative Poisson’s ratio structure. The mechanical properties of these samples, including tensile strength and impact resistance, are also compared. The results indicate that incorporating fibers as reinforcement can enhance the mechanical properties of 3D-printed products. Moreover, continuous fibers with more fibers within the same yarn count have an increased strengthening effect. The use of negative Poisson structures significantly improves impact resistance but adversely affects tensile strength.
Keywords
Introduction
In today’s world, due to the personalization of consumer devices and equipment and the need for structures with greater accuracy and delicacy, the use of 3D printers is on the rise. The applications of these printers are extensive, ranging from small and sensitive dimensions such as artificial veins in tissue engineering to large-scale projects like building construction.1,2 Consequently, with their growing significance, 3D printers become increasingly prominent in human daily life. To enhance production speed, improve mechanical properties, and increase production flexibility, numerous studies have been conducted, especially in the field of textiles. 3 Despite these efforts, more research is still needed to further explore the potentials of 3D printing technology.
One of the challenges involved in production through the FDM method and other polymer-based methods is the often inadequate mechanical properties of the final product. In many cases, this limitation confines the product to being used solely for modeling and testing purposes, preventing its utilization as the final industrial part. A viable solution to enhance the strength of polymers is the incorporation of high-strength fibers as reinforcement in the polymer matrix.4–7 Reinforcing fibers can be nanofibers, short fibers, or continuous fibers. In a study by Block et al. 8 continuous fiber printing and short fiber printing were assessed as two different methods of composite 3D printing. They were compared in terms of mechanical properties, part quality, and printing versatility. Another way to increase the strength of 3D parts by the FDM method is to change the parameters of the production process and the internal layering arrangement in the production process. 9 Structures with a negative Poisson’s ratio can serve the purpose in this case. They are represented by auxetic materials. 10 These materials, when stretched in the longitudinal direction, become thicker in one or several perpendicular width-wise directions. An auxetic structure can improve properties such as the energy absorption ability and fracture toughness of materials.11,12 Among various auxetic structures discovered, re-entrant honeycomb has been investigated frequently by many researchers. As reported, those structures have improved flexural strength and impact resistance.13,14
This study investigates the use of the FDM method to produce 3D composites reinforced with continuous glass and carbon fibers. To this end, three types of glass fibers with different numbers of fibers in the same yarn count were used to evaluate the effect of the number of fibers on the mechanical properties of fiber composites. A nozzle that could feed continuous fibers was designed to create composite samples. Three-dimensional samples were prepared with glass and carbon fibers as reinforcement, and both positive and negative Poisson structures were investigated. Subsequently, the mechanical properties of the samples were compared.
Experimental
Materials
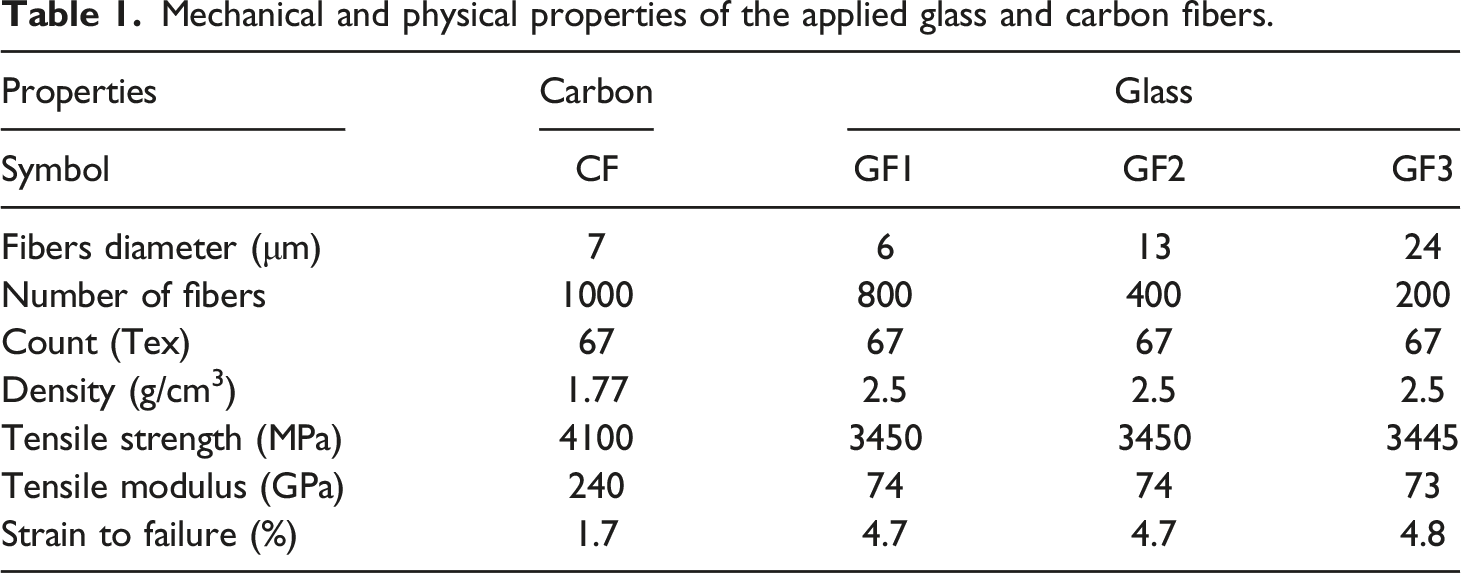
Mechanical and physical properties of the applied glass and carbon fibers.
Nozzle design
The nozzle designed in this research is an upgraded version of the common FDM 3D printer nozzle with a fiber-feeding part added to it. The designed nozzle replaced the original nozzle of the device, which can move in x, y, and z directions. The polymer filaments were guided into the hot chamber of the nozzle by guide rollers and a stepper motor. After melting, the molten polymer came out of the nozzle. There was a pathway for feeding the fiber into the nozzle, ensuring that, as the polymer exited the nozzle the fiber would be positioned in the center of the polymer stream and emerge from the nozzle simultaneously.
The fiber feed was negative, meaning it would be drawn to the outer part of the nozzle through contact with the molten polymer. To facilitate the fiber exit, a pair of feed and guide rollers was installed at the nozzle inlet. These rollers assisted in unwinding the fiber from the bobbin, thus minimizing the risk of the fiber getting stuck in the nozzle inlet and ensuring smooth fiber feeding. In addition, the reinforcing fiber was heated before being combined with the polymer in the initial segment of the nozzle, improving the adhesion between the fiber and the polymer. The nozzle designed for the production of the samples is schematically shown in Figure 1. Schematic display of the designed nozzle.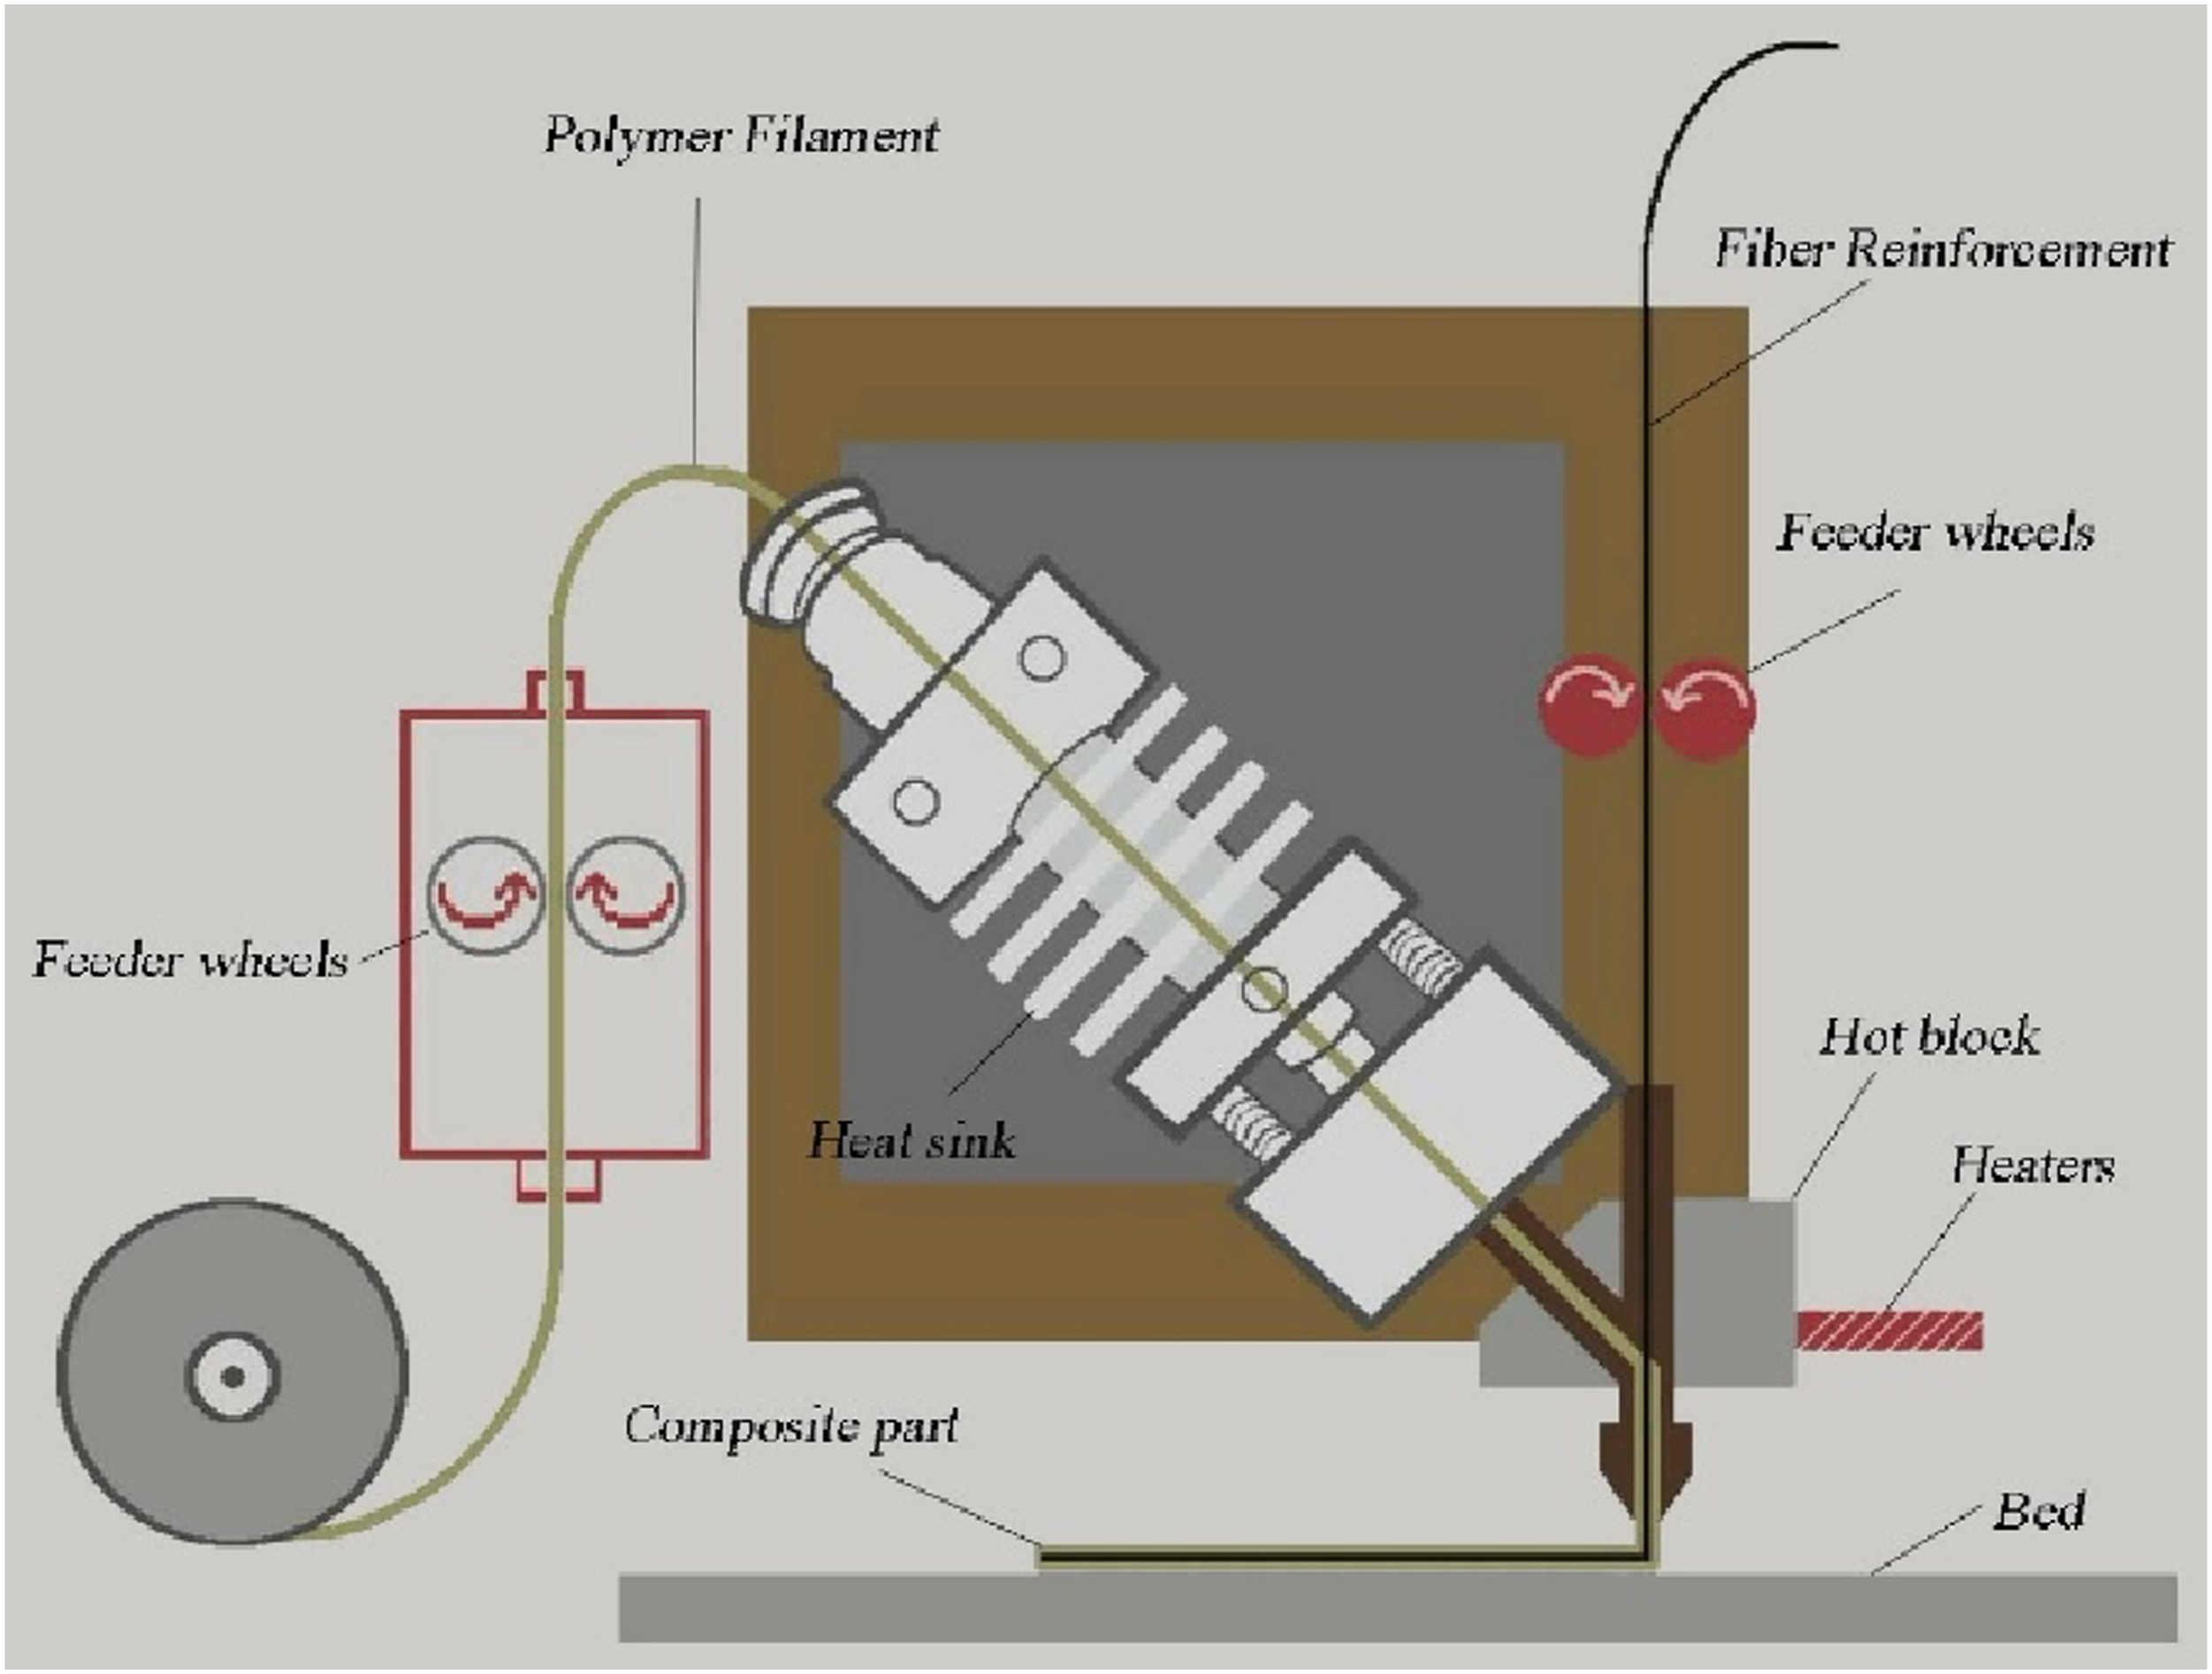
Preparation of the samples through 3D printing
The geometry of the test specimens was created using the Sketch Up 2022 software. It was then exported as a Stereo Lithography (STL) file and imported into a 3D printer slicing software package, namely ‘Cura,’ where the processing parameters were adjusted. Production parameters such as nozzle temperature, printer speed, layer height, filling percentage, and wall thickness, can be adjusted by the Cura software or other slicer software programs, and the G-code, which is the output of the software, is sent to the 3D printer. To produce pure polymer samples, the nozzle diameter, the printer speed, and the layer height were set to 0.4 mm, 25 mm/s, and 0.3 mm, respectively. In contrast, to manufacture 3D composite samples reinforced with fibers compared to a pure polymer, the speed of the nozzle movement was decreased to allow sufficient time for solidification and, consequently, the necessary fiber tension. Also, due to fiber feeding, the diameter of the nozzle and the height of the layers increased. Therefore, to produce composite samples, the nozzle diameter, the printer speed, and the layer height were adjusted to 2 mm, 5 mm/s, and 0.5 mm, respectively. Based on the PLA filament manufacturer’s recommendation, the nozzle temperature was set to 215°C, and the printer bed was adjusted to 60°C. The infill density and the wall thickness were also set at 99% and 0.8 mm, respectively.
The structure of the samples
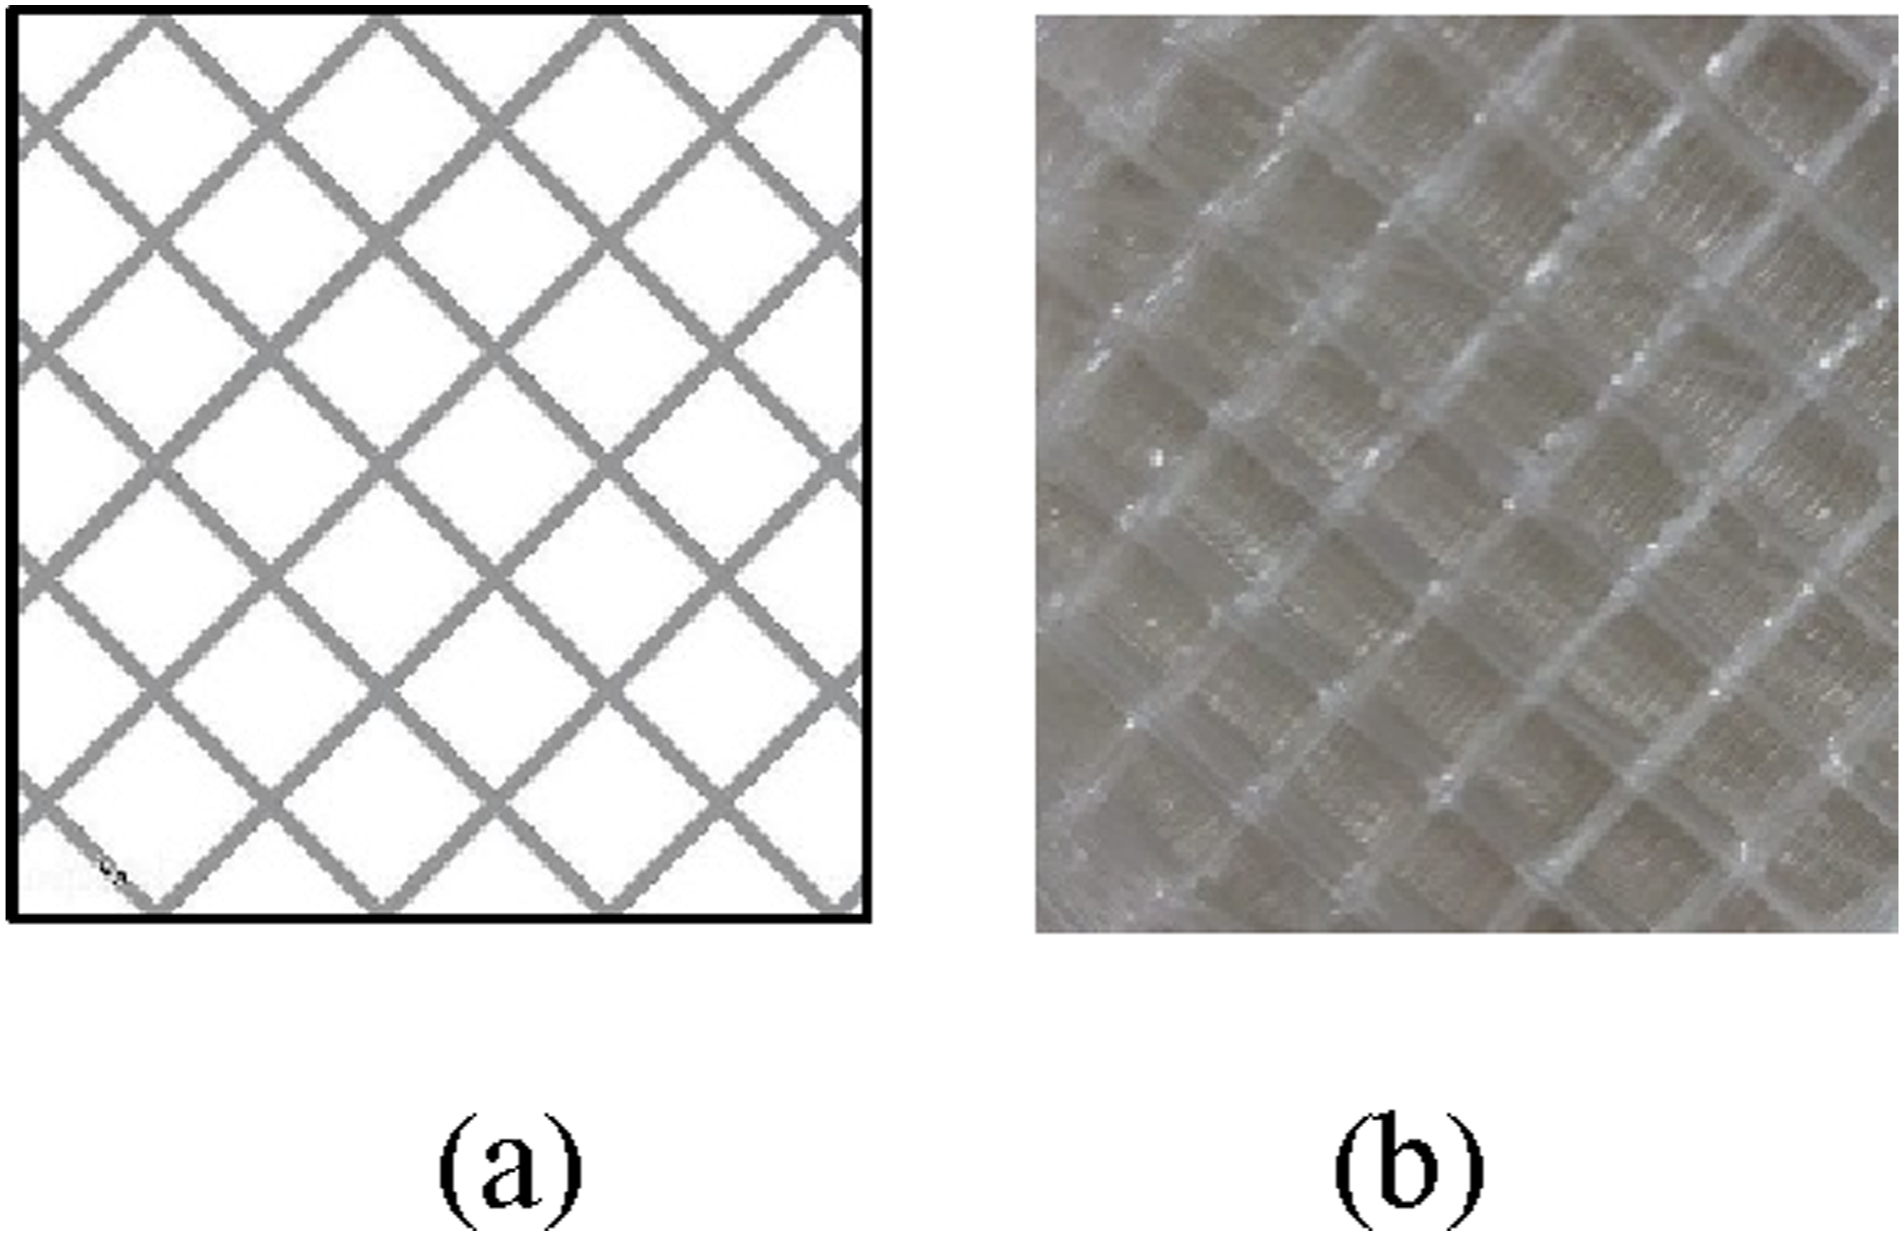
Two types of structures including a normal structure (positive Poisson) and a negative Poisson structure were used to investigate and compare the mechanical properties of the 3D composite parts. For the positive Poisson structure, the infill pattern grid mode was set; the grid structure is schematically shown in Figure 2(a). Among negative Poisson structures, the re-entrant honeycomb structure is frequently utilized by researchers, and its mechanical properties have been investigated in various studies.15,16 In the present study, the re-entrant honeycomb structure was selected as a negative Poisson structure. It is illustrated in Figure 2(b). Figure 3 shows the unit cell of the designed negative Poisson structure. To perform tensile strength tests and impact tests, the parts were designed in standard dimensions by the SketchUp software. Then, the settings and preparation of the production process were done by the Cura software, and the output G.cod file of the software was transferred to the 3D printer for printing. The printing path in continuous fiber 3D printing is important, and the areas where fibers can intersect should be limited. This study benefited from the method that Quan et al.
17
devised for the printing path. The path is shown in Figure 4. (a) Schematic display of the grid structure, (b) Schematic display of the re-entrant honeycomb structure. Design of the unit cell re-entrant honeycomb structure. Schematic display of the printing path.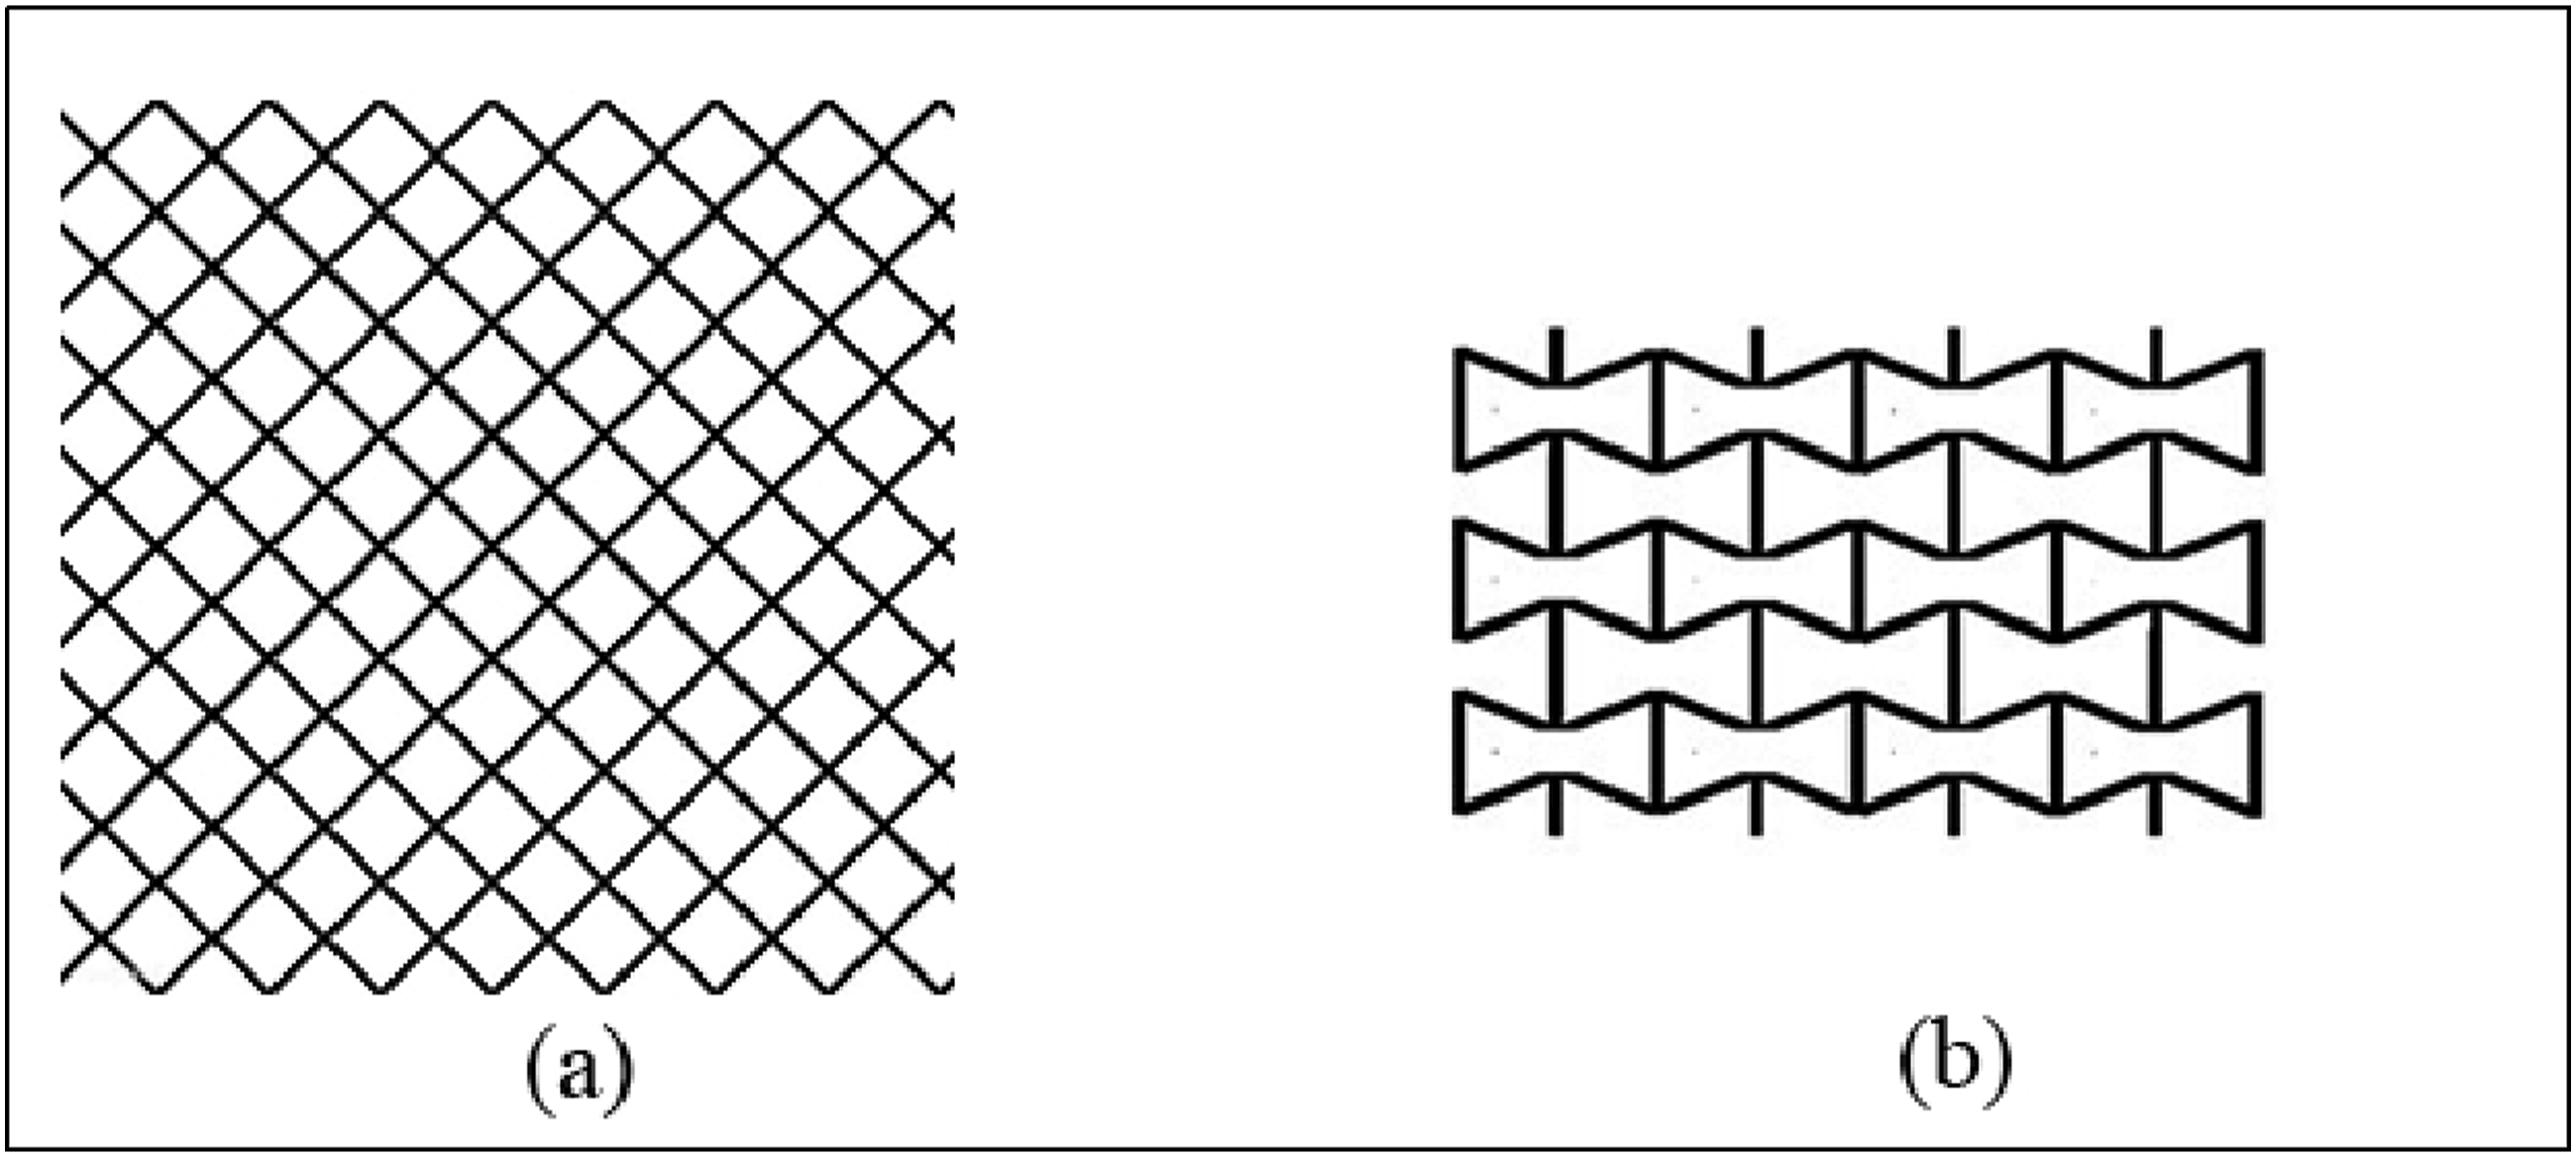


Under small deformation, the in-plane Poisson’s ratio for the re-entrant honeycomb could be calculated with equation (1):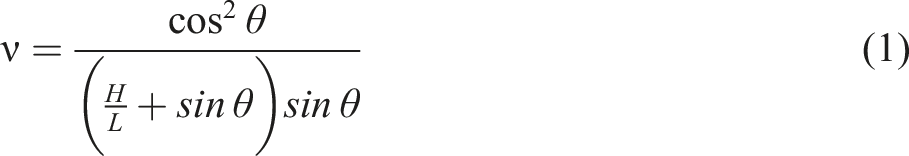
The Poisson ratio of the re-entrant honeycomb in the current design with θ = −30°, L = 2.2 mm, and H = 3.1 mm was −1.65. To verify the negative Poisson effect of the re-entrant honeycomb structure, an experiment was conducted following the methodology outlined by Ling et al. 18 . A tensile test was carried out using the STM-150 device from SANTAM Company, with a loading speed of 0.5 mm/min. A displacement sensor recorded the longitudinal displacement in the loading direction, and a camera captured the image of the deformation process. Poisson’s ratios were calculated from the transverse and longitudinal loading strains, and these experimental values were compared with theoretical predictions. The average experimental Poisson’s ratio for the designed re-entrant honeycomb structure was −1.58, demonstrating a strong agreement between the experimental and theoretical results.
Properties of the samples
Properties of the samples.
In this study, the calculation of the volume fraction was conducted based on the microscopic cross-sectional image of the sample and the processing of the image. Figure 5 shows the cross-sectional image of the PLA + CF composite sample. For this purpose, the area of the fibers (Af) was determined and then divided by the total area of the cross-section of the specimen (A), as in equation (2): (a) A cross-section of the PLA + CF specimen, (b) Schematic image for the estimation of the fiber volume fraction.

The average volume fraction (Vf) for the composite specimens was found to be approximately 31.2%.
After the volume fraction of the fibers was measured, the percentage of the voids in the composite was calculated according to the ASTM D2734 standard
19
and through equation (3) as follows:

To determine the experimental density, liquid displacement based on the Archimedes principle was employed in equation (5) as follows:
Mechanical properties of the printed samples
Tensile test
The dimensions of the tensile specimens for pure PLA and composites were selected from ASTM D638 and ASTM D3039, respectively.20,21 The corresponding tensile tests were performed using the STM-150 device (SANTAM Company) with a capacity of 15 tons. Following ASTM D3039, the composite samples were tested with dimensions of 250 mm × 15 mm, while the pure polymer samples were tested following ASTM D638, with dimensions of 165 mm × 19 mm.
Impact test
The most common type of impact resistance test is the Charpy impact test (proposed by the French scientist George Charpy in 1901), which is used to determine the fracture energy or toughness of materials. In the Charpy test, the pendulum is raised to a known height and allowed to fall. The pendulum falls following a circular trajectory and hits the specimen under study at the middle span length, transferring kinetic energy to it and rising to a measured height. The difference of the initial and final heights is directly proportional to the amount of energy lost due to fracturing the specimen. For the Charpy impact test in this study, the samples were prepared according to the EN ISO 148-1 standard with dimensions of 55 mm × 10 mm.
22
Following this standard and from each structure, five samples were prepared and tested for tensile strength and impact resistance. Figure 6 illustrates the specifications of both the tested samples and the final printed samples. Figures 7 and 8 show the schematic and the image of the internal structure of the sample prepared with pure polymer and composite sample with negative Poisson re-entrant honeycomb structure, respectively. It is worth mentioning that to improve the appearance of the samples and perform the tensile and impact strength tests better, a simple linear structure has been applied to the upper and lower layers of the samples. (a) Geometric specifications of the tested samples, (b) Final printed samples. (a (a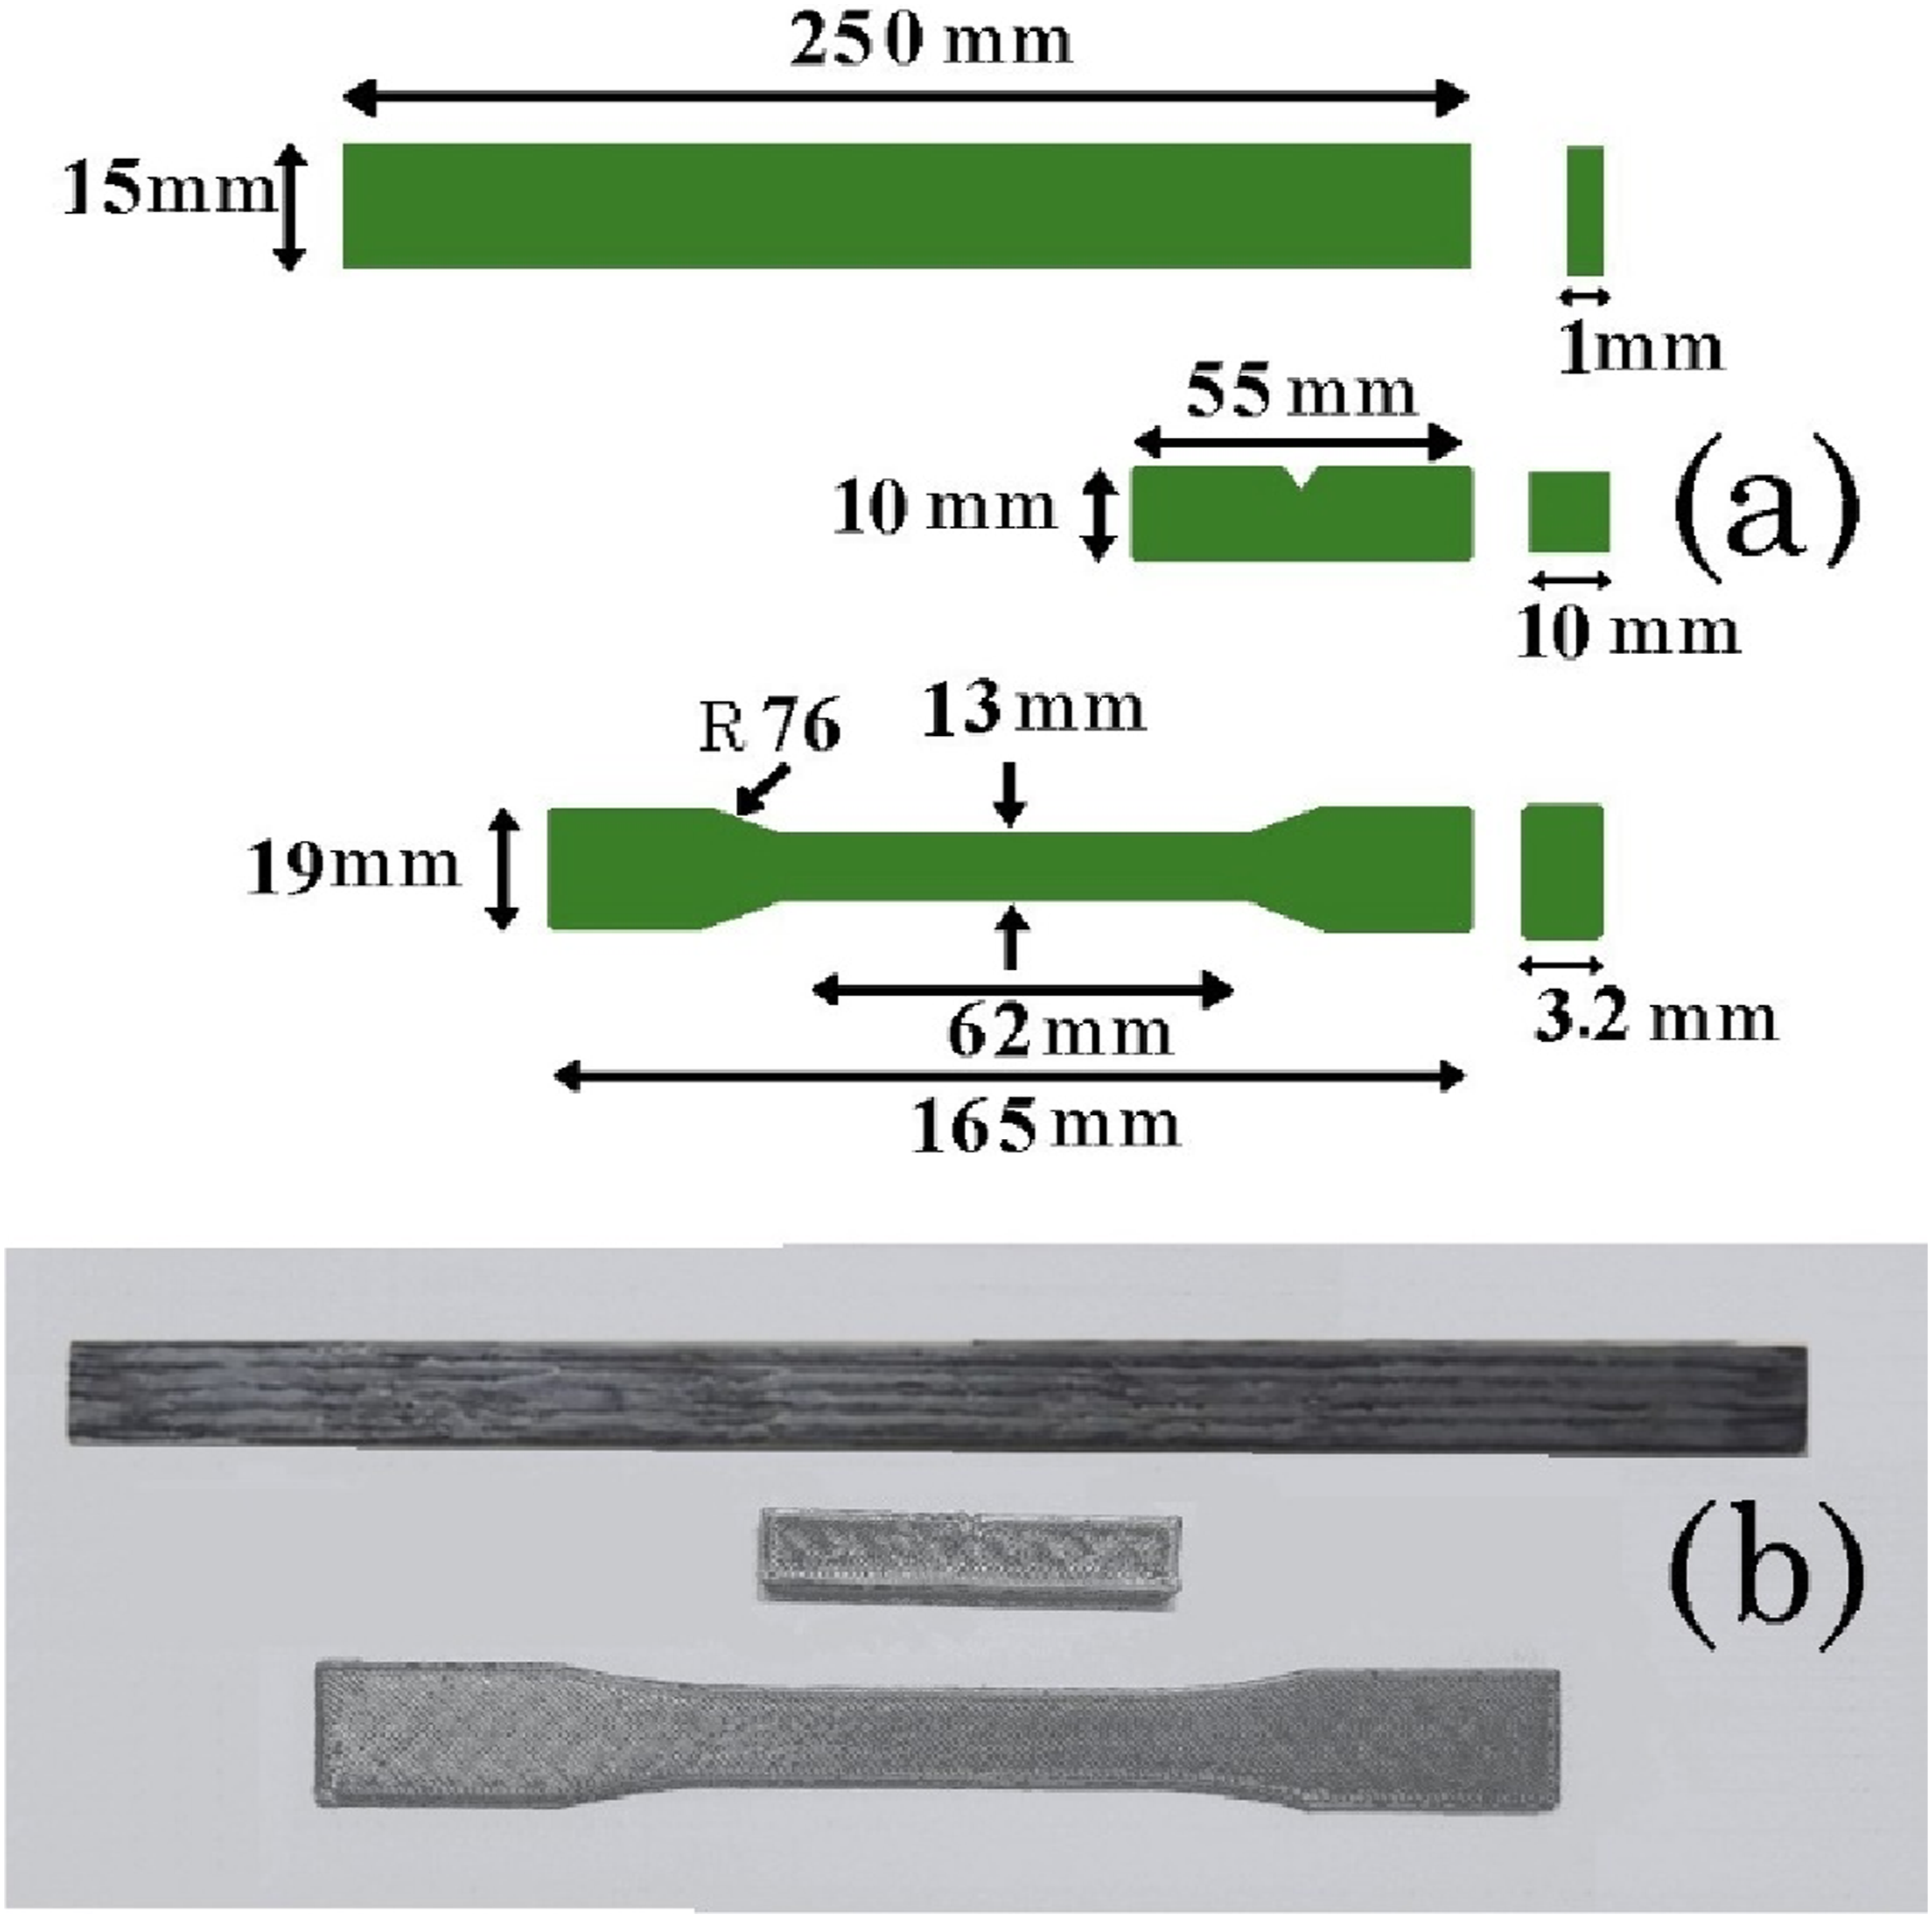

Results and discussion
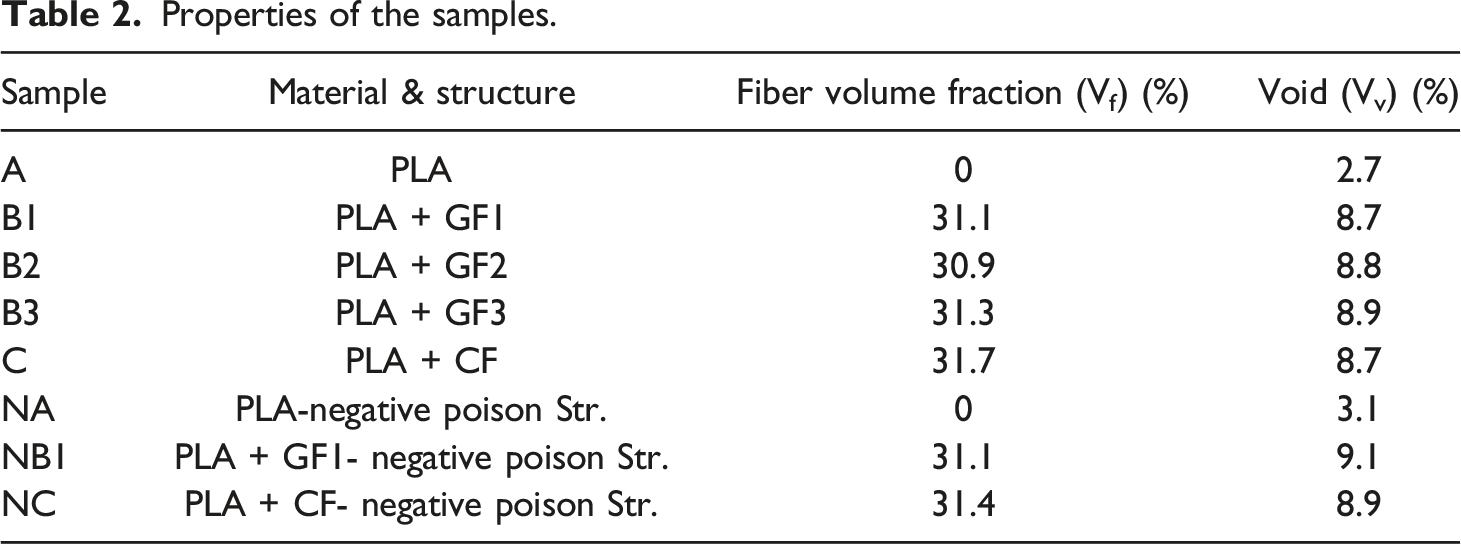
To evaluate the effects of the reinforcing fibers and the internal structure of the samples on the mechanical properties, both tensile strength and impact resistance tests were conducted. The volume fraction of the fibers and the percentage of the voids in the samples are presented in Table 2. As it can be seen, the average volume fraction of the fibers and the percentage of the voids were 31.2% and 8.9%, respectively.
Tensile properties
The stress-strain diagram of the three-dimensional samples under the tensile strength test is shown in Figure 9. The results indicate that the use of fibers to reinforce a polymer increases both the tensile strength and the tensile modulus of 3D printing samples, but it results in a decrease in strain to failure. Tensile stress-strain curves of A, B1, B2, B3 and C samples.
Additionally, to compare the effect of the number of fibers in the reinforcing fiber on the tensile strength of the 3D fiber-reinforced composite, three samples (B1, B2 and B3) were prepared using a PLA polymer and glass fibers with the same count but different diameters and numbers of fibers as reinforcement. The results indicated that increasing the number of reinforcing fibers can increase the strength and tensile modulus of the composite. This increase in strength may be attributed to the improved adhesion of fibers with the polymer.
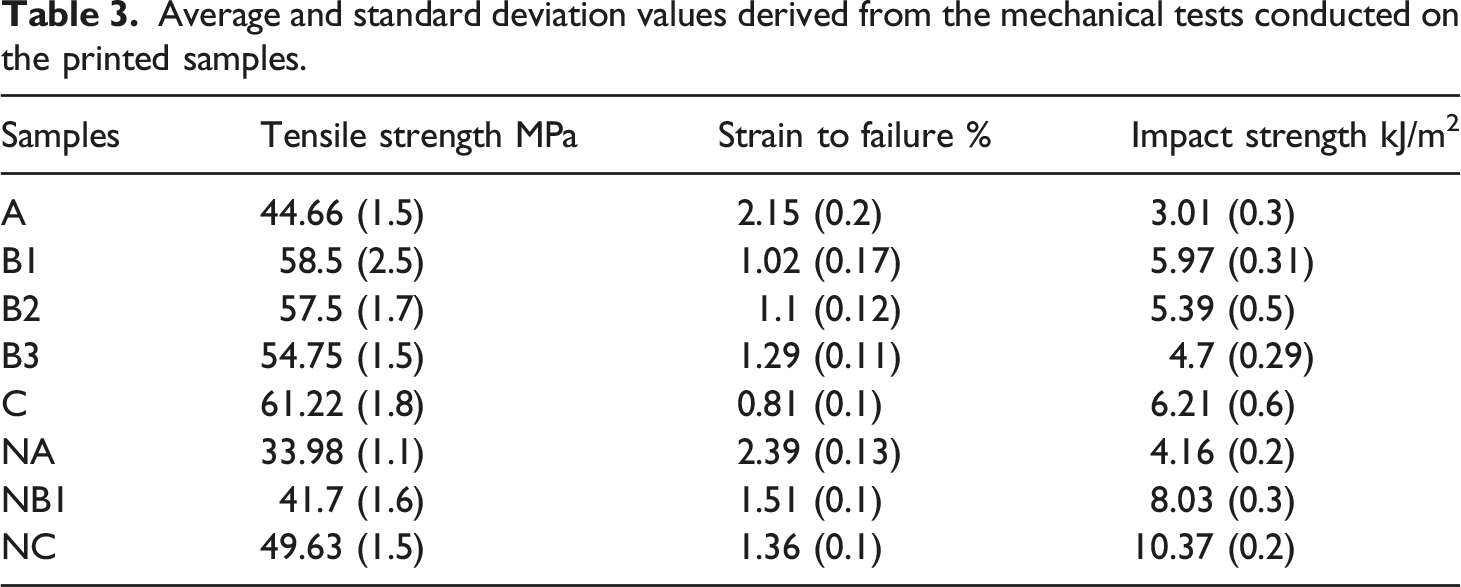
To investigate the effect of the negative Poisson structure on tensile strength, samples NA, NB1 and NC were prepared. These samples were based on re-entrant honeycomb structures with negative Poisson’s ratios and corresponded to samples A, B1 and C, respectively. The stress-strain diagram of the samples is presented in Figure 10. As it can be seen, the negative Poisson structure reduced the tensile strength but increased the length of the samples to the point of rupture. Consequently, a negative Poisson structure does not seem to be effective in improving the tensile strength of 3D samples prepared with a 3D printer. The values of the average tensile strength of the samples are reported in Table 3. Tensile stress-strain curves of NA, NB1 and NC samples. Average and standard deviation values derived from the mechanical tests conducted on the printed samples.
The experimental results align with the theoretical studies investigating the effect of the negative Poisson’s ratio on tensile strength and strain properties. For instance, Li et al. 23 demonstrated higher strain energy release rates for materials with a negative Poisson’s ratio compared to those with a positive Poisson’s ratio. Consequently, materials with a negative Poisson’s ratio tend to have a higher strain energy release rate under a mechanical load.
To facilitate a comprehensive comparison of the prepared samples in terms of the tensile test results, Figure 11 shows the average tensile strength values for all the samples. As suggested by the diagram, the reinforcement of the PLA polymer with fibers has led to an increase in the tensile strength. Conversely, the use of a negative Poisson structure has resulted in a decrease in the tensile strength but an increase in the strain to the failure point, leading to an enhancement in the toughness of the samples. Diagram of the average tensile strength of the samples.
Impact properties
The results of the impact tests on the pure polymer sample and the composite samples are shown in Figure 12. The impact energy was measured in kilojoules (kJ), and the impact strength was calculated through dividing the impact energy in kilojoules by the area under the notch, with units expressed in kJ/m2. Higher impact strength signifies greater energy absorption by the sample during the impact. Results of Charpy impact test.
As it can be understood, reinforcing the polymer with the fibers increased the impact resistance. Samples NA, NB1 and NC were tested with a negative Poisson structure, like re-entrant honeycomb structures. The results point to a significant improvement in the impact resistance of samples A, B1 and C, respectively. The best impact resistance was for the samples reinforced with fibers of a negative Poisson structure. Moreover, the results of the impact test on the three-dimensional composite reinforced with glass fibers showed that increasing the number of glass fibers in the reinforcing fiber would improve the impact resistance. This improvement can be attributed to the enhanced adhesion between the glass fibers and the polymer resulting from the increased number of fibers in the reinforcing yarn.
Table 3 presents a summary of the test results for the mechanical properties, including tensile strength and impact resistance, of the pure polymer samples and the composites reinforced with continuous fibers in the two states of simple structure and negative Poisson structure. According to the table, the negative Poisson’s ratio structure was significantly effective to enhance the impact resistance of both polymer and composite, although it reduced the tensile strength in the samples. The benefit of polymer reinforcement with fibers to improve both tensile strength and impact resistance is evident.
Conclusions
To enhance the mechanical properties of three-dimensional parts produced by 3D FDM printing, a nozzle capable of feeding continuous fibers was designed. Subsequently, three-dimensional composites were manufactured by reinforcing the polymer with fibers. In the composite samples produced, the volume fraction of the fibers was found to be 31.2%, and the voids accounted for 8.9%. The results indicated that using continuous fibers as reinforcement improves both the tensile strength and the impact resistance of 3D composites compared to the 3D pure-polymer samples. Additionally, to investigate the enhancement of mechanical properties, a negative Poisson structure was considered for both the pure polymer and the composite reinforced with continuous fibers Their tensile and impact resistance properties were then compared with those of a simple structure (positive Poisson). The results demonstrated an improvement in impact resistance but a reduction in tensile strength.
In the tensile strength test, the highest strength was observed in the sample reinforced with carbon fibers featuring a positive Poisson structure. Conversely, in the impact resistance test, the sample that had a negative Poisson structure reinforced with carbon fibers yielded the best result. Additionally, the tensile strength and impact resistance tests on the samples reinforced with glass fibers, containing a varying number of fibers, showed that using fibers with a higher number of fibers results in greater strength. This can be attributed to the increased adhesion between the fibers and the polymer.
Hence, when selecting continuous fibers for reinforcement with an identical yarn count, opting for fibers with a higher number of fibers is recommended. This enables the production of high-performance composite parts using the designed printer, which is suitable for various applications, as in the automotive industry.
Footnotes
Declaration of conflicting interests
The author(s) declared no potential conflicts of interest with respect to the research, authorship, and/or publication of this article.
Funding
The author(s) received no financial support for the research, authorship, and/or publication of this article.