
Abstract
Previously established models for electromagnetic shielding effectiveness in metallized textiles have limitations in accurately forecasting the shielding effectiveness of metallized nonwovens. In response, this study embarks on a exploration aimed at formulating a mathematical model capable of predicting the electromagnetic shielding effectiveness specific to metallized nonwoven fabrics. By converting the nonwoven parameters into suitable woven parameters and optimizing the existing models, a refined mathematical model is proposed. To validate the feasibility of the model, experimental verification is conducted using three commercial copper coated nonwoven polyester fabrics CuPET10/20/30. At the 1.5 GHz frequency point, both the values derived from the newly prediction model and the experimental observations exhibited satisfied compatibility across all three samples. However, at the 3 GHz frequency point, a noticeable disparity was observed for CuPET10, with the experimental SE value measuring 47.78 dB, deviating from the SE range projected by the predictive model, which encompassed values between 41.18 dB and 45.76 dB. In contrast, the experimental SE values of CuPET20 and CuPET30 at 3 GHz stood at 57.8 dB and 68.56 dB, respectively, closely aligning with the model's predicted SE range of 53.6 dB–63.7 dB and 60.02 dB–70.65 dB, respectively. The two-sample p-test was performed in the frequency range from 0.5 GHz to 3 GHz. The results reveal a significant level of agreement between the average shielding effectiveness (SE) value predicted by the proposed model and the measured SE value from samples CuPET20 and CuPET30, which p value are 0.16 and 0.06.
Keywords
Introduction
With the increasing reliance on electronic devices and fast development of telecom technology, the extra electromagnetic radiation may increase the health risks for people who exposed in the excessive radiation environment for prolonged periods of time,1–3 and the massive electromagnetic interference (EMI) could hazard for the equipment which is sensitive electromagnetic filed.4–7 Metallized textiles have gained significant prominence in the realm of electromagnetic shielding owing to their attributes of softness, thinness, and breathability.8–11 Surface treatment not only limited as one of the effective method to realize the metallization of textile,12,13 to a large extent, the properties of the treated textile will also be changed to meet the requirements of the design. 14 These textiles find extensive application in the development of electromagnetic shielding clothing, serving to safeguard individuals such as workers and pregnant women who endure prolonged exposure to excessive electromagnetic radiation.15,16 Additionally, the metalized textiles hold potential as constituents of composite materials employed in construction or as protective materials for sensitive instruments. 17 The electromagnetic shielding performance can be evaluated from the value of shielding effectiveness (SE), which can be measured via coaxial transmission line method according to ASTM 4935-10 18 and calculated from the decimal logarithm of the ratio of incident energy to transmitted energy.
To investigate and develop materials with a high electromagnetic shielding effectiveness (EMSE), the utilization of a proper mathematical model becomes indispensable for the analysis and prediction of EMI shielding performance. As one of the basic principles for EMI shielding mechanism, the transmission line theory which developed by Donald R.J White in 1971 has been used as start point for developing the empirical mathematical model of electromagnetic shielding effectiveness. 19 In the transmission line theory, the incident electromagnetic wave can be attenuated by reflection loss, absorption loss and multireflection loss inside the material. Regarding the textile based shielding material, detailed EMSE mathematical model for metalized textile shields was proposed afterwards by Arthur R. Henn and Richard M. Cribb in 1992. 20 In their study, the semi-empirical model describing the SE of metalized both woven and non-woven fabrics was developed. Later in 1995, several correction values were added to the basic transmission line models after considering the leakage through openings in metalized textiles, which including the correction coefficient to considering the number of like discontinuities, the low-frequency correction coefficient considering the skin depth, the correction coefficient considering the coupling between adjacent pores. 21 Further complete derivation and verification of this model and apply the model for metalized woven fabrics was done by Marek Neruda and Lukas Vojtech. 22
There are many methods to model the SE of metalized textiles, for example modelling of wire mesh barriers, 23 modelling of compact materials, 24 FE model of EM shielding textiles. 25 By using these methods, many study focus on predict the woven fabric EMSE due to the wide application of metallization on greige woven fabrics in electromagnetic shielding and the relatively regular pore structure of woven fabrics.26–32 Comparing with metallized fabrics incorporated into woven fabric substrates, nonwoven metallized fabrics are progressively gaining extensive application in electromagnetic shielding materials owing to their expeditious production, cost-effectiveness, thin structure, and facile processing. 33 Notably, metallized nonwovens characterized by high porosity exhibit exceptional suitability as interlayer functional materials for electromagnetic shielding clothing, attributed to their commendable air permeability and lightweight, thin structure.34,35
Nevertheless, despite the widespread utilization of nonwoven-based metallized electromagnetic shielding textiles, the mathematical modeling of metalized nonwoven fabrics’ electromagnetic shielding effectiveness remains an area that has received limited attention. From the literature review, there is rarely no detailed study to solve the mathematical modeling problem for nonwoven metalized fabrics, only in the research of Arthur R. Henn and Richard M. Cribb described the mathematical model for metalized nonwoven fabrics (this model also designed for metalized woven fabrics) but not suitable anymore for the high porosity thin nonwoven fabrics, the compatibility and results accuracy from this model is relatively low. 20 One of the primary factors contributing to this knowledge gap is the intricate nature of nonwoven structures. Unlike woven fabrics, nonwovens exhibit random fiber distribution, owing to the diverse fabrication methods employed. Consequently, accurately describing the pore parameters of nonwovens within the electromagnetic shielding model becomes exceedingly challenging, which cannot easily use these structure parameters for metalized nonwoven fabrics.
Inspired by our previous study about EMI shielding simulation from optimized nonwoven models, 36 the novelty of this paper is presenting a comprehensive investigation into the development of an empirical mathematical model for evaluating the electromagnetic shielding effectiveness of metallized nonwovens. The analyzed frequency band in this paper was from 500 MHz to 3000 MHz (3 GHz), which belongs to the Ultra High Frequency (UHF) band. This frequency band is widely employed for television broadcasting, mobile communication networks, wireless data transmission, satellite communication, and other wireless applications, which is significant for EMI shielding application.37–39
Building upon the previous research on woven metallized textile models, the analysis of nonwoven pore morphology is integrated, and electromagnetic shielding simulations are conducted. The results of simulation showed the feasibility that an equivalence between the pore structure characteristic parameters of nonwovens and the corresponding parameters of woven fabrics. After converting the nonwovens parameters into suitable woven parameters, by optimizing the existing models using the functional relationship between the conductivity of metallized nonwovens and electromagnetic shielding effectiveness, a refined mathematical model is proposed. To validate the model's feasibility, three commercial samples are utilized for experimental verification. The results demonstrate a remarkable degree of fitting between the average SE value of proposed model and the measured SE value from samples without multireflection attenuation. For thin nonwovens with multireflection attenuation, the accuracy of predicted results from this newly proposed model was decreased, but still in the model predicted range which closer to the upper limit level.
Materials and parameter measurement methods
Materials fabrication and physical properties
Three samples of copper-coated nonwoven fabrics exhibiting an increased areal weight were utilized in this study. These samples supplied from Bochemie as, Czech Republic and commercially named Meftex®. The primary rationale behind selecting commercial samples lies in the consistent and reliable copper plating process applied to these specimens, resulting in minimal variation in both conductivity and electromagnetic shielding effectiveness across different spatial locations. Additionally, commercial samples have undergone antioxidation treatment, enhancing the materials' resistance to oxidative degradation to a greater extent compared to laboratory samples. This heightened oxidative stability is of paramount significance for ensuring sustained electromagnetic shielding performance. The sample consisted of polyester nonwoven as the greige fabric to a proprietary patent copper coating process that incorporates greige fabric activation and continuous electroplating techniques. The pre-activated fabric was employed in a “roll to roll” technology for copper metal deposition. In this process, the pre-activated polyester fabric underwent immersion in a bath containing CuSO4, followed by reduction using a borohydride-based solution, which is similar to the electroless plating method. Consequently, a homogeneous layer rich in copper nanoparticles was formed, creating a densely distributed, continuous metallic surface on the fabric. These samples were renamed CuPET10, CuPET20, CuPET30 for brevity in this paper.
Metalized nonwovens specifications.

In order to investigate the pore of metalized nonwoven samples, microscopic images of the CuPET samples were acquired using a Nikon Eclipse E200 microscope under transmitted light conditions. The images were captured as RGB image matrices with dimensions of 1200 × 1600 pixels. It is noteworthy that all image acquisitions were performed using the same microscope setup for consistency. The image analysis software IMAGE J was used for analysis the pores of these samples.
Electromagnetic shielding effectiveness test
The electromagnetic shielding effectiveness test employed a test system provided by Rohde & Schwarz, comprising sample holders and a network analyzer. Conforming to the ASTM D4935-18 standard, this test methodology was employed to assess the electromagnetic interference shielding effectiveness of planar materials under conditions of normal incidence, far-field propagation, and plane-wave behavior. The measurement outcomes presented the shielding effectiveness at each frequency point, with each fabric sample being subjected to five measurements conducted at distinct locations. The obtained results were averaged to provide a comprehensive assessment of the shielding effectiveness.
Conductivity test
The material conductivity was calculated as the reciprocal of volume resistivity. The volume resistivity of three distinct sample groups was determined in accordance with the ASTM D257-14 standard. 42 The measurements were conducted at a controlled temperature of 23.2 ± 2°C and a relative humidity of 50.7% ± 5%. Electrodes were connected to a direct 100V current (DC) power supply set. The volume resistivity measurement was performed at 10 different locations on the textile samples, and subsequent calculations involved determining the average value and a 95% confidence interval.
Electromagnetic interference shielding simulation
The EMI simulation solution was published regarding our previous study.
36
The simulation environment was established based on the waveguide method, specifically in the TE10 mode. The significant reason to choose the waveguide method is the simple structure greatly simplifies the meshing step in the simulation operation and waveguide structure could offer customized and stable electromagnetic signal by adjusting the shape of the waveguide cross-section, which is very important for the simulation run. Employing the finite element method (FEM), the ANSYS HFFS software environment was utilized to generate simulated results of the shielding effectiveness, presented in the form of transmittance coefficients. The virtual measurement environment was created within Ansys HFSS, replicating the geometry of the physical measurement setup. The measurement stand consisted of waveguides that corresponded to the recommended frequency ranges: • WR-1500 (500–750 MHz) • WR-975 (750–1150 MHz) • WR-650 (1150–1500 MHz)
Within the waveguide structure, an optimized model of the test sample was positioned. The decision to employ an optimized module, as opposed to the textile's original geometrical model, was primarily driven by the significant time and computational resources required to run the original textile geometrical model. Importing the complete mesoscale textile geometry directly into the simulation environment would risk system crashes, particularly during the meshing process. The intricate and complex nature of textile structures, compared to other engineering objects, demands substantial computational power to mesh all the fibers or yarns within a fabric. Consequently, the use of an optimized textile model is crucial for conducting the EMI simulation.
Modeling
The complete modeling methodology and processes were presented in the Figure 1. After sufficient literature review, the existed EMI shielding mathematical models were most developed for woven based textile. Obviously, by using the existing models to calculate the SE of nonwoven based EMI shielding material cannot reach correctly result and there was barely any mathematical model developed for thin metalized nonwoven materials. The main reason is that due to the non-uniform pore size distribution of nonwovens, it is very difficult to select the parameters of the pore size in the model. In this case, the equivalent transformation of nonwoven structure into woven fabric structure and optimization of the existing model can be used as a basic method for EMI shielding mathematical modeling of metallized nonwoven. To confirm this hypothesis, the optimized textile model was imported into simulation environment. The result showed that it’s possible to predict the EMI shielding performance of nonwoven textiles after converting the nonwoven structure into woven structure without changing the volume porosity, thickness of the material and conductivity. As the hypothesis was proved, the finalized mathematical model for nonwoven based EMI shielding material was proposed after optimizing the existed model. In this paper, the SI units are used in all formulas, the unit of some key parameters for mathematical model was marked. Modeling methodology and processes.
It should be noticed that generally the mathematical model used to predict the SE are empirical model, not physical model because there is not dimensional homogeneity of the equations.
Analysis of existing electromagnetic shielding effectiveness model
Electromagnetic inference shielding is one of the main means to suppress electromagnetic interference and realize electromagnetic radiation protection. The so-called electromagnetic shielding is the use of conductive or magnetic materials to limit electromagnetic radiation within a specified space. The purpose is to use a shield to surround the electromagnetic interference source and suppress the interference of the electromagnetic interference source to the receiver in the surrounding space, or to use a shield to surround the receiver to avoid interference from the interference source. According to the classic transmission line theory of electromagnetic shielding proposed by Schelkunoff,
43
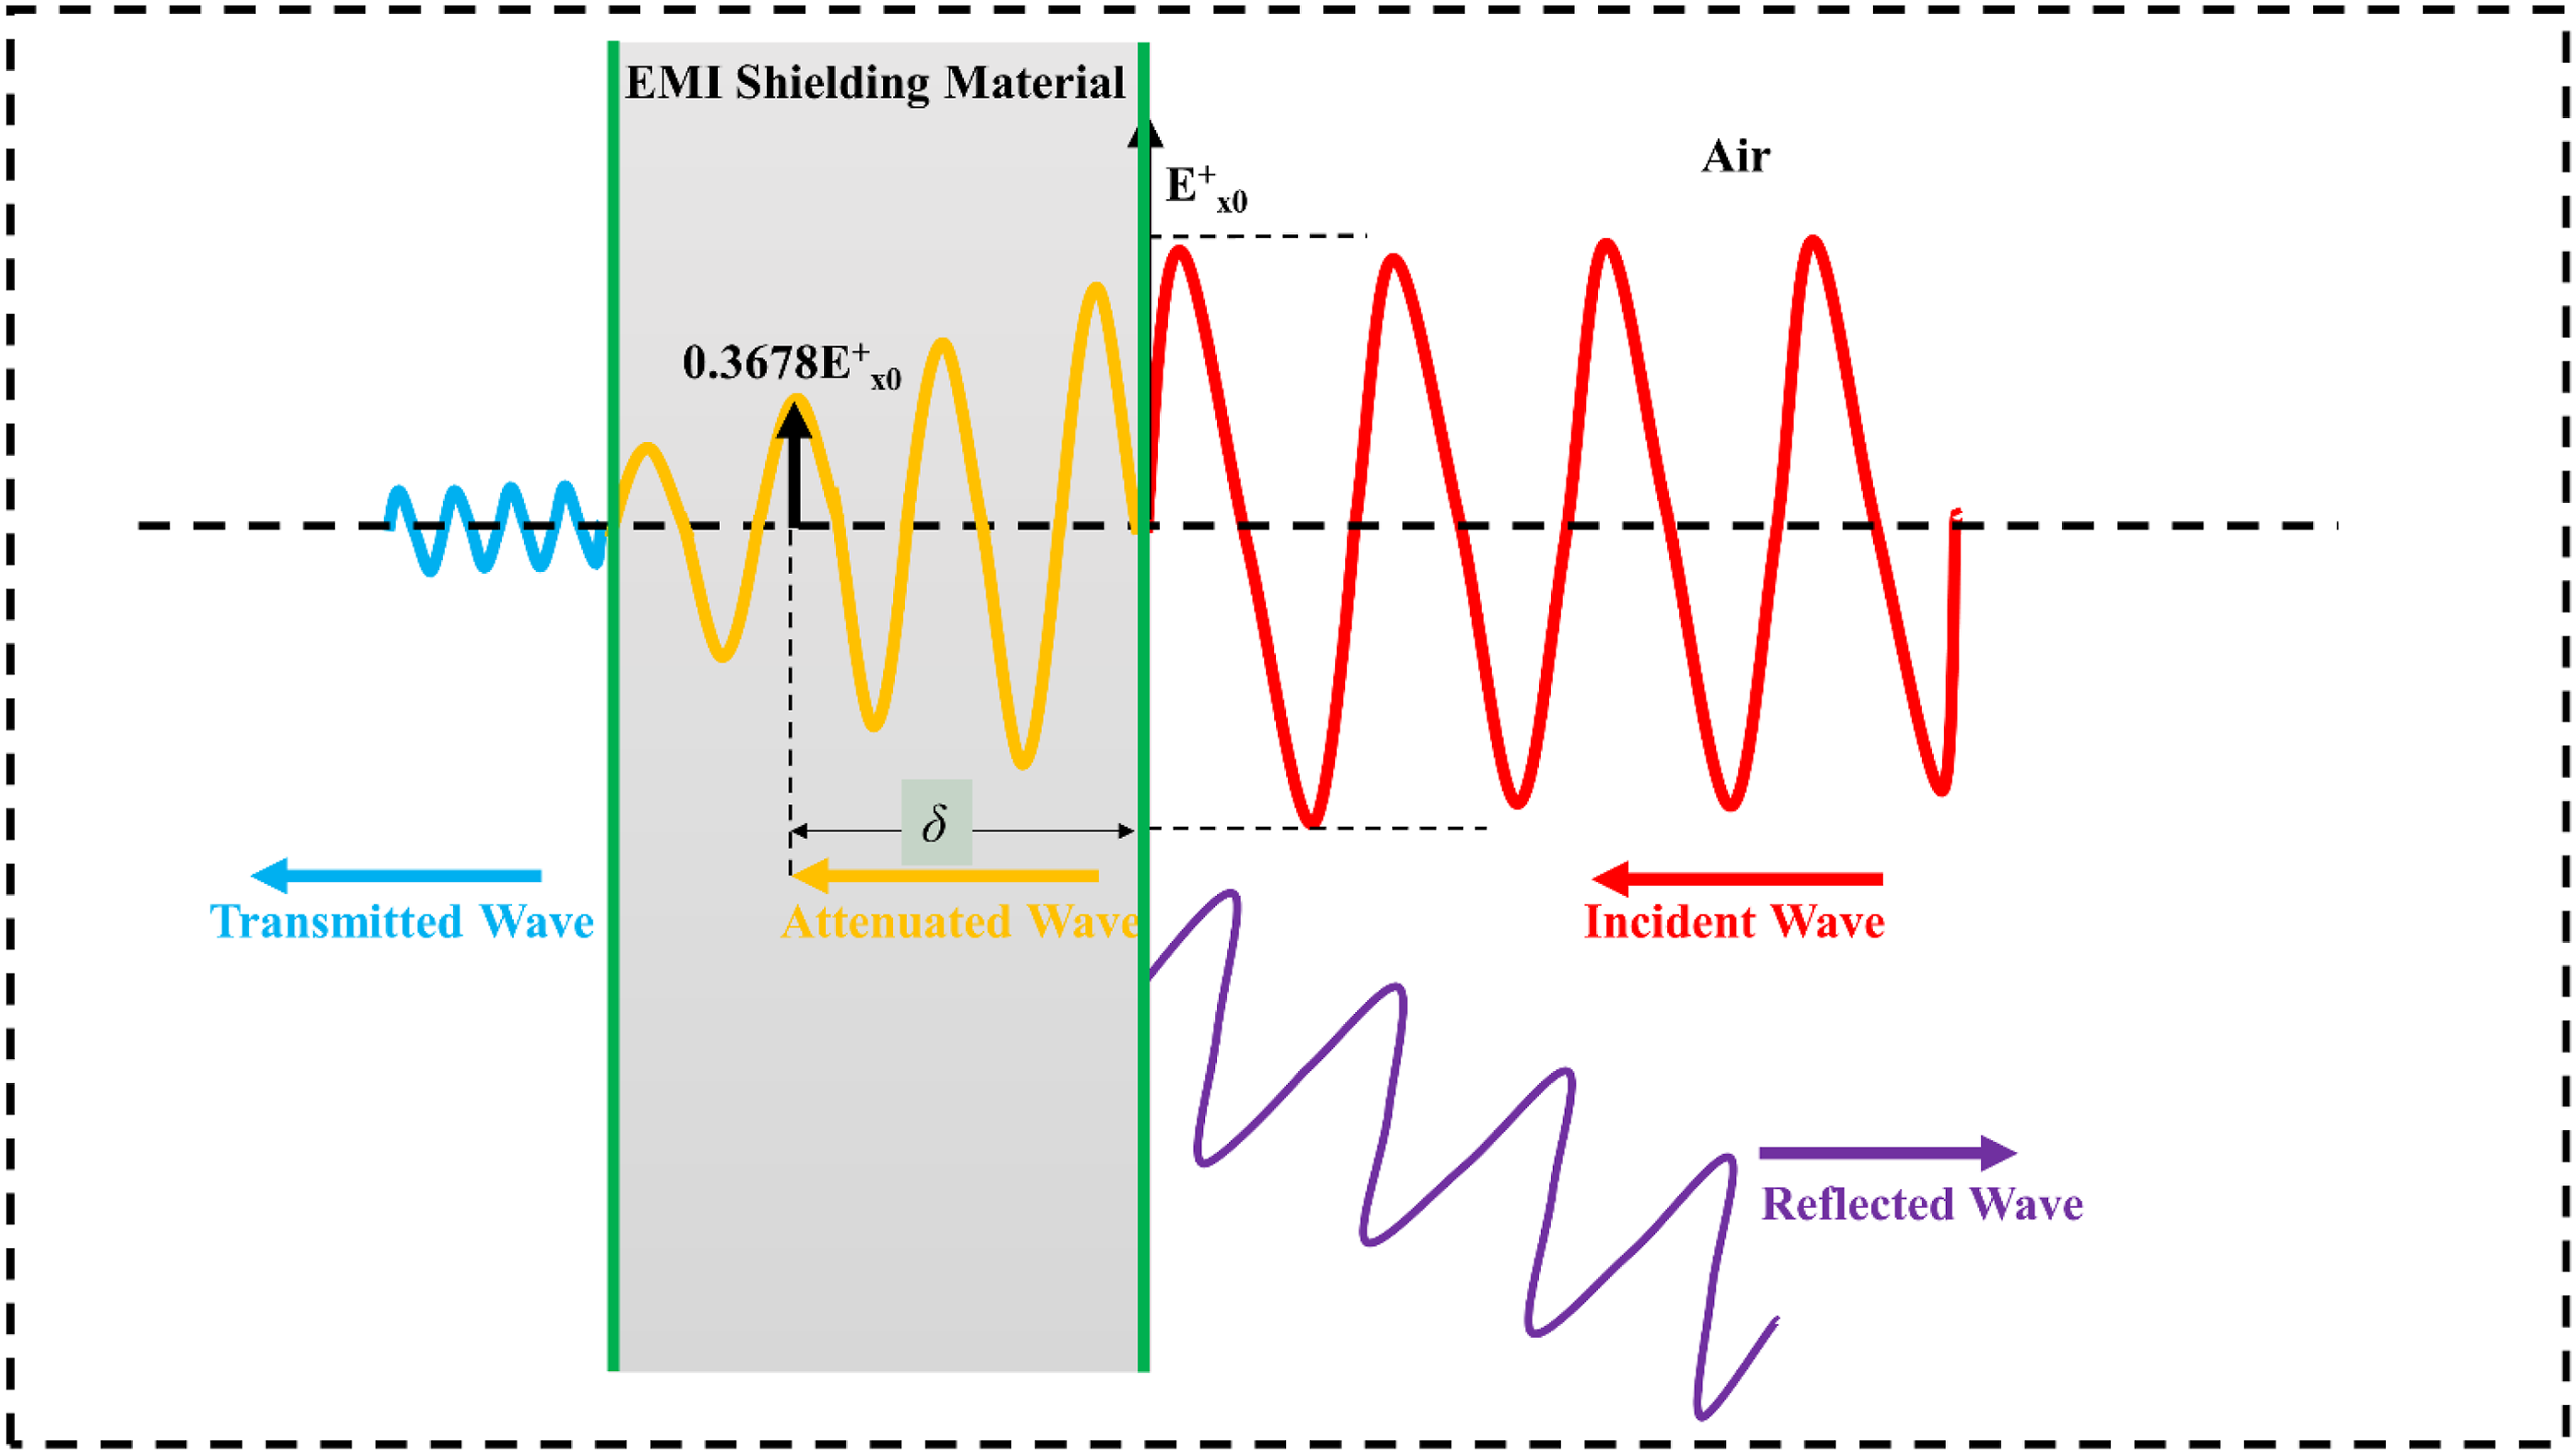
the shielded electromagnetic wave is divided into three parts: one is the surface reflection of the shield (SER), the other is the absorption of the shield (SEA), and the third is the multiple reflection inside the shield (SEB) (Figure 2). The total shielding effectiveness for the foil (SEfoil) could be expressed in equation (1). EMI shielding mechanism interpreted by transmission line theory.
For metalized textile using as EMI shielding material, the main mechanism is surface reflection which caused by the impedance mismatch from the metalized textile and air. This mechanism can be described in equation (2), which was referred from the research from Vojtech, L44,45:
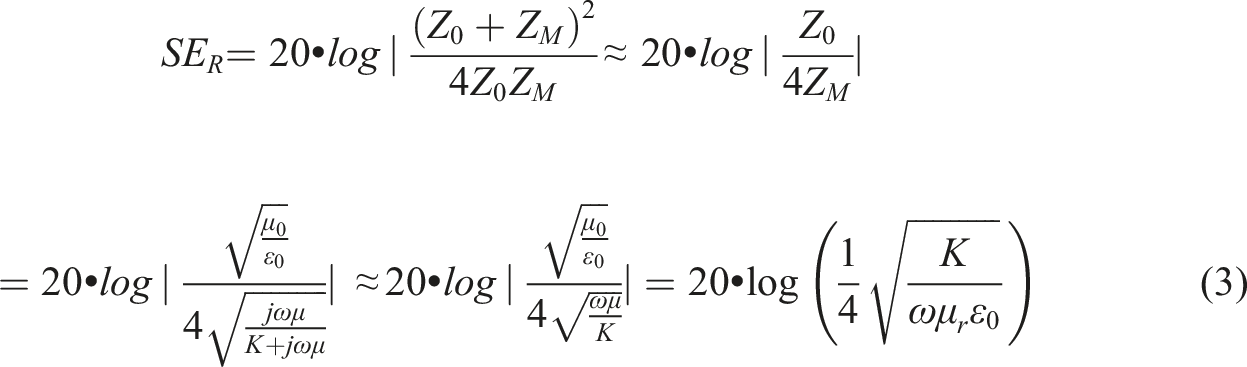

KCu = 5.8 × 10⁷S/m. By using equation (4) into equation (3), the equation can be calculated as equation (5):
Regarding the absorption loss, the energy attenuation was caused by ohmic loss as well as polarization loss. Ohmic loss attenuates energy via mobile charges conduction, hopping, and tunnelling. The polarization loss is derived from defects, interfaces and functional groups. The absorption attenuation of the EM can be calculated via the following equation (6) proposed by Neruda M.
22

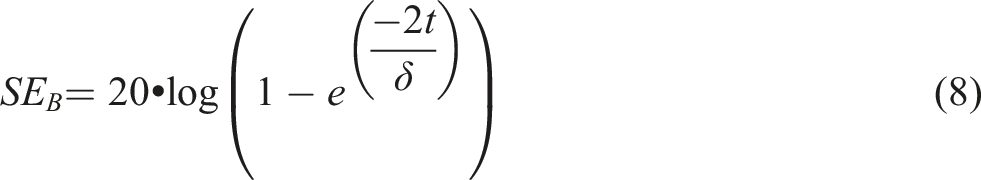
SEB is the internal reflection loss at exiting interface. The attenuation connected with multiple reflections can be neglected when the distance between the reflecting surfaces or an interface is large compared to the skin depth δ, which is defined as the EM wave to be attenuated to 1/e or 37% of its original value. In materials with high conductivity, the skin depth is relatively small, indicating that the waves are attenuated quickly as they penetrate the material. When the material thickness is greater than the skin depth, the waves will experience multiple reflections within the material, but these reflections will be heavily attenuated with each bounce. As a result, the contribution of the multireflection factor to the overall shielding effectiveness becomes negligible. The skin depth can be calculated in equation (7).
46
Condition of EM wave attenuation by multireflection from internal surfaces. Calculated skin depth compared with the material thickness of sample (a) CuPET10 (b) CuPET20 (c) CuPET30.

Except for the blocking mechanism of EM wave from conductive foil shielding effectiveness (SEfoil), the pores of the shielding material also contribute to the shielding performance.48,49 In this case, the total SE (SEtotal) mathematical model has been developed depending on a linear combination of the SE of the foil material SEfoil and the blocking effect contributed by the pores SEpore in the following form, which was proposed by Arthur R. Henn and Richard M. Cribb.
20


To calculate a reasonable value of 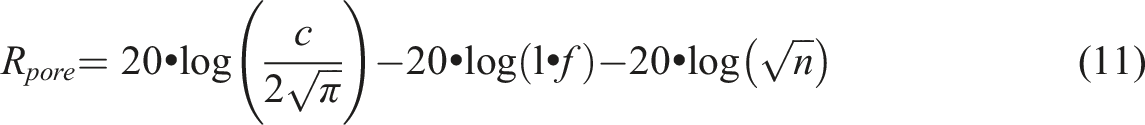
Then the assumption can be written from equation (3) and equation (11) as equation (12).
After simplification and derivation, the equation (12) can be modified as shown in equation (13)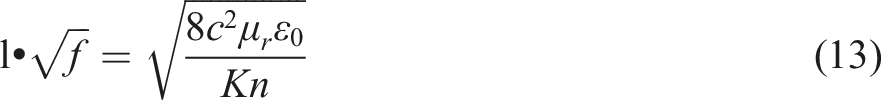
Regarding the definition of skin depth, three skin depth (3 • 

Infeasibility of existing models for nonwovens
By using equations (5), (6), (8), (9), (10) and (15) it’s possible to calculate the SE of the textile based shielding material. However, the limitation of these mathematical model is obvious. From the equations, the parameter for numbers of pores (n) and the maximum pore dimension (l) must be relatively constant value. That’s why this model is suitable for woven structured shielding material, but for nonwoven based shielding material this mathematical model will not be accurate. Because of the different technology of fabrication for woven and nonwoven fabrics, the structure for both fabric is totally different. Woven fabric is composed by the regular interlacing from weft and warp yarns, the formed pores can be treated as regular square shape and evenly distributed in the fabric. In this case, the parameters of n and l are relatively constant. The structure of nonwoven fabric is completely different from woven textile. Most of the nonwoven fabrics are fabricated by boding the fibers via needle punch, water punch, thermal bonding or other technology. The fibers of nonwoven fabric interlaced randomly. In this case, the numbers of pore and the maximum pore dimension cannot be constant.
To further prove the irregularity of nonwovens pores, the geometrical model was built according to our previous published method.
50
The analysis of fiber slope range, as well as other crucial parameters such as fiber diameter and fiber count within specific lengths, was performed using the image processing software IMAGE J based on the microscope images. Subsequently, the acquired data was utilized in a linear equation implemented in Python to generate coordinates for all the fibers. These coordinates were then imported into the textile geometrical modelling software, TexMind Viewer, to generate the corresponding geometrical model (Figure 4(b) and 4(c)). Pore shape demonstration (a) SEM picture of CuPET10 (b) Geometrical model of CuPET10 refer to same size as SEM picture (c) Pore shape demonstrated from the geometrical model of CuPET10. (d) Measured SE compare with Neruda model and Tunáková model calculated results of CuPET10 (e) CuPET20 (f) CuPET30.
Summary of pore size distribution analysis.

Due to the unique hole structure of nonwovens, there is a relatively large gap between the calculated results and the actual measurement results after applying the electromagnetic shielding prediction model of woven fabrics. Through Figure 4(d)–(f), this conclusion can be verified.
From the Figure 5 it’s obviously to see the different pore size distribution in the same size for these three samples. The total numbers of the pores are variable in different place of the sample for same size. With the increasing of the planner density for the samples, the numbers of pores were decreased, and the average value of total pore area was also getting smaller. This change was caused by the increasing number of fibers. Due to the irregular arrangement of the fiber, shape of the pore is mostly irregular quadrilateral which formed by the interlacing of fiber. Some of the pores are triangles. It’s impossible to define the constant value for the maximum pore dimension represent all the pore for the tested area of sample. Pore area distribution for sample (a) CuPET10 (b) CuPET20 (c) CuPET30.
Equivalence hypothesis verification and calculation of nonwoven equivalent woven fabric pores
Inspired by existing model calculated from the woven structured EMI shielding textile, if the structural parameters of nonwovens are equivalently converted into the structural parameters of woven fabrics, then it’s possible to use the existing model as the basic calculation of SE for nonwovens. In this case, the simulation method was used to verify this hypothesis. The detailed building up procedure of simulation environment was published by our previous research. 36
Depending on the cutoff frequency, the size of the waveguide determined the measurement range of frequency, for example, the cutoff frequency at the lowest order mode and next mode for type WR650 waveguide are 0.9 GHz and 1.816 GHz, the recommended frequency band for this type of waveguide is 1–1.5 GHz. For extended request of measured frequency band, different type of waveguide is necessary to be used in this simulation environment.
Regarding the EMI shielding simulation for textile based shielding material, the parameters which influencing the EMI shielding performance have been studied by many studies.8,51,52 In general, there are three key parameters mainly determine the material EMI shielding property, which are (1) Material electrical properties (conductivity and permeability) (2) Material porosity (3) Material thickness.
The model converting process was presented in the Figure 6(a). The first step is converting the geometrical model into simulation model with same distribution of pore size, porosity, thickness, material conductivity as the real sample. To fit the size of the waveguide, the size of the simulation nonwoven mode was controlled same as the cross section of waveguide and the numbers of pores was controlled accordingly. The second step is changing the shape of pores from different pore size in nonwoven simulation model into square size in woven model. In the simulation model, the numbers of pores in converted woven model remains same as in the nonwoven model. The three key factors maintained same as the real sample and the numbers of pores was adjusted accordingly. Ansys HFSS EMI shielding simulation run for equivalence hypothesis verification (a) Geometrical model converting process, the nonwoven model was converted into equivalence woven model (b) Waveguide model designed for the EMI shielding simulation run (c) The EMI shielding simulation results for nonwoven sample with different pore size and converted woven fabric with same pore size (d) The EMI shielding simulation results of CuPET10 (e) CuPET20 (f) CuPET30 (g) electrical filed strength distribution of metalized nonwoven fabric inside the waveguide model.
Boundary setting parameters for the EMI shielding simulation run on waveguide model in Ansys HFSS

The key issue of simulation process was using optimized model instead of original textile geometrical model. The simulation software was hard to meshing the complex fiber-scaled textile geometrical model, the time cost was more than 4 h even with small piece of fabric. For optimized model, all key parameters which influence the EMI shielding property was maintained exactly same as geometrical model. In this case, the accuracy and efficiency of simulation run for optimized model was improved. The time cost for one sample simulation run was reduced to 20 min.
For better comparing the influence of different model on EMI shielding effect, the nonwoven simulation model with different pore size and woven model with same pore size were imported into the waveguide type WR650 (Figure 6(b)). The simulated result was presented in the Figure 6(c), it clearly to see that the result of woven model was more consistent with the actual test results. This result to some extent verifies the feasibility of the equivalent woven fabric model in the prediction of electromagnetic shielding effectiveness. After building more waveguide type, the frequency band from 500 MHz to 1500 MHz was available for the simulation run and the result presented good agreement from optimized woven model simulation result to real measured model as presented in Figure 6(d)–(f). This result is also consistent with the results confirmed in previous electromagnetic shielding simulation studies. 36 The electrical field distribution filed presented in Figure 6(g) clearly shows that the EMI shielding effect of the shielding material.
The simulation results exhibit favorable consistency with the actual test results due to the consistent alignment of the three crucial parameters that impact the electromagnetic shielding effectiveness in the optimized woven fabric model. In this case, it’s possible to use converted woven model instead of nonwoven model to predict the EMI shielding effectiveness. Regarding to the previous discussion about the infeasibility of existing models for nonwovens, the key point is converting the nonwoven pores parameters into woven pores parameters for calculating the maximum pore dimension and numbers of pores. The connecting point of both model is the volume porosity, which must be maintained as same value in both models. It should be noted why optical porosity was not employed in the calculation of the pore size, as the optical porosity can exhibit variation depending on the threshold and sample size.
The volume porosity of nonwoven textiles (Vp%) can be calculated according to the fiber volume ratio (Vfi%) when ignoring the mass of air in the textile sample, the calculation equation was presented in equation (16).
For real EMI shielding measurement, the coaxial transmission line method was selected which fitting the measured frequency band from 500 MHz to 1.5 GHz. The structure of the measurement equipment was present in the Figure 7. Due to the structure of the sample holder, the real measured area of sample (Acal) can be calculated in: (a) Cross section of EMI shielding measurement sample holder with reference sample according to ASTM D4935-10 (b) The sample holder dimension.

In this case, the calculated sample volume is:
In this calculated part of the sample, the total pore volume can be calculated together with the volume porosity as:
The total numbers of the pores in the CuPET samples can be analyzed via the microscope image by image processing. Assuming the pore distribution ratio is approximately even in the CuPET sample, which is not true because of the randomly fiber layout of the nonwoven materials, even in the same area size but different place of the sample, the numbers of pores must be different. But considering the EMI shielding calculation, the difference in the number of pores caused by the uneven distribution is negligible, because this difference has very limited effect on the final calculation results in the model. In this condition, the following equation holds:
To convert the nonwoven pore into woven pore parameters, assuming the shape of the pore is square. Together with the equations (17)–(20), the maximum size of the converted pore is the diagonal of a square, which can be calculated in the following equation (21):
It should be noticed that, the principal impetus and achievement of this research lie in the development of a novel empirical mathematical model for electromagnetic shielding effectiveness pertaining to metallized nonwoven fabrics, as opposed to the focus on simulation outcomes. The concept of transforming nonwoven material parameters into equivalent woven parameters and subsequently integrating these converted parameters into the mathematical model was empirically substantiated through simulation. In essence, the simulation findings serve to corroborate the feasibility of obtaining precise predictive values for electromagnetic shielding effectiveness following this parameter transformation process.
Optimization of existing model


The correction value f(K) for each sample at the minimum RMSE level.
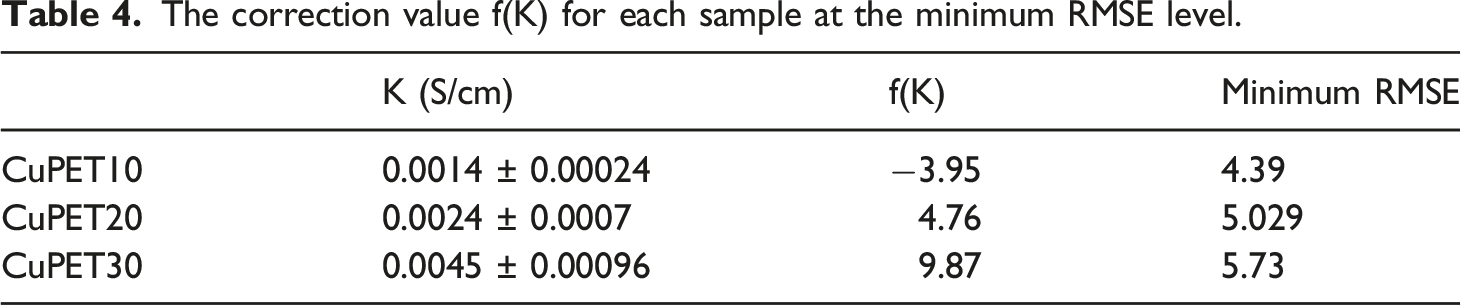
After analyzing the relationship between the conductivity and correction value, the two sets of data showed a strong linear relationship (Figure 8) The regression equation can be used as the correction value calculation as presented in equation (24). Linear relation between the conductivity and correction value.

Using this equation in equation (22)–(24), the final equation for calculation the nonwoven materials EMI shielding property can be presented as follow:
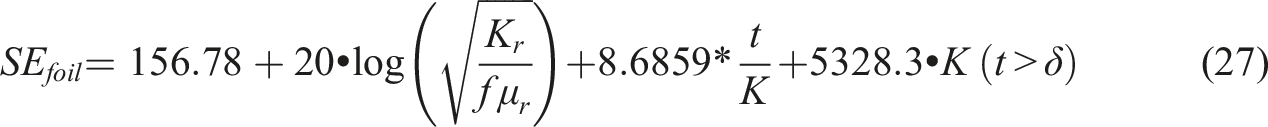
Together with equations (9), (10), and (21), the optimized mathematical model was prepared for calculating the EMI shielding effectiveness for thin nonwoven-based material.
In essence, this newly devised empirical mathematical model builds upon prior models by incorporating structural characteristic parameters of textile materials, as employed in earlier models. Following validation through simulation, the structural parameters specific to nonwoven fabrics can be effectively transformed into their woven fabric counterparts. Subsequently, through model refinement based on the conductivity relationship inherent to the fabric, it becomes applicable for predicting the electromagnetic shielding effectiveness of metallized nonwovens.
Results and discussion
Electromagnetic interference shielding effectiveness measurement
The average EMI shielding effectiveness (SE) results of the single-layer CuPET specimens from five times test were presented in Figure 9. The data reveals that CuPET10 exhibits the relatively lower SE values, ranging from 44.1 dB to 55.3 dB, within the frequency range of 500 MHz to 3 GHz. On the other hand, CuPET30 demonstrates relatively higher SE values, ranging from 57.3 dB to 72.6 dB in the same frequency band. These findings indicate that the SE performance of CuPET is influenced by the thickness, conductivity, and porosity of the sample. CuPET30 have a higher mass per unit area, which perform the higher thickness and lower porosity compared to other samples. As mentioned in the previous part, the material conductivity has strong influence on the EMSE, which also been proved in the Figure 9(d). With the increasing of the material conductivity, the EMI shielding performance also presented the linear increasing trend. In this case the CuPET30 displaying superior EMI shielding properties due to a greater concentration of metalized fibers compared to CuPET10 and CuPET20. EMI shielding test results of (a) CuPET10 (b) CuPET20 (c) CuPET30 (d) the relationship between material conductivity and average EMSE between 500 MHz and 1500 MHz.
Based on the classification criteria for EMI shielding textile, 53 all single-layer MEFTEX samples fall into the “excellent” category for Class Ⅱ general use. In terms of Class Ⅰ Professional use, CuPET10 meets the SE requirements for grade “AAA” (Good), while CuPET 20 and CuPET 30 meet the SE requirements falling between grade “AAAA” (Very good) and “AAAAA” (Excellent).
Pore analysis results and equivalent parameters
Pore analysis was realized via the image analysis method from the microscope picture. (Figure 10) From the image analysis results, the numbers of pores in the image (nimage) can be calculated. The results presented in Table 2. Microscope image of (a) CuPET10 (b) CuPET20 (c) CuPET30 and converted binary image for porosity analysis of (d) CuPET10 (e) CuPET20 (f) CuPET30.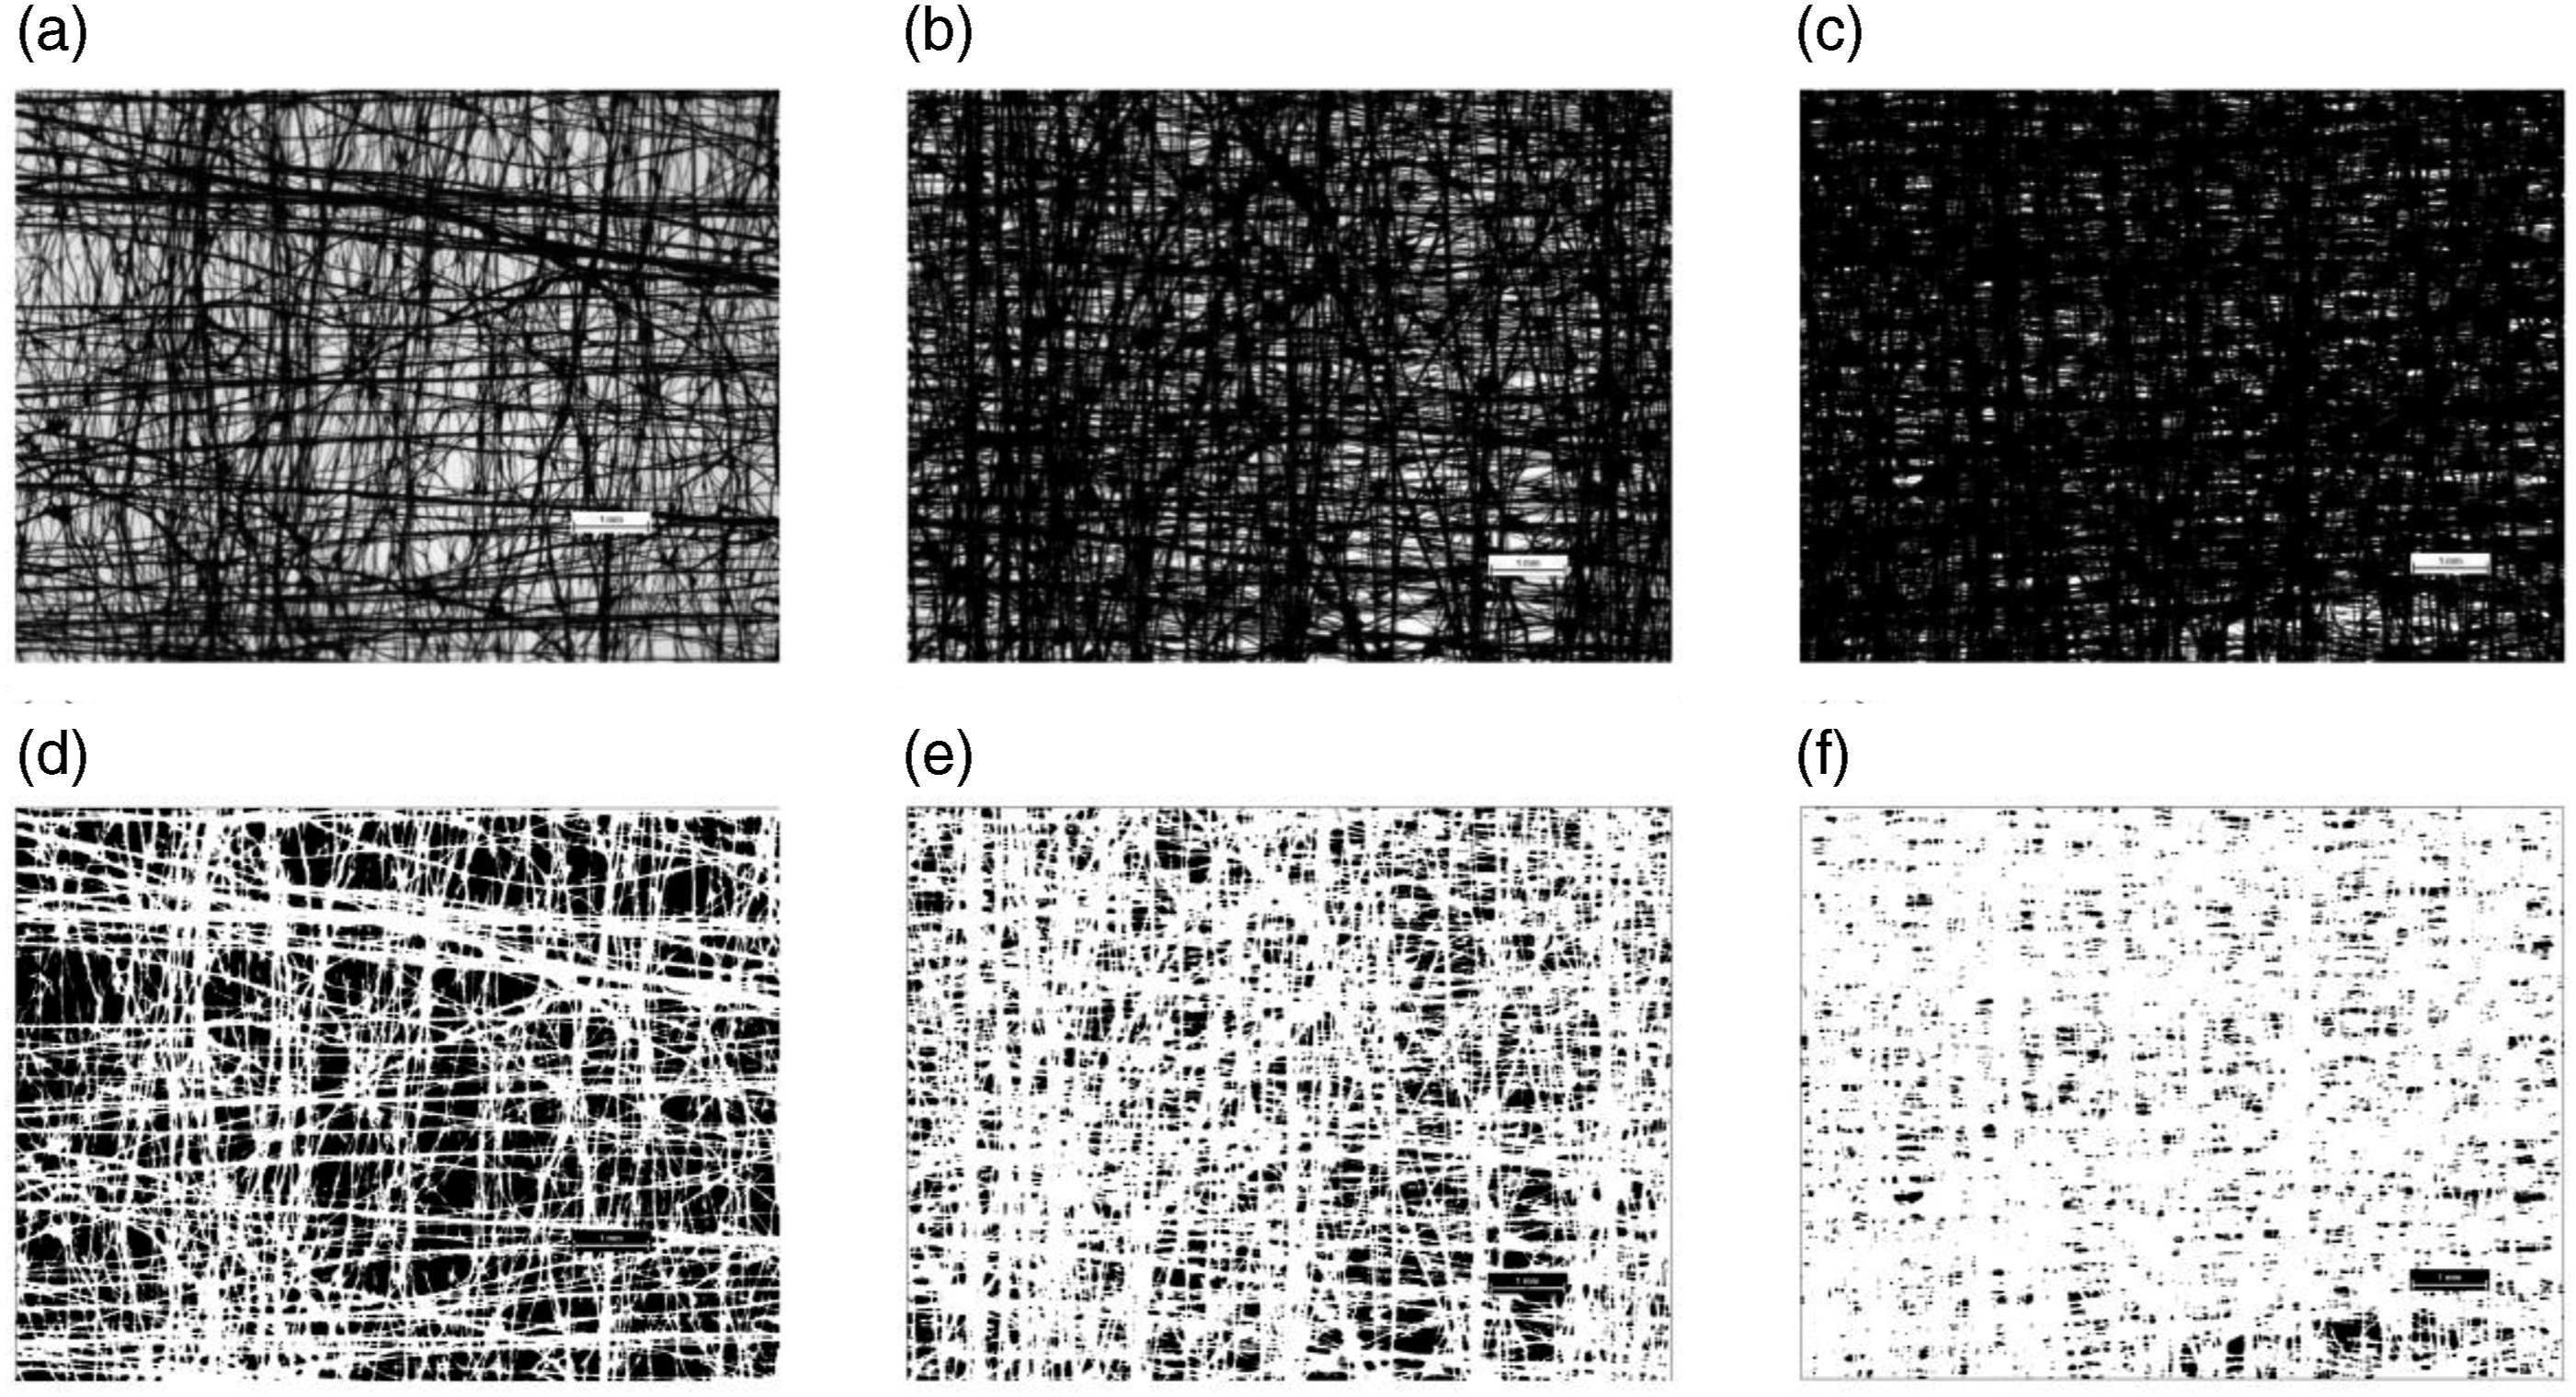
Calculated numbers of pores in measurement area and the maximum size of converted pore.

Prediction of metalized nonwoven fabric EMSE via optimized mathematical model
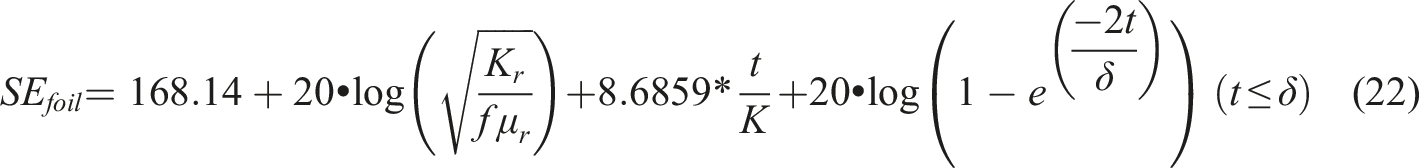
The basic parameters which are necessary for the calculation of EMSE for nonwoven fabrics have been listed in Tables (1), (3), and (4). Using equations (9), (10), (21), (26), and (27) it’s possible to calculate the EMSE of these CuPET samples. There is one parameter should be noticed, the conductivity. The material conductivity is very sensitive to the EMSE performance of the shielding material. Normally the distribution of metalized fiber in nonwoven materials is uneven, which will cause the conductivity difference in different area of the material. In this case, to predict the EMSE performance of metalized nonwoven material, it’s reasonable to calculate the deviations in conductivity data. In the paper the 95% of confidence interval with lower and upper limit was used to present the changes of conductivity which showed in Table 4. With the lower and upper limit value of conductivity together with other necessary calculated parameters, a Python script was prepared to calculate and graph the EMSE which presented in Figure 11 Frequency dependence EMI shielding effectiveness of model predict value and measured value from sample (a) CuPET10 (b) CuPET20 (c) CuPET30 (d) Comparison between predict SE value and measured value at 1.5 GHz for each sample.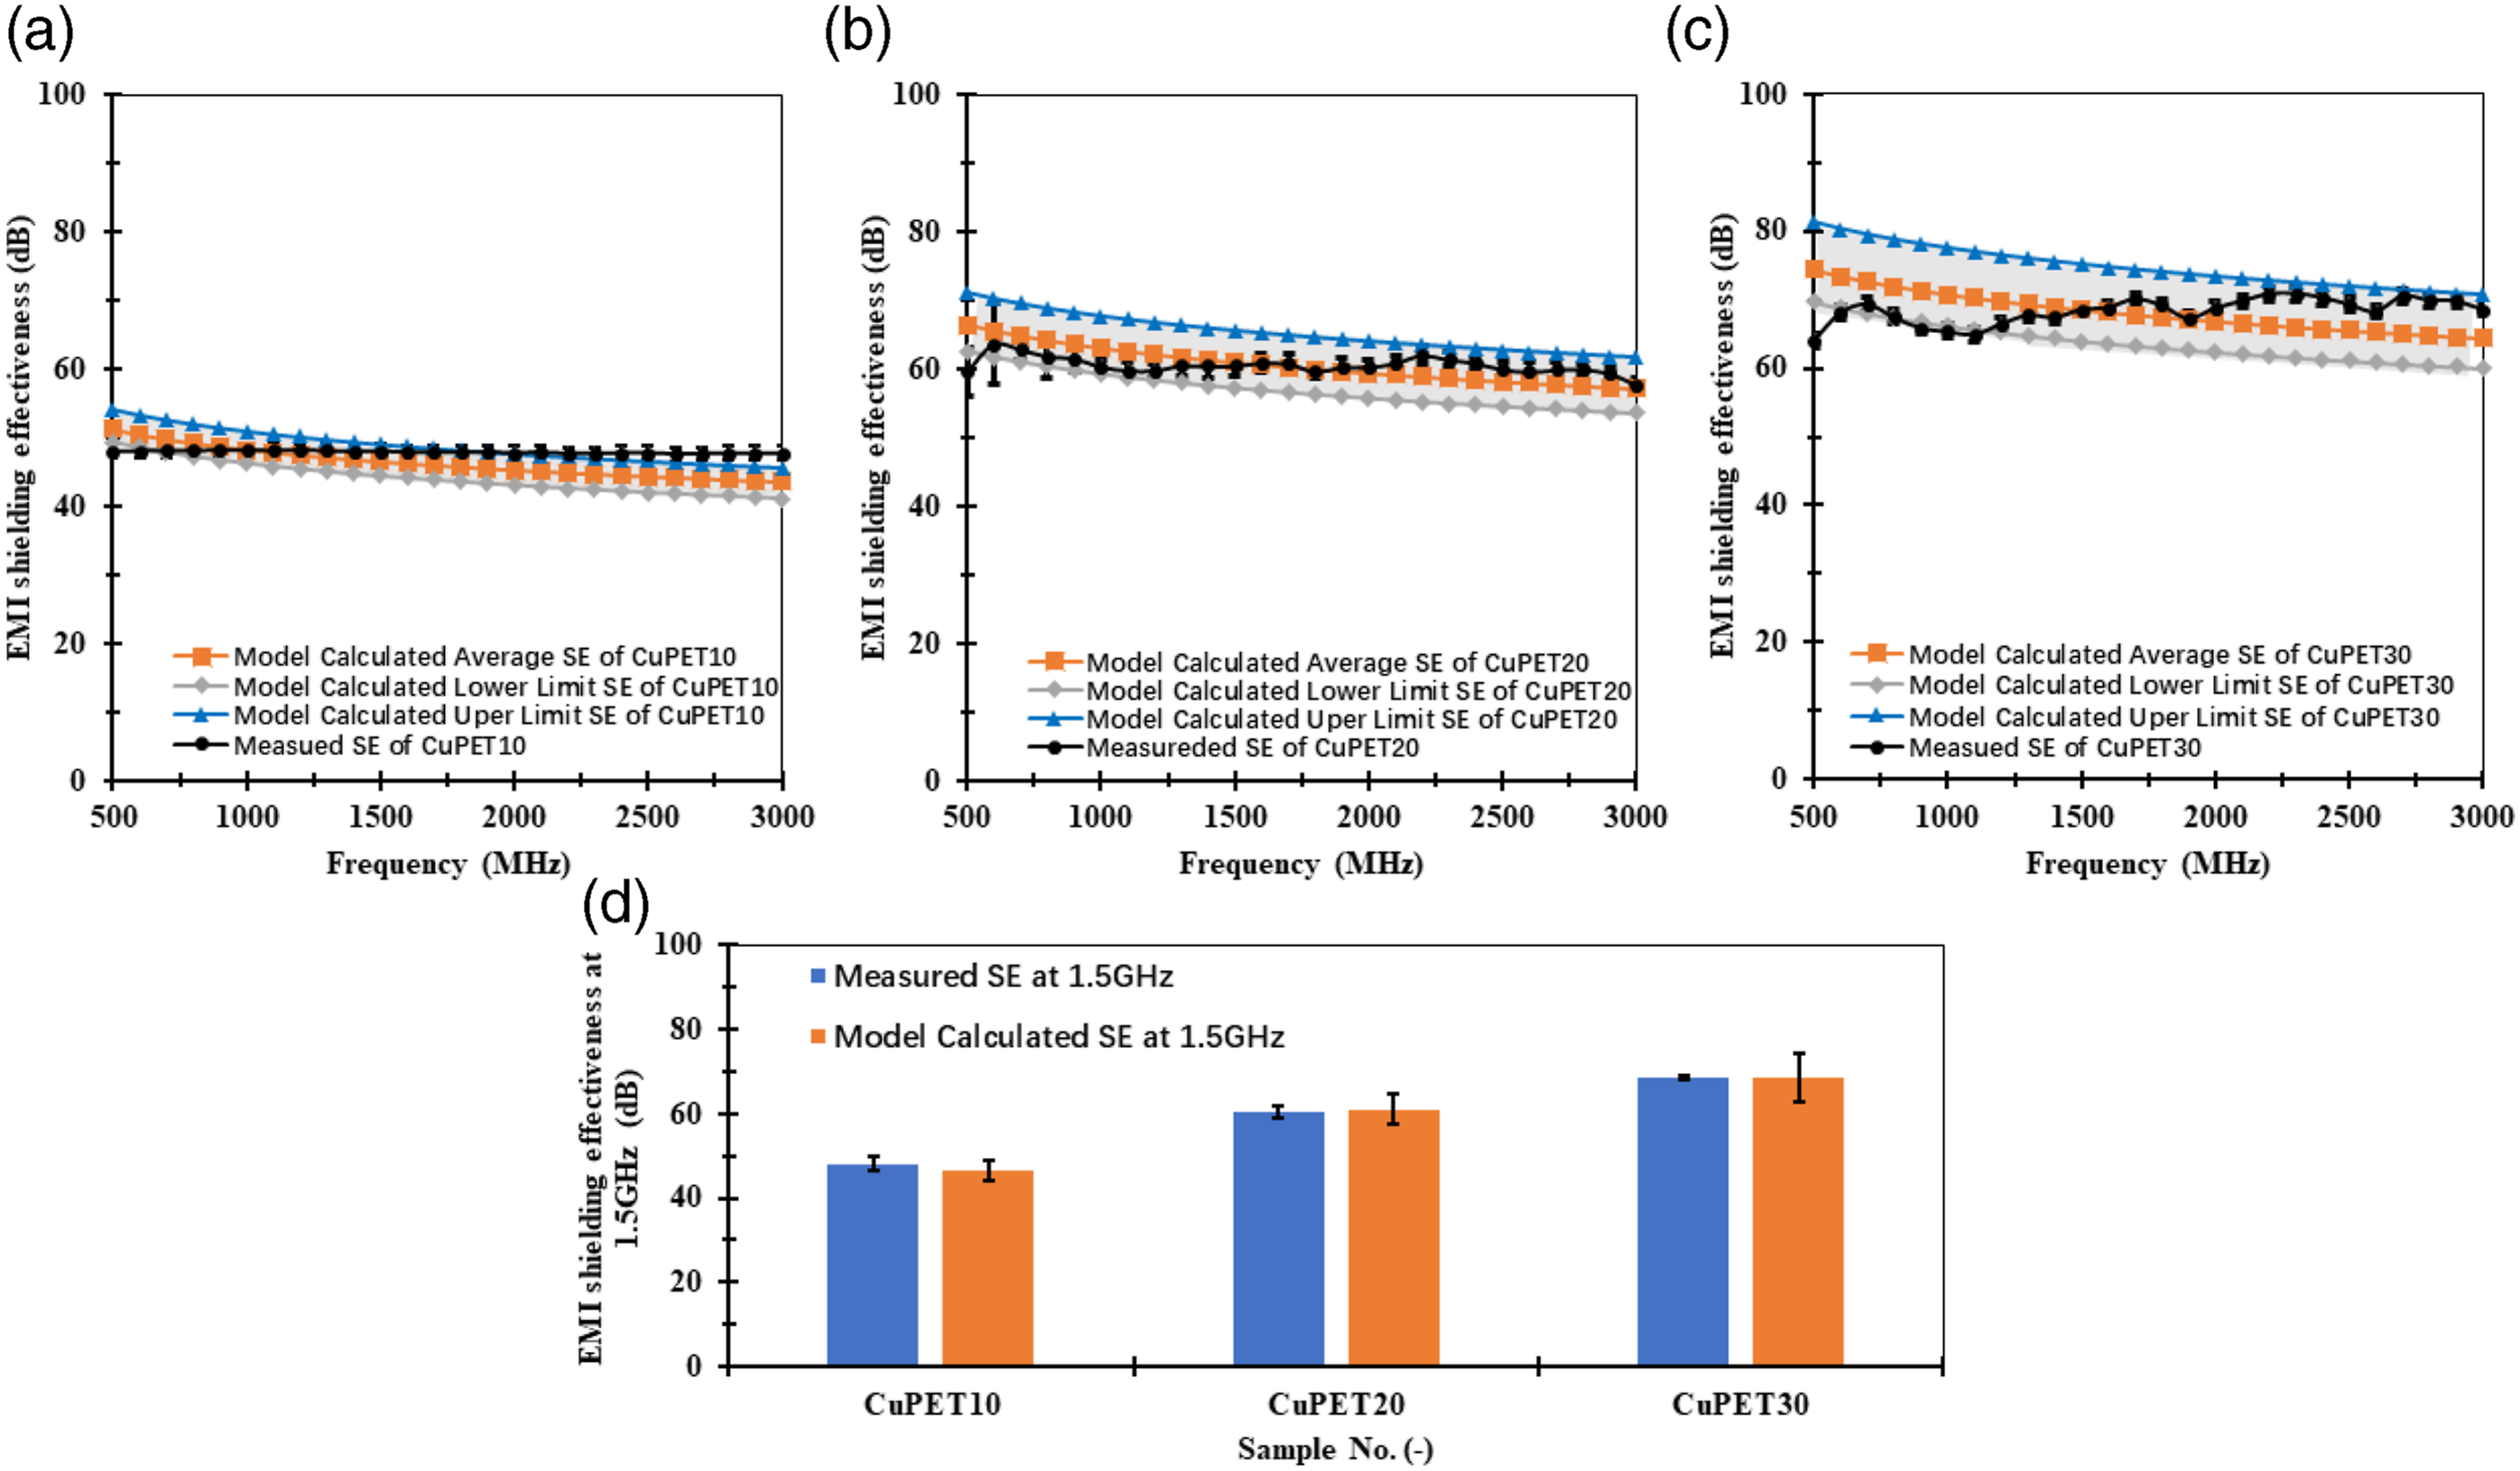
This Figure 11 confirms that the good agreement between mathematical model calculated value and measured data. The curve of measured data was placed between the predicted area from mathematical model calculated values. The lower and upper limit SE was calculated based on the lower and upper limit of measured conductivity. Both SE lower and higher limit built the filed that belongs to the results from mathematical calculation.
It’s clearly to see that for sample CuPET20 and CuPET30 the majority part of measured value curve was in the model predicted field, and the model calculated average SE presented good agreement with the measured value. For CuPET10 between 500 MHz and 1500 MHz the model predict field can cover the measured value, from 1500 MHz to 3000 MHz the measured value curve is over prediction field and close to the upper limit line. Within the 3 GHz frequency band, the empirical SE of CuPET20 and CuPET30 reached 57.8 dB and 68.56 dB, respectively. Notably, these values align closely with the anticipated model predictions, encompassing a range of 53.6 dB–63.7 dB for CuPET20 and 60.02 dB–70.65 dB for CuPET30. In contrast, the experimental SE measurement for CuPET10 registered at 47.78 dB, indicating a deviation from the projected SE range established by the predictive model, which spanned from 41.18 dB to 45.76 dB. For the reason given above, due to the low thickness of CuPET10, the multireflection effect in the material should be considered. In practice there is a high impact on multireflection attenuation from thickness, pore morphology and surface area. With this mathematical mode, it’s very limited consider all these parameters in the multireflection part of calculation, that caused the inaccurate to predict the attenuation with multireflection case.
In Figure 11(d) the comparison of model calculated and measured values of EMSE for all samples at 1500 MHz (1.5 GHz). This frequency was analyzed because this frequency is close to the working frequencies of electric devices, for example Global System for Mobile Communications (GSM) support the 1800 MHz band. The result shows good agreement from measured and model calculated values, there is no mathematical significant difference from these two values.
To judge whether the average difference between the model calculated and measured result is significant or caused by random error, the statistical analysis method of two-sample t-test was performed. The significance level α = 0.05, and each result from the mathematical model calculated and measured groups on the same frequency point is compared. The null hypothesis is given as:
This hypothesis means the mean value of SE calculated by mathematical model μc is equal to that of SE measured by the coaxial transmission line method μm.
The alternative hypothesis is defined as:
P-value of two-sample t-test for model calculated SE value and measured SE value.
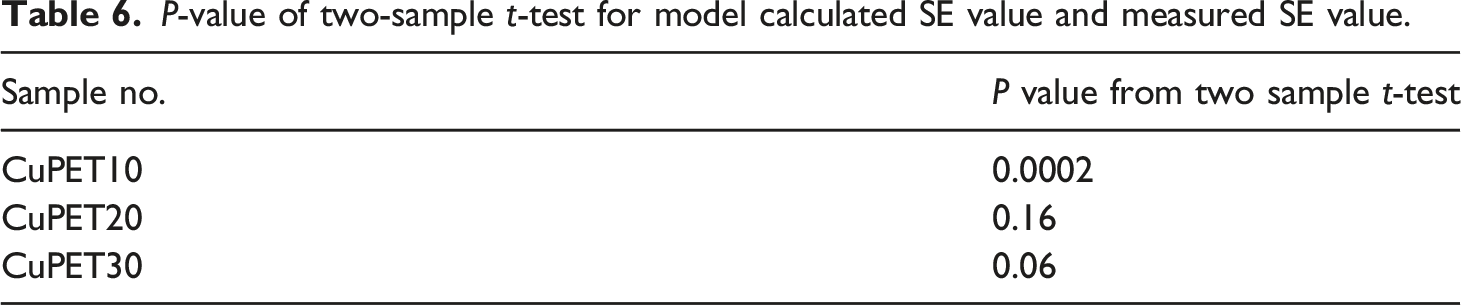
The t-test result presented a significant difference between the mean value of measured and model calculated SE for the sample CuPET10, which p-value is less than 0.05. For samples CuPET20 and CuPET30, the t-test confirms no significant difference between the measured and simulated results, with a p-value of more than 0.05. This conclusion matches the results from Figure 11(b)–(c) that the simulated results from CuPET20 and CuPET30 perform better compatibility with experimentally measured results.
Conclusion
This study has developed a more precise mathematical model to assess the electromagnetic shielding effectiveness (EMSE) of metalized nonwoven fabrics, accounting for variations in structural parameters and electrical conductivity. A novel aspect of this modeling approach for metalized nonwoven fabrics involves the conversion of critical parameters that influence EMI shielding performance within nonwoven structures into their equivalent woven structural counterparts. Furthermore, the existing model has been optimized to enhance compatibility with metalized nonwovens, resulting in improved accuracy and reliability in predicting their EMSE.
To demonstrate the effectiveness of the developed mathematical model, three different copper-plated nonwoven materials with varying EMI shielding performance were selected. It was verified that the mathematical model is usable with a good compatibility compared to measured values for samples without considering the multireflection attenuation, the EMSE curve placed between the prediction filed which constructed by the lower and higher limit cure. For sample CuPET10 with multireflection attenuation, the accuracy rate of this mathematical was decreased. From the p value of two samples t-test results confirms no significant difference between the measured and simulated results for samples CuPET20 and CuPET30, but for CuPET10 there is a significant difference between the mean value of measured and model calculated SE. This result approved the conclusion that this mathematical model is more suitable for material without considering of multireflection attenuation. In this case, it’s meaningful to make further study to optimize the parameters in multireflection attenuation part for wider application of metalized nonwoven fabrics.
Footnotes
Acknowledgements
We acknowledge CzechNanoLab Research Infrastructure supported by MEYS CR (LM2023051).
Declaration of conflicting interests
The author(s) declared no potential conflicts of interest with respect to the research, authorship, and/or publication of this article.
Funding
This work was supported by the Ministry of Education, Youth and Sports of the Czech Republic and the European Union - European Structural and Investment Funds in the Frames of Operational Program Research, Development and Education - project Hybrid Materials for Hierarchical Structures (HyHi, Reg. No. CZ.02.1.01/0.0/0.0/16_019/0000843).