
Abstract
The research aims the development of knitted reinforcement structures for inducing self-diagnostic properties into knitted reinforced composites for structural health monitoring. Conductive carbon fiber was used in knitted inlaid structures as inlay yarns, and l × 1 Rib knitted base fabric of polyester filament yarn was used for knitting. The reinforcement’s conductive nature induced self-diagnostic properties into composites using correlation of mechanical damages and changes in electrical resistance values. Single and double stimuli layers and inlay patterns of 3 × 1, 6 × 1 and 9 × 1 was used to check their impact on self-diagnostic properties. Mechanical testing and real-time electrical resistance monitoring proved knitted structures as a solution to induce self-diagnostic properties into composite materials. Composites having double stimuli (conductive) layers exhibited better self-diagnostic properties than single stimuli layer composites, and the self-diagnostic properties also improved as the inlay pattern of reinforcement moved from 9 × 1 to 6 × 1 and 3 × 1 inlay. Such knitted reinforced self-diagnostic composites could be practically used in structural health monitoring applications, e.g., complicated structures of large buildings infrastructures and machinery which require record of each minor happening with structures to keep smooth and successful running of the system.
Keywords
Introduction
Knitting is a fabric formation technique via interlooping of yarns.1–5 A straight yarn is bent into loops, and those loops are then intermeshed. Knitting needles draw newly formed loops from old loops, and the action is repeated for whole fabric formation.6–8 Knitting comprises of two types termed warp and weft knitting. In weft knitting, yarn runs along the widthwise (weft) direction of the fabric, and such knitted fabrics can be raveled by pulling a single yarn from an end. While in warp knitting, yarn runs along the lengthwise (warp) direction of fabric.8–11 Warp knitted fabrics have poor elastic properties than weft knitted fabrics but are dimensionally stable. 12 If compared with woven fabrics, the stretch-ability of warp knitted fabrics lies between woven and weft knits. 13 Composites are materials formed via two or more materials for achieving properties better than lone materials.14,15 Matrix and reinforcement are significant components of modern composites; the matrix is a continuous phase providing shape to composite while reinforcement could be continuous or discontinuous responsible for mechanical stability of composites. 16 Textile based composites consist of textile materials, e.g., fibers, yarns and fabrics as reinforcements. 17 Knitted reinforced composites have knitted fabrics as a reinforcement material.17–19 Knitted fabrics are dimensionally unstable, have greater stretch, and can be molded into complex shapes without any folds issue.20–22 Knitted reinforced composites are famous for their excellent interlaminar, good drapability, good shape ability and good impact properties with high production rate and short production period. 23 The tensile properties of knitted fabrics seem to be poor. To keep knitted fabric’s properties unidirectional, the yarn inlaying technique is used. 24 Inlaid structures consist of straight yarn passing through the whole length or width of knitted fabrics along with knitted loops. This method provides more tensile strength to knitted fabrics in the direction of that inlaid yarn; hence unidirectional mechanical properties enhance up. 25
Self-diagnosis is the material’s ability of identifying changes happening in it; the changes could be related to any behaviours, e.g., mechanical, thermal, chemical etc.26,27 Self-diagnostic properties are used for real-time health monitoring of different structures. 28 Structural health monitoring/self-diagnostic systems could be architected in several ways. Intelligent devices are commonly used for this purpose. The term “intelligent” refers to the devices which use computational power for working. These intelligent devices aren’t a natural part of any material regarding the performance but are responsible for sensing specific material stimuli by single processing techniques. 29 Piezoelectric materials also induce self-diagnostic properties in systems because of their ability to generate electrical voltage impulses when mechanical stress is applied on them. When electrical voltage is applied on piezoelectric materials, they produce a positive volumetric.30–32 Piezoelectric materials are embedded in reinforcements of composites and are connected to the external circuits, the amount of voltage generated in response to mechanical applications is noted, and the voltage values before breaking point is fed in the sensor at which users are to be alarmed. 33 Sometimes voltage is continuously applied on piezoelectric transducers attached on the target material. As a result of applied voltage, guided waves are generated inside the material which further travel inside the material. A sensing mechanism is also installed on materials that sense waves' intensity and travelling path. If damage is encountered in the material, travelling waves are disturbed, and sensor realizes that the guided wave’s properties deviate from the original one, an alarming signal is generated. 34 Nanomaterials possess nanoscale features and are capable of exhibiting extraordinary functions. 35 Materials having conductive properties at nano levels allow them to be used for self-diagnosis/structural health monitoring purposes. 36
Historically, self-diagnostic properties have been induced into composites using PZT transduces onto various points of a composite and examining generated voltage peaks w. r. t structural health status of composite. 37 Bucky paper is a thin membrane like structure consisting of highly entangled carbon nanotubes and having good electromechanical properties, which allow it to change electrical resistance values with induced strain. The use of bucky paper membranes in the interlaminar region of laminated composites is useful in inducing self-diagnostic properties in composites. 38 Fiber-Bragg Grating (FBG) sensors work by reflecting a narrower bandwidth of light while transmitting all other wavelength, while the structural damages of sensor could change the bandwidth of reflected light. Hence, for self-diagnosis FBG sensors embedment into composites serve vital. 39 Similarly, composite conductive powders in epoxies are helpful in structural health monitoring. 40 Along with self-diagnostic properties induction techniques, composites' work environment greatly influences self-diagnostic properties, as composites exhibit different structural health monitoring trends in different testing environments and methods. 41 An integrated network of piezoelectric transducers and carbon fibers in laminated composites is considered a highly efficient method of structural health monitoring, and the method is preferable in aerospace applications. 42 Metallic bolts are an integral part of heavy machinery and infrastructures; embedding small self-diagnostic composite sensors on the bolts induces self-diagnostic properties in the whole metallic bolt. 43 Acoustic sensors are also vital for flaws detection in structures and structural health monitoring. 44 The influence of inlay yarn and composites stacking sequence has been assessed on mechanical properties, statistically proving the significant effect of inlay yarns and stacking sequence on mechanical characteristics. 45 Flexural characteristics of natural fiber reinforced knitted composites have been evaluated, referring to tightly knitted structures as finest. 46 Base knitting fabric structures are proved influential in determining the tensile strength of weft knitted biaxial tubular fabrics. 47 Experimental and numerical studies have been carried out considering meso-scale finite elemental analysis for biaxial glass/epoxy weft-knitted composites. 48 There isn’t any specific use of knitted fabrics in structural health monitoring applications. Hence, the research aims to produce knitted reinforced composites with self-diagnostic properties via the contribution of conductive fibers and unique knitted structural derivatives in reinforcement construction.
Methodology
Materials
Physical properties of materials.

Methods
Research methodology has been shown in Figure 1: Research methodology.
Design of experiment
The research has been carried out realizing the below-described design of experiment: Figure 2 Design of experiment.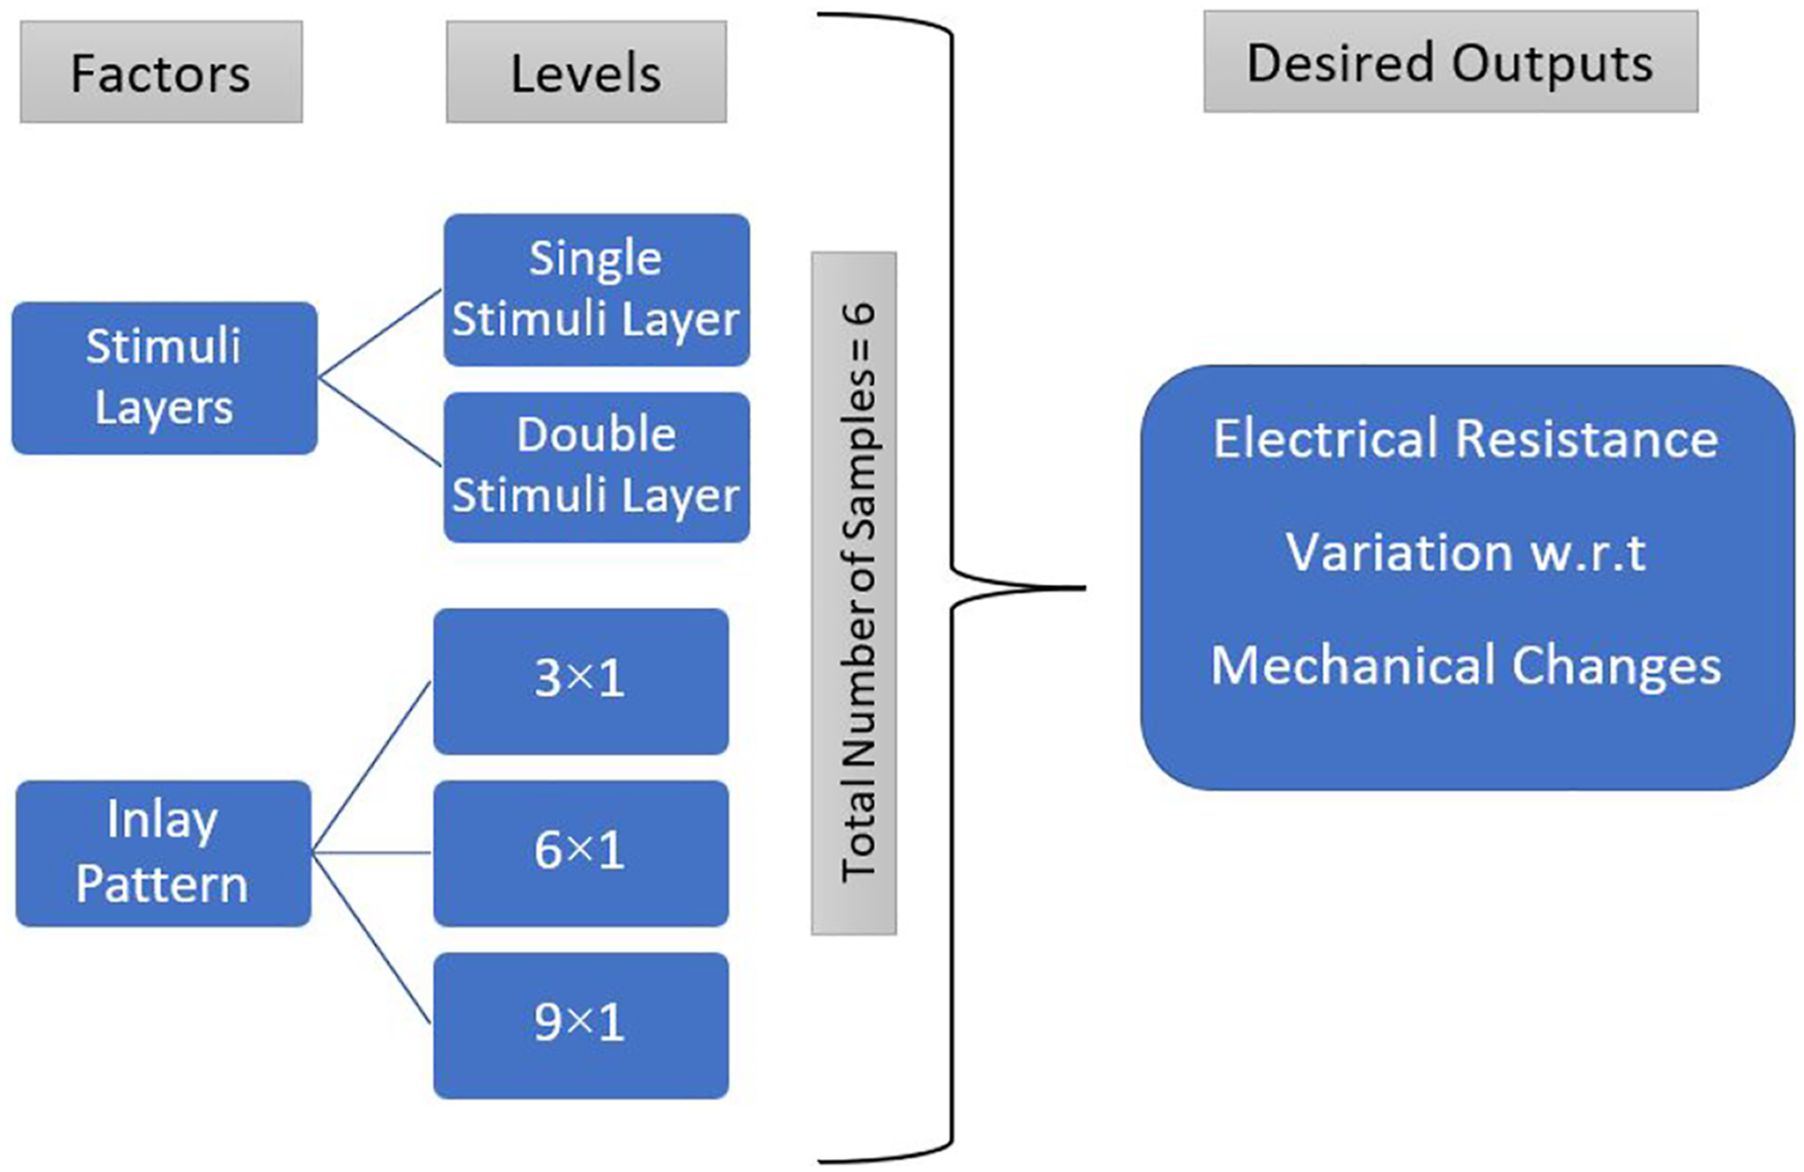
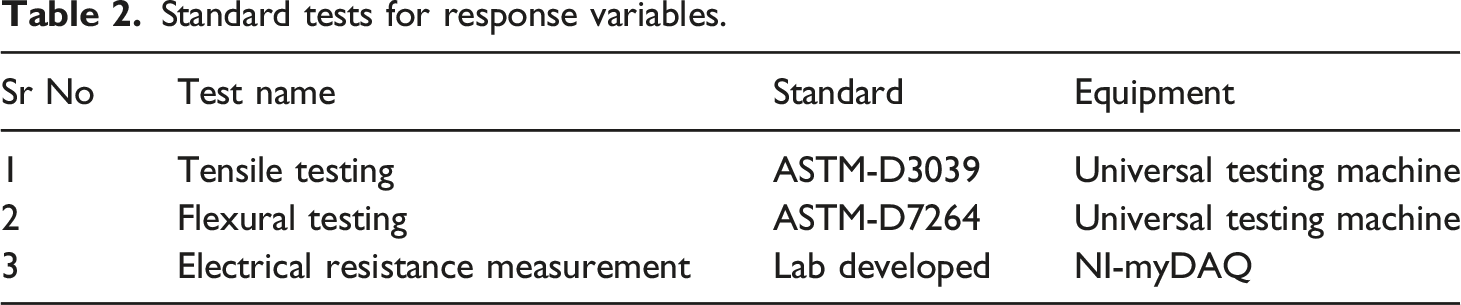
Standard tests for response variables.
Knitting
Inlay pattern was the experimental factor related to knitting for self-diagnostic properties in composites. Three levels of inlay pattern factor referred to three different inlay repeats of 3 × 1, 6 × 1 and 9 × 1 inlay as demonstrated in Figure 3(a). Here 3 × 1inlay pattern describes knitted fabric structure having inlay yarn after every three courses; similarly, 6 × 1 and 9 × 1 inlay patterns have inlay yarns after each sixth and ninth course, respectively. While base fabric was of plain 1 × 1 Rib knitting pattern. Reinforcement knitting was done on a Hand Flat V-Bed knitting machine having four feeders, seven gauge, 500 needles and a width of 36 inches. Knitted samples were relaxed for almost 24 h, and then the composites formation procedure was carried out. Figure 3(b) consists of animated reinforcements where base knitting yarn has been indicated by grey while inlay yarn has been highlighted with black color. (a) Diagrammatic structural notations (b) Animated images of 3 × 1 inlay.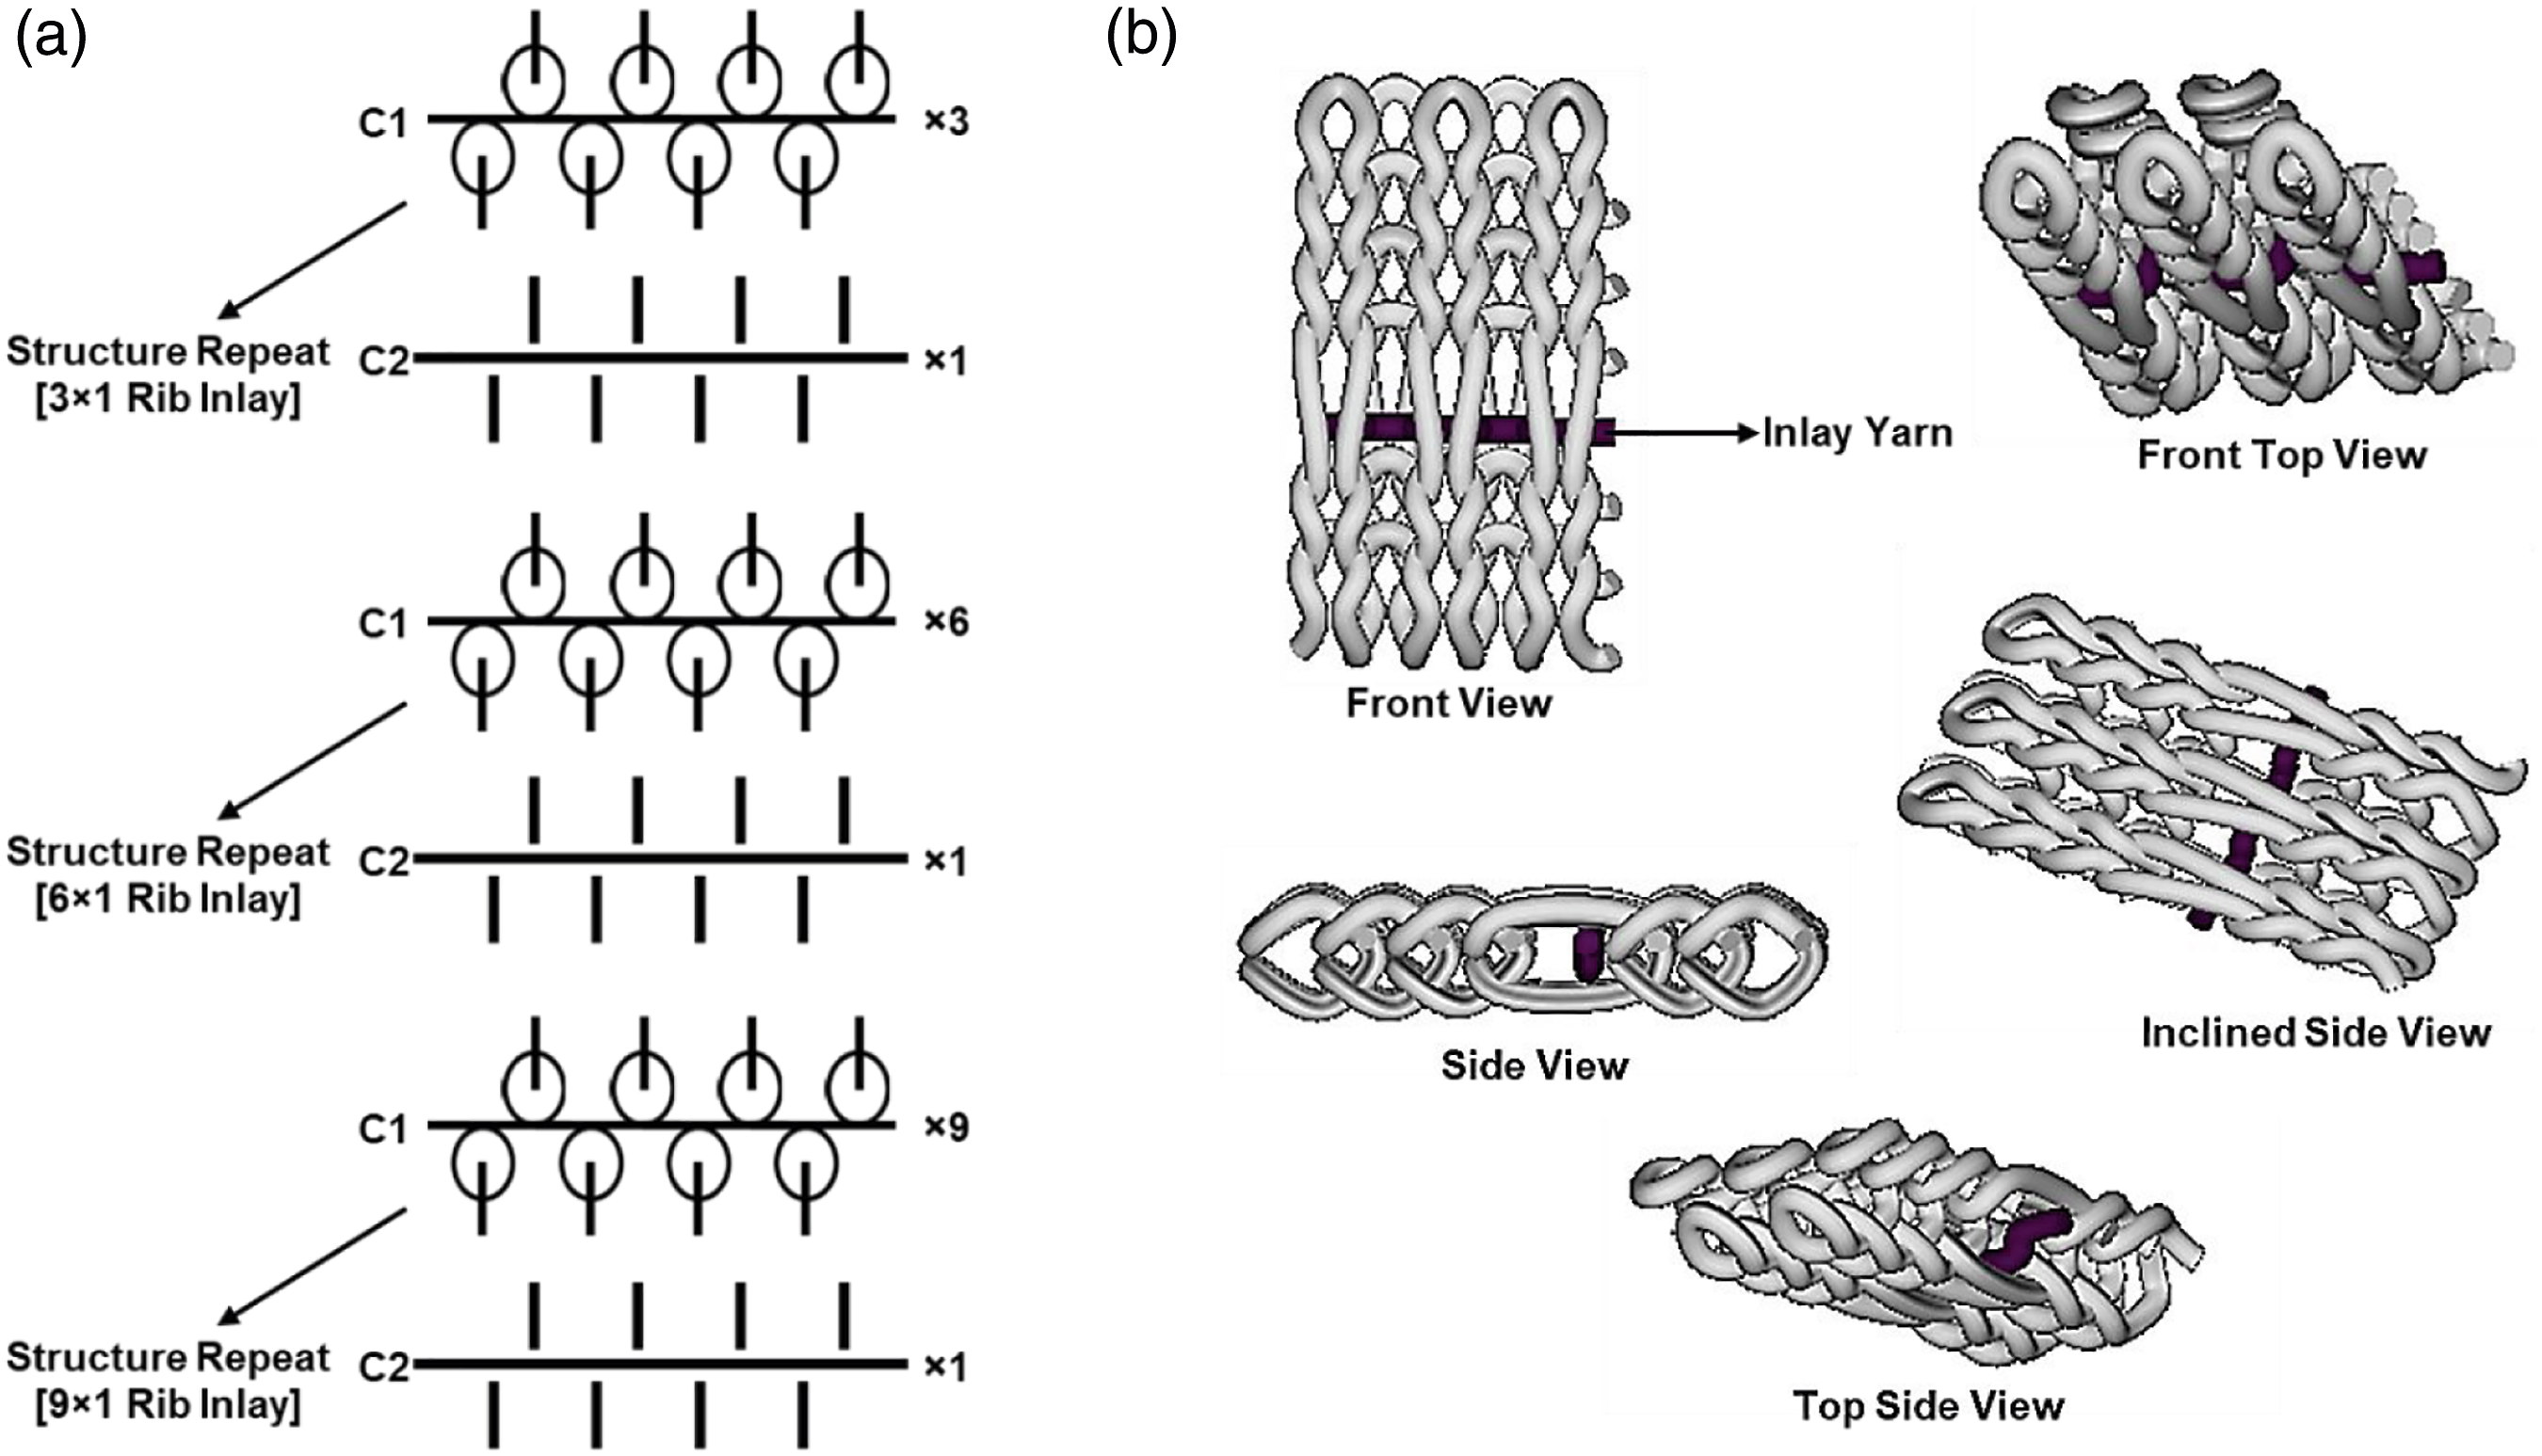
Hand layup of composites
Composites were manufactured using hand layup technique. Number of stimuli layers was the second experimental factor and was related to the composite manufacturing process. Single stimuli layer composites were three layered composites having top and bottom layers with plain 1 × 1 Rib reinforcement and sandwich layer with carbon inlaid yarns. Double stimuli layer composites consisted of two layers of carbon inlaid knitted fabrics sandwich between plain fabric layers Figure 4. Layers of reinforcements were stacked by hand with resin for composite development and dead weights placement on both top and bottom kept specimens under a constant compression and to avoid bubbles formation during evaporation of resin in curing process, while Teflon paper layers were also used to avoid stickiness of composites with tiles. Specimens were left at room temperature for 15 min after that were oven cured at 55°C for an hour and then left on room temperature for overnight. Composites plying sequence.
Characterizations
Mechanical damages were to be induced in specimens for measuring electrical resistance variations hence Bending and Tensile loading techniques were carried on Universal Testing Machine and electrical resistance was measured using a computerized electronic equipment NI-myDAQ. Successful measurement of electrical resistance required probs to be connected on both ends of composites accurately. For the purpose, Iron nails were drilled onto the carbon inlay point in standard size specimens prepared for tensile and flexural testing. Iron nails were further connected to an external wire which allowed circuit completion. Electrical resistance of each specimen was measured via Ammeter ensuring that nails insertion has allowed the current to flow through the composite and the electrical resistance is on noticeable values instead of out of limit (Figure 5). Characterizations setup.
Both tensile and flexural testing was performed on UTM (Universal Testing Machine) present in the NCCM laboratory of National Textile University of Pakistan.
53
ASTM-D3039 based tensile testing measures the simultaneous values of stress and strain using CRE (constant rate of elongation) principle. Rate of elongation during tensile testing was kept 1.5 mm/min and standard specimen sizes were of 203.2 mm × 25.4 mm in dimensions. Flexural testing on ASTM-D7264 standard keeps three point bending setup where the specimen is placed over two clamps extruding from downside on both sides of specimen horizontally while third notch comes from upside to down which applying force in center of specimen causing it to bend. Hence, bending strain of specimen is measured against standard applied force for bending. Flexural testing also followed CRE (constant rate of elongation) principle in the research with 1 mm/min rate of elongation. While the standard specimen size for flexural testing was of 120 mm × 13 mm. Electrical resistance measurement of specimens being tested required an accurate and very sensitive instrument that can detect very fine changes in the resistance of tested samples. NI-myDAQ instrument by manufacturers of National Instruments was utilized for electrical resistance measurement. The instrument was computer-controlled, and all required electric parameters were easily assessable, controllable, and recordable on computer screen (Figure 6).
54

Results & discussion
Physical characteristics
Reinforcement parameters
Physical parameters of reinforcements.

Stitch length of a knitted fabric defines the length of yarn consumed while loop formation. All samples were manufactured using constant stitch length with same machine and material parameters. Courses and Wales per centimeter are the number of courses and Wales in length of one cm. Stitch density is the number of stitches in one-cm square area. High stitch density leads to tighter fabric which results in higher GSM. Yarn linear density influences the GSM as courser yarns are of more weight as compared to the finer ones. Knitted specimens showed variation in their GSM just due to inlay yarns factor. As plain l × 1 Rib knitted fabric showed least GSM due to absence of inlay yarns while GSM started increasing from 9 × 1 to 6 × 1 and 3 × 1 inlaid fabrics due to increased number of inlay yarns in that area.
Composites parameters
Physical parameters of composites.

Mechanical properties
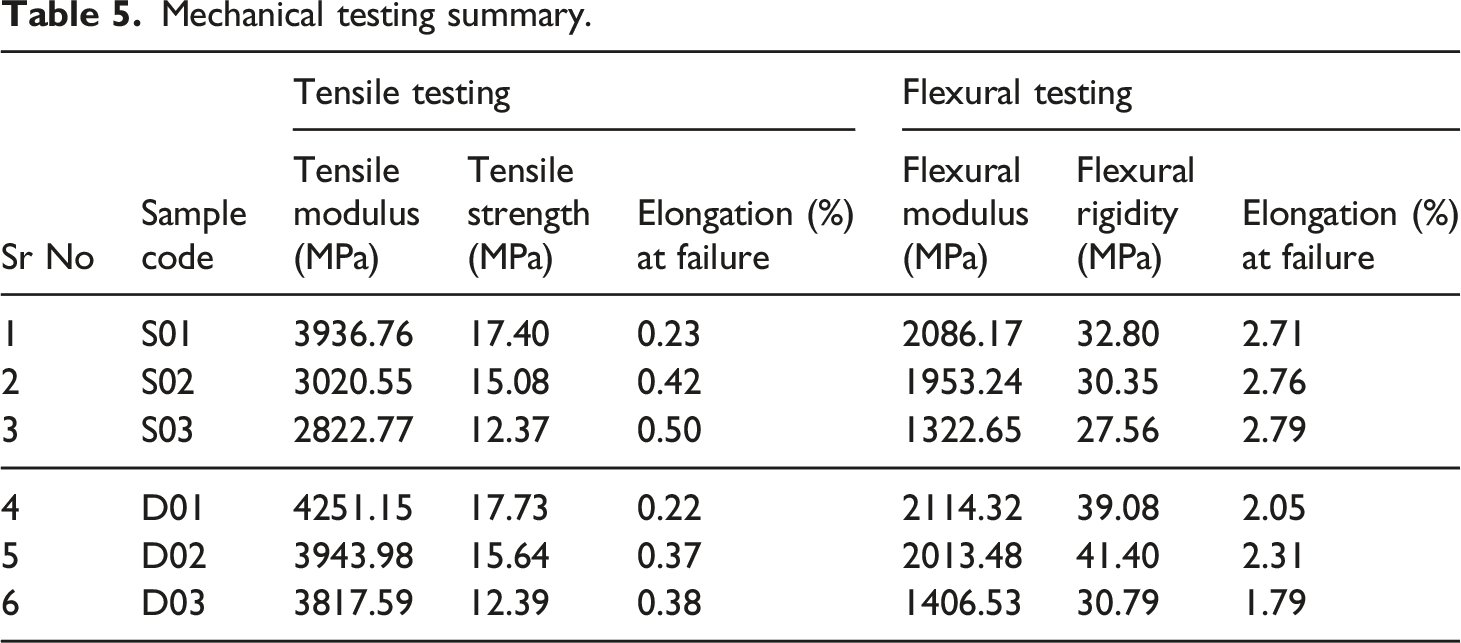
Mechanical testing summary.
Mechanical characterizations and self-diagnostic properties
Specimen’s testing results has been presented in the form stress strain curve and electrical resistance curve w. r. t time. Electrical resistance values were recorded live against the mechanical testing. Hence propagation of stress strain curve has caused to propagate electrical resistance curve simultaneously.
Tensile testing
Tensile testing plots exhibited the linear increase in strain curve w. r. t time is also causing an almost linear increase in electrical resistance of specimen. Electrical resistance keeps increasing as strain is being produced in composites. Strain follows an increasing linear path; however electrical resistance shows some jerks in its peaks for all tested specimens. The phenomenon occurs because cracks produced in reinforcement yarns led to electrical resistance variation in the specimen. As the initiated cracks propagate in the specimen, electrical resistance could not return towards its starting values. At fracture point, electrical resistance reaches the maximum, i.e., out of limit.
Peaks on standard stress-strain curves are related to peaks on electrical resistance curve. Mechanical damages lead to increase in electrical resistance of specimens. 3 × 1inlay composite’s graphs indicate three major points of damages on stress strain curve which are related to the three major electrical resistance increases on electrical resistance curve as highlighted in Figure 7. 6 × 1 Inlay pattern defines that carbon yarns have been inlaid after each sixth knitted course; hence overall sensitivity of stimuli layer is lesser as compared to 3 × 1 Inlay samples. Small variations in straight line have been observed in 6 × 1 inlay specimen’s stress-strain curve graph but corresponding electrical resistance curve shows more fluctuations indicating greater number of minor damages in structure which couldn’t be detected physically but could be interpreted through electrical resistance variations. Thus, electrical resistance assists accurately for structural health monitoring. 9 × 1 inlay specimen’s graphs exhibit similar trend of increasing height of stress strain curve causing increase in electrical resistance of specimen, but the electrical resistance’s sensitivity was observed lower than 3 × 1 and 6 × 1inlaid samples. Decreasing number of conductive yarns cause decrease in electrical resistance’s sensitivity towards the induced cracks, minor cracks couldn’t be sensed by a smaller number of conductive yarns in reinforcements. Tensile testing plots: Single stimuli layer composites.
Double stimuli layer specimens tensile testing results presented in Figure 8 exhibit same trend as was experienced in single stimuli layer composites. Double stimuli layer composites consisted of two conductive stimuli self-diagnostic layers which increased sensitivity of stimuli layers towards damages as compared to single stimuli layer composites. Inlay patterns influenced electrical resistance such that 3 × 1 inlaid composite’s electrical resistance curve increased more linearly with stress strain curve, 6 × 1 inlaid composite’s electrical resistance linearity was lower than 3 × 1 inlaid composite and 9 × 1inlaid composite exhibited least sensitivity having turbulent electrical resistance curve. All specimens exhibited brittle tension failure/fracture mode in tensile load testing.
55
Conductive materials were incorporated in reinforcement as inlay yarns, the conductivity of composites was majorly triggered by reinforcement damages. However, electrical resistance also showed small variations during initial deformations of specimens governed by matrix cracking i.e., stresses due to matrix cracking are distributed into whole composite (Figure 9) (similar pattern could be observed in all specimens). Jerks in electrical resistance are experienced as fibers cracking initiates, and fluctuations increase with increasing reinforcement damages leading electrical resistance to more higher values. However, electrical resistance exhibited major fluctuation after achieving a peak value due to strain hardening phenomena. Tensile testing plots: Double stimuli layer composites. Failure mechanics: Tensile testing.
55


Microscopic analysis (tensile loaded samples)
Analysis images: Tensile loading single & double stimuli layer composites.

Flexural testing
Synchronous propagation of strain and electrical resistance w. r. t time describes the self-diagnostic properties of knitted reinforced composites in flexural testing. Linear increase in stain caused almost linear increase in electrical resistance of specimen. Electrical resistance keeps increasing with flexural force and strain. Peaks being observed in stress-strain curves indicate induced damages. For each peak on standard stress-strain curve there is also a peak observed in electrical resistance time graph, that indicates that flaw occurs in the composite which caused electrical resistance to increase at the point. Further strain hardening phenomena decreased flexural force and bonds rearrangement served as precursor for decrease in electrical resistance. Pathway was opened for electric current to flow through the specimen via bonds rearrangement. Increase in 3 × 1 inlay specimen’s stress-strain curve led to increased electrical resistance due to damage in composite’s reinforcement. Similarly, 6 × 1 and 9 × 1 inlay specimens exhibited increase in electrical resistance parallel to stress-strain curve. Initial values of electrical resistance were higher for all specimens, as testing starts the electrical resistance values trend shifted downwards and then a quadratic increase in electrical resistance was experienced along with increase in stress and strain (Figure 10). This first decrease in electrical resistance and then increase phenomena is due to the fracture mechanics of specimens when those are tested for bending. During bending testing center one layer on the specimen remains under normal conditions while upper layer is under elongation and lower layer is under compression until any flaw occurs and starts propagating inwards the specimen. Hence initially during flexural testing center layer is under normal conditions and these normal conditions caused the electrical resistance of specimen to first decrease and then increase when cracks started their propagation (Figure11).
56
Failure mechanics: Flexural testing.
55
Flexural testing plots: Single stimuli layer composites.

Highlighted points of Figure 10 describe following phenomenon: (a) cracks initiation, (b) cracks combination, (c) cracks crossing normal line, and (d) flexural fracture. Moving upwards causes elongation force to increase and moving downwards causes compression force to increase, on the other hand center is under normal conditions having no elongation and compression.
56
Flexural failure mechanism remained same of all tested specimens. Double stimuli layer composites graphs have been presented in Figure 12. Flexural testing of double stimuli layer composites follows same trend as single stimuli layer composites, increasing standard force curve leads to increase in electrical resistance of specimens. Overall sensitivity of double stimuli layer composites was higher than single stimuli layer composites due to two conductive layers of reinforcement in double stimuli layer composites. 3 × 1 inlaid composites exhibited more precise self-diagnostic properties because of greater number of conductive yarns according to inlay pattern. 6 × 1 inlaid composite’s sensitivity was lower than 3 × 1 inlaid composites but higher than 9 × 1 inlaid composites. Flexural testing plots: Double stimuli layer composites.
Microscopic analysis (flexural loaded specimens)
Analysis images: Flexural loading single & double stimuli layer composites.

Inlay yarn pattern & electrical resistance
Electrical resistance of any material depends on its conductivity. Higher the conductivity lower will be the electrical resistance. A similar trend has been observed in the research. Increasing number of conductive yarns decreased the initial electrical resistance of specimens. However, variation in electrical resistance during testing was crack dependent (Figure 13). Double stimuli layer composite exhibited less electrical resistance values than single stimuli layer composites in tensile and flexural loadings. Linearity of electrical resistance versus time curve compromised when inlay pattern shifted from 3 × 1 to 6 × 1 and 9 × 1 in both single and double stimuli layer composites, number incorporated conductive yarns were not capable of responding against each minor damage. Consequently, self-diagnostic properties are enhanced using a denser inlay pattern and a higher number of stimuli layers. Electrical resistance behaviors w. r. t inlay yarn patterns.
Conclusion
Self-diagnostic properties induced into knitted reinforced composites during reinforcement’s knitting is worthwhile to predict any minor or major change/damage in the physical state of composites during practical applications. Rib knitted inlaid structures having conductive inlay yarns assist in inducing the self-diagnostic properties in composites. Straight passing inlaid yarns electrical resistance could be measured using real-time monitoring device connected to inlaid yarns externally. Electric current requires a proper path for flowing through materials, and any flaw in the current’s path causes the rise of electrical resistance of that material. This way, electrical properties could be related to induced mechanical damages into composites. Knitted self-diagnostic composite continuously reveals its electrical resistance via real-time structural health monitoring. Any induced mechanical damage or flaw, the path of flowing current is interrupted, and electrical resistance increases. Increased electrical resistance indicates that the composite has faced any mechanical damage that may affect its performance; hence, there is a need for proper inspection or replacement of the material. Electrical resistance of the used knitted reinforced self-diagnostic composite could be pre-determined via standard laboratory testing methods in an easy, low cost and effective way. Such critical values could be provided in the specs sheet of material being used specific application. And the material could be replaced when that value of electrical resistance is experienced during practical use. Such measures can prevent severe accidents that the system could face without self-diagnostic functions due to the non-conductive nature of conventionally used composite materials in hi tech applications where safety of working equipment and human is the first most priority. Knitted reinforced composites having self-diagnostic function could serve as an ideal material for structural health monitoring of critical systems. The research presents an uncomplicated model of knitted reinforced composites with self-diagnostic properties. In a nutshell, the study opens a pathway for inducing self-diagnostic properties in knitted reinforced composites that may have much more destinations in the future to work.
Footnotes
Declaration of conflicting interests
The author(s) declared no potential conflicts of interest with respect to the research, authorship, and/or publication of this article.
Funding
The author(s) received no financial support for the research, authorship, and/or publication of this article.