
Abstract
This paper focuses on tight-fitting sportswear as the research subject and investigates the dynamic influence of comfort perception on overall comfort. By developing a comprehensive evaluation system that encompasses both subjective and objective measures of comfort, this study systematically reveals the interactive mechanisms and dynamic characteristics of multi-dimensional comfort perceptions, including heat and humidity comfort, compression comfort, touch comfort, among others. The findings indicate that (1) local comfort levels fluctuate over time, with varying weights influencing overall comfort; (2) during 6 km/h exercise, key local discomfort sensations impacting overall comfort include restraint feelings of shank, stuffy feeling (cool feeling) of shank, restraint feeling of thigh, etc.; (3) there are significant correlations between stuffy feeling with sticky body feeling and humidity feeling respectively; additionally, notable correlations exist between sticky body feeling with humidity feeling and rough feeling. This study offers provides a more scientific basis for optimizing tight-fitting sportswear design.
Introduction
With the rapid development of society and economy and the significant improvement of people’s living standards, sports have gradually become an indispensable part of people’s daily lives. Whether to enhance physical fitness, improve sports performance, or as a healthy lifestyle, the importance of sports is increasingly evident. In this context, the research and design of sports equipment has become a research hotspot in both academia and industry, especially functional clothing represented by compression sportswear. Compression sportswear is highly valued for its excellent functional characteristics. This type of clothing can not only improve muscle support and reduce sports fatigue by providing a reasonable pressure distribution, but also optimize sports performance to some extent. However, while achieving functional goals, the high degree of adhesion to the skin and the design that exerts pressure on the body often have a significant impact on the wearer’s comfort perception. Research shows that comfort perception is one of the most important determinants of the wearer’s experience, directly affecting the wearer’s psychological feelings, sports performance, and recovery efficiency after long-term exercise.
Comfort perception is a highly complex and multidimensional concept that involves the interplay of physiological, psychological, and environmental factors. Its specific manifestations include thermal-humid comfort, such as discomfort from stuffy feeling, moisture feeling, and sticky body feeling; pressure comfort, such as discomfort from restraint feeling; and tactile comfort, such as soft feeling and rough feeling. Although these comfort perception dimensions may exist independently in different conditions, they often exhibit strong interactions in actual sports activities. For example, the increase in sweat secretion during high-intensity exercise may exacerbate thermal-humid discomfort and induce sticky body feeling, thereby indirectly affecting pressure comfort and psychological feelings. Therefore, it is of great significance to study the intrinsic relationships between comfort perception and its dynamic role in overall comfort.
Aiming at the comfort of tight sportswear, academic and industry research has achieved some phased results, mainly focusing on the following aspects.
Exploration of comfort evaluation method
Factor analysis and fuzzy evaluation: By extracting multi-dimensional comfort indicators, a mathematical model is constructed to quantify the contribution of each factor to comfort. This method has advantages in analyzing complex data, but it is difficult to integrate subjective knowledge and experience because it depends on experimental data.1 –3
Correlation analysis: The statistical method is used to reveal the relationship between comfort perception and comprehensive comfort, although it can reflect certain influence rules, but it is still inadequate for complex nonlinear interaction. 4
Analytic Hierarchy Process (AHP): Evaluate the importance of different factors by introducing expert experience and subjective weight. 5
Study on the comfort problem
In view of the complexity and multi-dimensional nature of the research on the comfort of tight-fitting sportswear, academia and industry have carried out a lot of explorations in the aspects of thermal and wet comfort, compression comfort, and tactile comfort. These studies provide important theoretical basis and technical guidance for improving the comprehensive comfort of tight-fitting sportswear, mainly in the following areas:
Study on thermal and humidity comfort
Thermal and wet comfort is one of the core dimensions that determine the overall comfort of clothing, especially under the condition that tight sportswear is highly fitted to the skin, its influence is more significant. The research focuses on the following aspects:
The permeability and hygroscopicity of the fabric
The research shows that the fabric with poor air permeability will lead to the increase of local body temperature during exercise, which will lead to sultry feeling; However, materials with insufficient hygroscopicity can’t sweat quickly, which aggravates the sticky feeling. Jeon et al. 6 studied the hygroscopicity and perceptual behavior of high-performance shirt fabrics by psychophysical methods, and found that high-performance polyester fibers have the best moisture conductivity under the condition of a lot of sweating, which is helpful to relieve the sticky sensation during wearing. Sarika and Shakya 7 analyzed the air permeability and hygroscopicity of cotton fabrics after chemical treatment, and pointed out that the enhancement of hygroscopicity can effectively reduce the wet and hot feeling during exercise. Rouhani and Fashandi 8 studied a double-layer fabric system, in which hydrophobic fibers were used in the inner layer and hydrophilic fibers were used in the outer layer, which greatly improved the air permeability and moisture absorption of the fabric; Xu et al. 9 designed a double-layer coaxial fiber fabric, which combined with solar heating technology can quickly evaporate sweat and significantly improve the wearing comfort.
Local heat and moisture distribution law
There are significant differences in sweat secretion and heat production in different parts of the human body under different exercise conditions. For example, the armpit, back and chest area are usually the high incidence areas of sweat accumulation. By introducing air holes in these areas or using differentiated fabric design (such as high air permeability fabric splicing), local thermal and wet comfort can be effectively improved. McDonald et al. 10 established the heat and moisture transfer model of single-layer fabric system. The experimental results show that the porosity and surface characteristics of fabric are the key factors to optimize local heat and moisture management. Fu et al. 11 put forward a double-layer fabric design, which realizes the rapid transfer and heat dissipation of local moisture through the combination of hydrophobic and hydrophilic fibers, and improves the local comfort of high humidity areas such as underarms and back; Soundri et al. 12 Through the test of double-layer fabrics with different fiber materials and compactness, it is found that polyester-modal blended materials are excellent in humidity management and thermal conductivity, especially suitable for improving the comfort of sweat accumulation areas during exercise; Wang et al. 13 analyzed the heat and moisture transfer characteristics of fabric structure by three-dimensional finite element simulation. The results show that the weaving mode and porosity of fabric have significant influence on the heat and moisture transfer performance. It is pointed out that the use of high permeability fabric splicing in high humidity areas can effectively improve the local thermal and humidity comfort.
Thermal and humidity comfort under dynamic conditions
Experiments show that exercise intensity and environmental conditions have an important influence on thermal and wet comfort. For example, under high humidity or high temperature conditions, tight-fitting sportswear is easy to increase the sultry feeling due to poor perspiration. This urges scholars to adopt environmental simulation cabin or real-time monitoring technology to study the law of heat and humidity change under dynamic motion situation. Yang et al. 14 Through the dynamic humidity experiment of different fiber materials with textile microclimate measuring instrument, the influence of ambient temperature on fabric humidity comfort was studied, and a prediction method based on gray mathematical model was proposed. Raccuglia et al. 15 discusses the influence of fabric thickness, fiber type and surface texture on humidity perception and tactile comfort under static and dynamic conditions, and puts forward a prediction model of dynamic comfort; Ongwuttiwat et al. 16 revised the PMV formula to include the moisture permeability of fabrics in the thermal comfort evaluation, revealing the importance of moisture permeability to comfort in dynamic environment; Vellei and Le Dréau 17 combined the dynamic physiological model and the comfort perception model to analyze the changes of dynamic thermal comfort under transient conditions, and proposed a prediction tool with low computational cost; Wei et al. 18 evaluates the comfort of sportswear by analyzing the physiological parameters (such as body temperature and heart rate) and subjective comfort (such as heat and humidity) of participants. It is found that skin temperature and humidity are the key factors affecting the comfort of wearing during exercise, while physiological reactions (such as heart rate and body temperature) do not always have the same influence on the perceived comfort.
Research on the comfort of compression
The compressive design of tight-fitting sportswear supports muscle groups and blood circulation by exerting moderate pressure, thus enhancing sports performance. However, excessive or uneven compression may lead to bondage and fatigue, which will affect the overall experience of the wearer. The research mainly focuses on the optimization of pressure distribution, the relationship between pressure and exercise physiological response, and the improvement of elastic materials. The design and application of tight sportswear are deeply analyzed, which provides theoretical and experimental basis. For example, Struhár et al. 19 pointed out that moderate pressure compression clothing has a positive effect on muscle soreness and recovery performance after exercise; Yan et al. 20 used surface electromyography (sEMG) to monitor the effect of tight shorts on exercise fatigue under different compression intensities, and found that moderate compression can reduce muscle vibration and delay fatigue, but excessive compression can lead to discomfort; Halász et al. 21 analyzed the influence of tight-fitting sportswear on athletes’ physical comfort, and found that high compression clothing would significantly increase sweat intensity and skin temperature, which would have an impact on physical comfort; Abbas et al. 22 discussed the influence of fiber types and the number of covering yarns on compressibility, air permeability and thermal resistance, and provided reference for designing sports socks with both compressibility and comfort.
Study on tactile comfort
Tactile comfort is mainly determined by the perception experience when the fabric is in contact with the skin, including softness, friction coefficient, and skin sensitivity, etc. The research focuses on the surface friction performance and softness. For example, Troynikov et al. 23 discusses the influence of fabric elasticity and surface characteristics of sports compression clothing on comfort and friction behavior, and finds that elastic fabric has higher tactile comfort under wet conditions; Thieulin et al. 24 discussed the damage of repeated friction to the stratum corneum, and found that soft fabric can reduce irritation and skin damage, emphasizing the importance of fabric softness to skin comfort; Tang et al. 25 designed an instrument to measure the viscosity of textiles on wet skin surface, and analyzed the influence of humidity and friction on comfort. It was found that wet conditions significantly increased the friction coefficient and discomfort. Tang et al. 26 studied the influence of humidity level on the stickiness and skin comfort of textiles, and put forward the cumulative index of stickiness feeling to quantify the wearing comfort of fabrics.
Interactive research on multidimensional comfort perception
Although the existing research mostly focuses on a single comfort dimension, in fact, there is a significant interaction between the dimensions. For example, the discomfort of heat and humidity may aggravate the sense of bondage and psychological discomfort; Excessive compressive design may lead to the local temperature increase of the skin, thus affecting the thermal and wet comfort. In recent years, some studies began to try to analyze the comprehensive comfort from the perspective of multi-dimensional interaction. For example, Kaynakli and Kilic 27 established a thermal interaction model between human body and environment, and analyzed the influence of clothing resistance and air velocity on local and overall comfort under dynamic conditions; Voelker et al. 28 used UC Berkeley comfort model to further study the influence of clothing on thermal and moisture comfort, focusing on the heat capacity and humidity retention capacity of clothing, especially the transient effect in dynamic environment; Fu et al. 29 built a multi-stage heat and moisture transfer model, analyzed the influence of moisture absorption and evaporation heat dissipation of clothes on human thermal comfort, and revealed the key roles of air velocity and temperature on comfort in dynamic environment.
Although the above research provides important theoretical support and technical reference for the design optimization of tight-fitting sportswear, there are still some obvious limitations and shortcomings, which restrict the further development of this field. At present, most of the research focuses on static analysis and tests based on laboratory conditions, ignoring the dynamic characteristics of comfort perception during exercise. Under the state of exercise, the physiological and psychological responses of human body are constantly changing, which leads to the obvious time series characteristics of comfort perception. However, the existing research lacks systematic analysis of this dynamic law and cannot effectively capture the dynamic experience of the wearer at different stages of exercise. In addition, most of the existing studies focus on the independent analysis of a single comfort dimension, failing to fully consider the complex interaction between different dimensions, and it is difficult to provide clear and regular guidance for the interaction mechanism between different comfort perception dimensions and their overall effect on comprehensive comfort. For example, the perception of heat and humidity comfort may directly affect the perception of oppression comfort, and there is also a potential correlation mechanism between tactile comfort and psychological comfort. The interaction of these multi-dimensional factors has not been quantified and comprehensively analyzed in the existing research.
Another outstanding deficiency is that the standardization of the evaluation system is low. At present, a scientific and unified quantitative evaluation system has not been formed, and the results of different research methods are not comparable, which limits the popularization and application of research results. At the same time, the lack of integration of subjective evaluation and objective testing in comfort research is particularly prominent. The existing methods often focus on a single subjective questionnaire survey or rely on physical performance measurement, but fail to effectively combine the subjective perception and physiological data of the wearer, resulting in insufficient comprehensiveness and accuracy of evaluation.
Therefore, this paper takes tight-fitting sportswear as the research object, focusing on the dynamic influence of comfort perception on comprehensive comfort. By establishing a subjective and objective evaluation system and revealing the interactive mechanism of multi-dimensional comfort perception, it aims to fill the knowledge gap in current research, which can not only provide new theoretical support for academic circles, but also provide more scientific and accurate guidance for the design and optimization of sportswear.
Methods
Subjects
According to the research of George and Heus 30 and Goldman 31 , in the design of subjective experiment scheme, in order to obtain experimental results with sufficient sensitivity, the number of subjects should reach at least eight. Some scholars have found that body size differences (such as chest, buttocks, BMI and other body parameters) will affect the comfort or thermal and wet comfort of human body when wearing clothes,32,33 in order to reduce the influence of body shape difference on the comfort of tight-fitting sportswear, this paper will select subjects with similar body shape. At the same time, some scholars have shown that the differences of comfort sensitivity (mainly temperature, humidity and pressure sensitivity) have great influence on subjective comfort evaluation. 34 In order to reduce the influence on the comfort research of tight-fitting sportswear due to the difference of individual body shape and sensitivity to heat, humidity and pressure, a series of measures were taken to screen the subjects.
(1) Screening of body types of subjects. In this paper, subjects with similar body types were selected by body type clustering. Based on the existing research on human body shape,35,36 this paper summarizes the key parts that affect human body shape clustering (i.e. these parts will be used as parameter indicators for human body shape clustering in the future), mainly including height, shoulder width, thigh circumference, chest circumference, straight crotch length, back length, hip protrusion, hip kyphosis, and crotch height. In this paper, the data of the above-mentioned human height, girth, thickness, width, length, convexity, human angle, etc. (the measured environmental temperature is (20 ± 2)℃ and the relative humidity is (60 ± 5)%) are measured by Vitus Smart non-contact three-dimensional human body scanner (see Figure 1) and Martin’s human body shape measuring ruler, and then these measured data are K-means.

Non-contact three-dimensional human body scanner.
In this experiment, 30 male subjects were initially recruited. Among them, undergraduate or graduate students majoring in clothing who have rich relevant subjective evaluation experience and professional knowledge are all sports enthusiasts. All the subjects are healthy physically and psychologically, especially without skin history. Taking the above-mentioned key position size data as the clustering index, 30 male subjects were clustered by K-means, and the clustering results were divided into three categories: 18 in the first category, seven in the second category and five in the third category. Because the number of subjects is required to be at least eight, the first category of subjects is selected as the screening object. In order to ensure that the subjects have the same or similar sensitivity to temperature, humidity and pressure (restraint) as much as possible, the following measures are finally taken for screening.
(2) Screening subjects according to their sensitivity. Through a series of means, the sensitivity of temperature, humidity and pressure of 18 subjects was tested as the final screening of subjects. Finally, 10 subjects were selected from 18 subjects.
Experimental samples
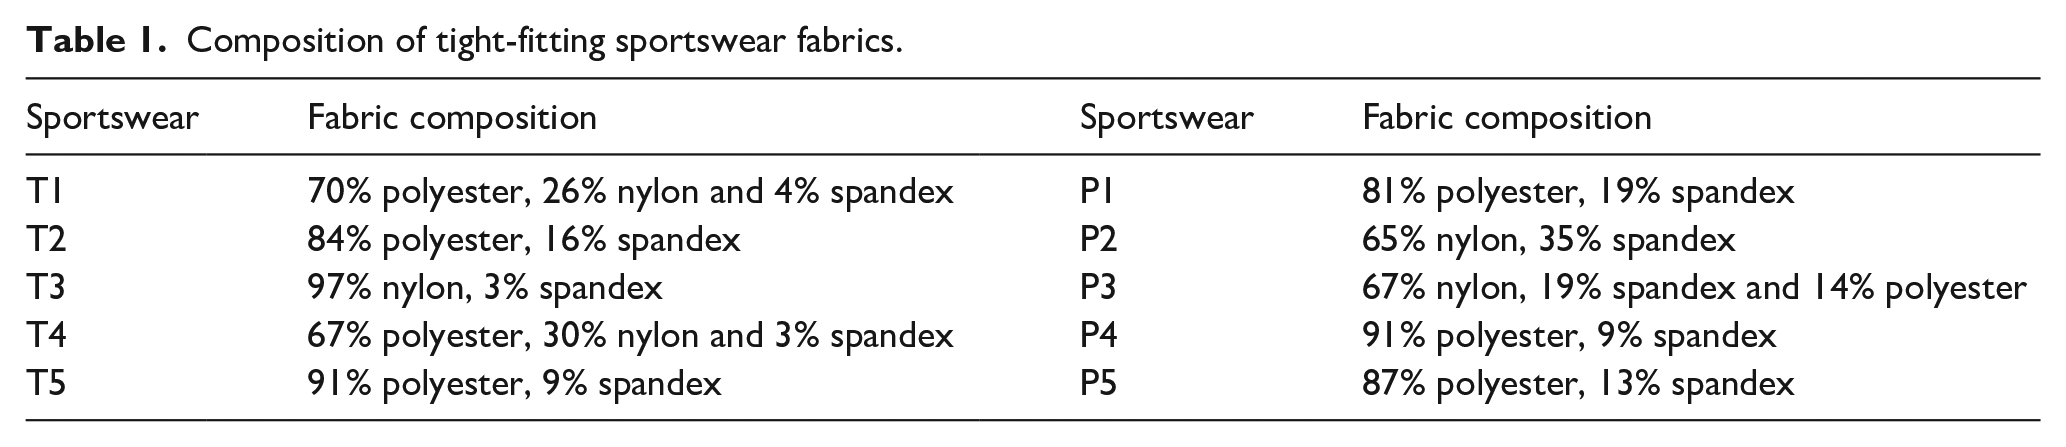
According to international standards such as ISO 5971-2017, 37 ISO 8559-2-2017, 38 and GB/T 6411-2008. 39 In this paper, we bought five tight-fitting tops (with the same or similar styles) (marked as T1, T2,. . ., T5) (with a bust of 76.8 cm, a rotator cuff of 71 cm and a length of 67 cm) and five tight-fitting pants (with the same or similar styles) (marked as P1, P2,. . ., P5) (with a waist circumference of 69.8 cm). 10 subjects were invited to try on the clothes separately, and stood, lifted their legs and swung their arms back and forth at the same time. After the try-on, 10 subjects said that all the tight-fitting tops and tights-fitting pants together during the try-on. Therefore, the tight-fitting tops and tights-fitting pants purchased this time can be used as experimental clothes for this study (Table 1).
Composition of tight-fitting sportswear fabrics.
Selecting the speed of 6 km/h
This speed could ensure reliable data collection, and stable body posture for accurate comfort evaluation, it is ideal for both fitness clothing design and laboratory experiments.
Choosing 6 km/h as the experimental speed is based on the following three considerations:
First of all, universality: 6 km per hour is a jogging speed often used by many runners, which widely represents the comfort needs in daily running and covers runners with different physical fitness levels. For this kind of people, it is of high application value to study the clothing comfort at this speed.
Secondly, it is scientific: this speed can produce moderate physiological load, such as the increase of heart rate and perspiration, but it is not too intense, which is helpful to collect and analyze data stably under laboratory conditions and ensure the reliability of the results.
Finally, applicability: the research results not only directly serve the clothing design of fitness and daily exercisers, but also provide reference for the comfort design of other sports speeds and similar sports conditions. In addition, the posture of human body is stable at this speed, which is beneficial to accurately evaluate the influence of clothing on comfort and avoid the interference caused by posture change.
Choosing 6 km/h balances the scientific nature of data acquisition and the operability of experiments. The information about have also been proved by some references.40,41
Evaluation scale
Combined with Likert scale, a comfort evaluation scale (5-level scale) is designed for the evaluation of part comfort and overall comfort, as shown in Table 2.
Evaluation of comfort perception and overall comfort.

In order to analyze the correlation between local comfort and overall comfort, this paper defines some comfort expression phrases, such as overall comfort (also known as overall comfort), overall comfort, local comfort, and local comfort perception. Overall comfort evaluation is based on human body (individual), while local comfort evaluation is based on a certain part of human body. Then, overall comfort means the overall comfort state of the human body, and the overall comfort is evaluated and scored according to very comfortable, relatively comfortable, generally comfortable, less comfortable and very uncomfortable; The overall sense of comfort means the overall feeling of sultry, sticky, moist, itchy, restrained/oppressive, rough/smooth and soft, that is, the overall evaluation of the feeling of sultry and sticky. Local comfort refers to the comfortable state of some parts, and local comfort is also evaluated and scored according to very comfortable, more comfortable, general comfortable, less comfortable, and very uncomfortable, such as back comfort, which means that the comfortable state of the back is very comfortable, more comfortable or less comfortable, etc. Local comfort perception refers to the stuffy feeling, sticky body feeling, moisture feeling, itchy feeling, constraint/oppression feeling, rough feeling/smoothness feeling and soft feeling of some parts, and evaluates the sultry feeling, sticky feeling, moist feeling, itchy feeling, constraint/oppression feeling, rough feeling/smoothness feeling and softness feeling of some parts of the human body as a unit, such as the sultry feeling of the back and the chest.
Integration of the embedded sensor system into a garment
According to the design in Section 2.3, the garment prototype of the acquisition system has developed (Figure 2). The schematic diagram of the garment integrating the embedded sensor system is shown in Figure 3. In this prototype, the involved sensors are fixed on human body part by medical tape (PE material, breathable), Arduino Nano 33BLE is sewn on garment. The acquisition system realizes wireless transmission and wireless reception of data.

Embedded sensor system schematic diagram.

Sensors installation schematic diagram.
Selection of pressure, temperature, and humidity data acquisition parts
Pressure sensors and temperature and humidity sensors are placed in seven parts, such as Back, Waist, Chest, Abdomen, Hip, Thigh, and Shank, which are designated as B1, B2, B3, B4, B5, B6, B7, Respectfully. The positions where the experimental data were collected are shown in Figure 4. The evaluation of local comfort and local comfort is also the evaluation of these parts.
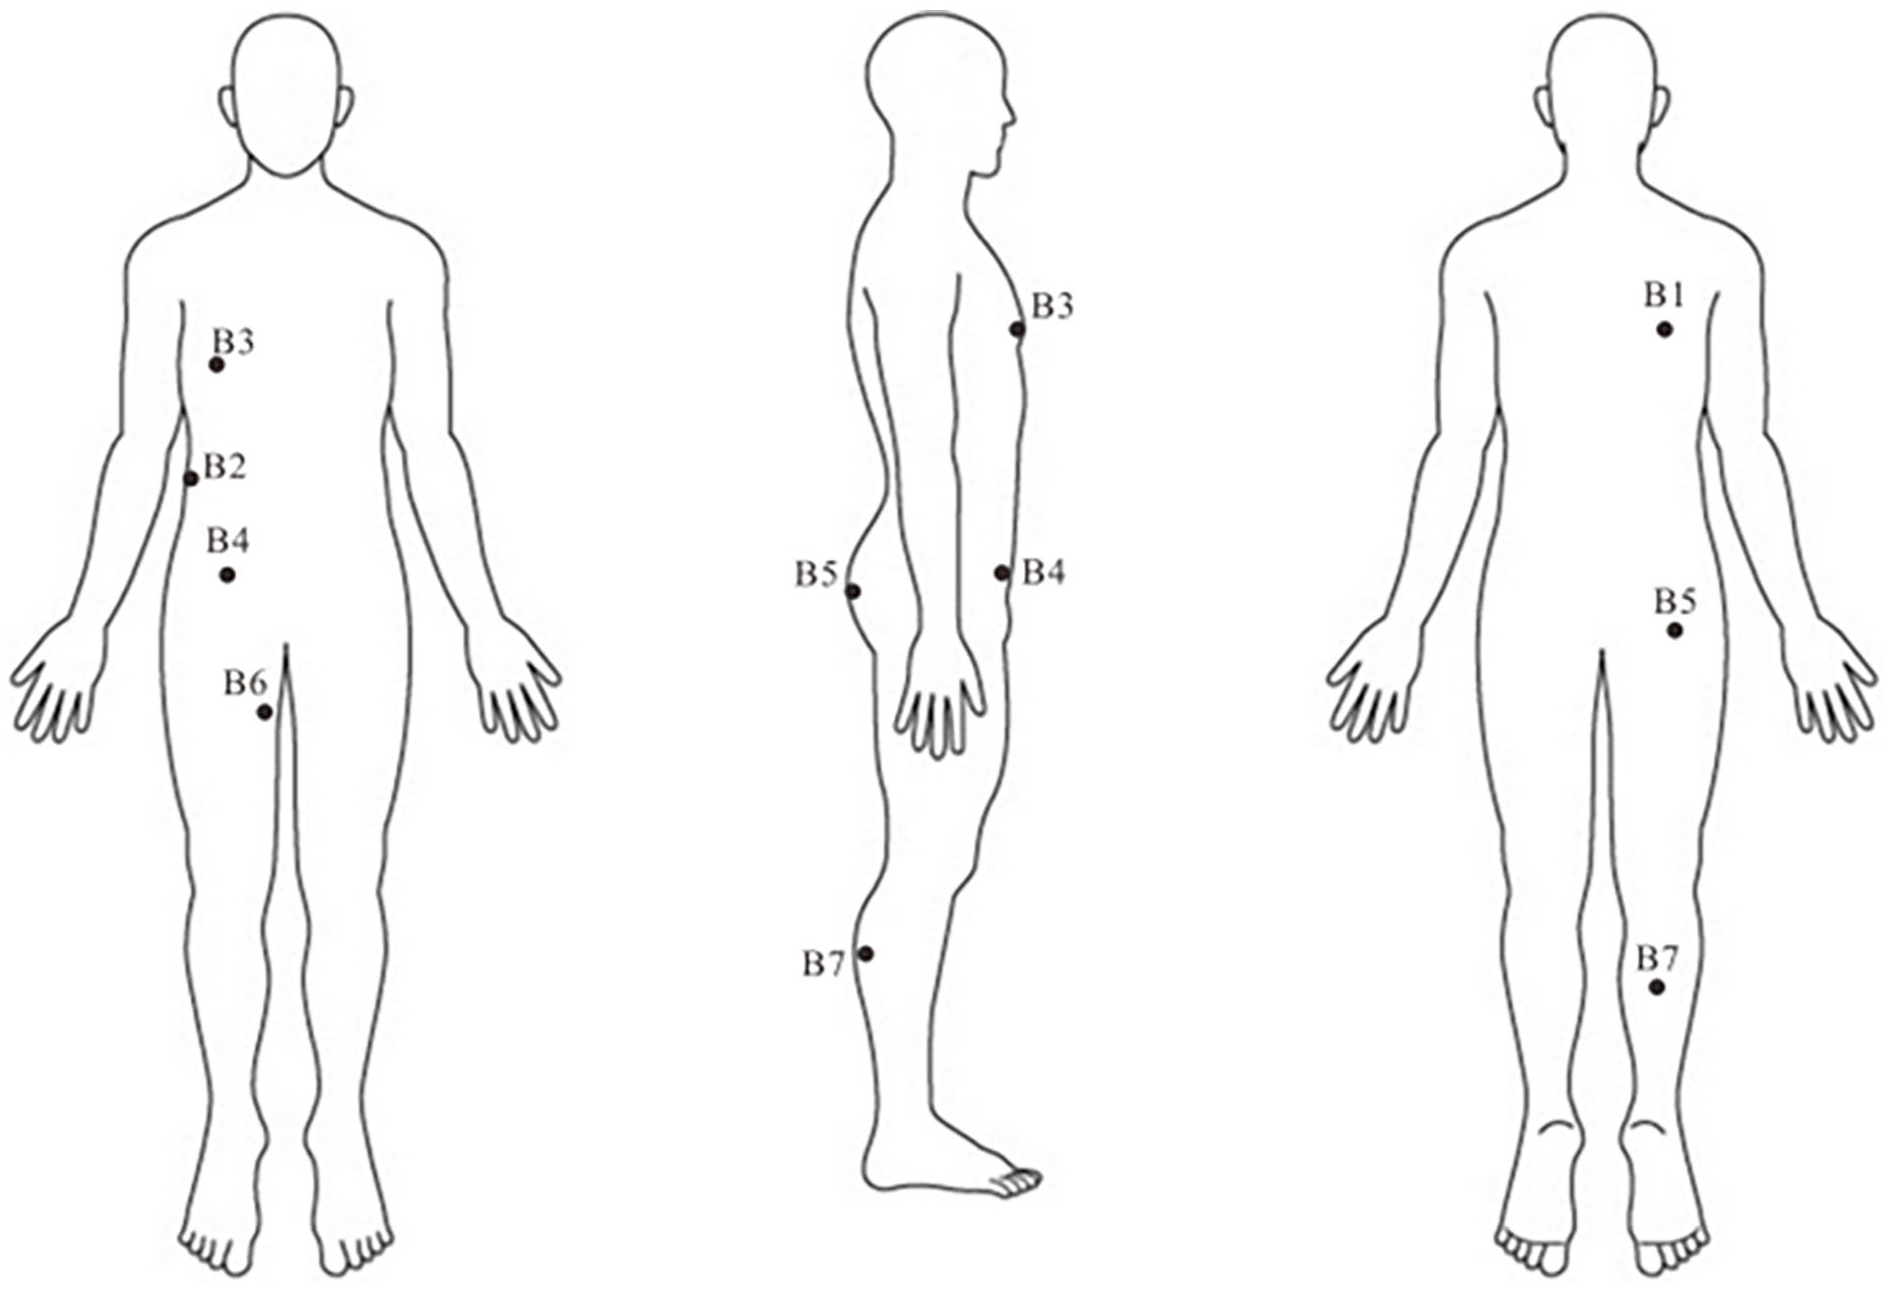
Schematic diagram of measuring position.
Sports scheme design
Preparation before the experiment
The ambient temperature is (20 ± 2)℃, the relative humidity is (60 ± 5)%, and the average wind speed is less than 0.1 m/s; Conduct pre-test training for all subjects on their comfort cognition, so that they can correctly understand the meaning of subjective comfort such as sultry feeling and humid feeling; Training the subjects in running posture; Subjects were randomly selected and tried on in turn without being told about the fabric of tights. Subjects entered the climate room 20 min in advance to adapt to the indoor environment; Within 24 h before the start of the experiment, the subjects were asked to ban drinking and strenuous exercise; Do not drink tea or coffee on the day of the experiment. In the 2 h before the start of the experiment, the subjects did not eat; In order to avoid being influenced by biological laws, all experiments were carried out at the same time on the same day; During the whole experiment, subjects were not allowed to talk to each other. All the subjects wore boxers made of uniform materials prepared by the experimental group.
Experimental process
Each subject wore all the experimental tight-fitting sportswear in turn and ran for 50 min at a speed of 6 km/h on the running machine (refer to app running software such as Keep, Gudong and Yuedong to count the average running time). The exercise experiment scheme is shown in Figure 5. Subjectively evaluate the comfort perception of the set parts every 10 min, and each set of tight-fitting sportswear shares a subjective evaluation questionnaire (i.e. the subjective evaluation questionnaire of each set of tight-fitting sportswear contains 10 subjects’ comfort perception scores, which is also for the convenience of subsequent consistency check), and the staff records the subjective comfort evaluation values of the testers in each link. Subjects go to the laboratory at 8:00 every day and complete the same baseline physiological indicators (heart rate variability, skin temperature). Basically, the wearing experiments of 10 subjects are completed every day, and it takes about 52 days to complete all the wearing experiments. There is a recovery period of at least 24 h between each test day, during which the subjects keep daily activities but avoid strenuous exercise.

Motion scheme.
After summarizing the experimental scheme design of related research on human body temperature, humidity and comfort perception, 42 the experiment is divided into three stages: Step 1: warm-up (10 min); Step2: running(50 min); Step 3: relax (10 min), that is, the rest stage after the exercise. Among them, the running stage is divided into five stages: the 10th min–20th min stage is marked as Step 2-1; The 20th–30th min movement stage is marked as Step2-2; The movement stage from 30th min to 40th min is marked as Step 2-3; The movement stage from 40th min to 50th min is marked as Step 2-4; The movement stage from 50th min to 60th min is marked as Step2-5.
Weight calculation of subjective comfort
There may be a nonlinear relationship between comfort perception. In order to optimize the comfort of tights, it is particularly important to understand the body parts that affect the overall comfort and their comfort. However, because there are some differences in the comfort of tights in each stage of exercise, in order to better understand the perception of local comfort of human body that affects the overall comfort in each stage of exercise and realize the objective quantification of local comfort of human body in the exercise state, this paper selects AHP-Entropy weight evaluation method, which has certain advantages in evaluating fuzzy nonlinear problems.
Human comfort is the synthesis of local human comfort. There are some differences in the local comfort of human body during exercise. By improving the local comfort of human body, the overall comfort can be improved. Based on the subjective evaluation value, analyzing the change of comfort perception of each part and its influence on the overall comfort will make the factors affecting sports comfort more specific and targeted. Because there are many parts and comfort perceptions involved, the analysis work is heavy. In order to simplify the analysis process, it is divided into two steps: first, analyze the main overall comfort perceptions that affect the overall comfort; Secondly, analyze the local comfort perception that affects the overall comfort perception. That is, the comfort perception that affects each stage and the main comfort perception of different parts are analyzed respectively, and then the comfort perception and key parts that affect the overall comfort are determined. The structural frame is: overall comfort-overall comfort perception-local comfort perception. And the subjective score value for one exercise phase in one comfort dimension and one body part is the mean value of all test subjects estimations with all sets of tights in respect to the phase, dimension and body part.


Among them, OC stands for overall comfort; OS stands for overall comfort sense; PS stands for local comfort perception(human body part comfort perception); sf stands for stuffy feeling; sbf stands for sticky body feeling; hf stands for humidity feeling; if stands for itching feeling; rf stands for restraint feeling; rof stands for rough feeling; sof stands for soft feeling; B stands for back; A stands for abdomen; C stands for chest; W stands for waist; H stands for hip; S stands for shank; T stands for thigh; OS-sf indicates the overall sultry feeling; sf-B indicates stuffy feeling of back; sf-W stands for stuffy feeling of waist, etc.
Principle of AHP-Entropy weight evaluation model
Analytic Hierarchy Process (AHP) is the most widely used and studied comprehensive evaluation method at present. As a mathematical method combining qualitative and quantitative analysis of things, it calculates the importance matrix of indicators at all levels through evaluation, so as to obtain the importance sequence of things, that is, the weight sequence. 43 The use of weights to reflect the importance of each factor, although the weights are determined by experience (often subjective), can reflect the actual situation to a certain extent, and the evaluation results are more in line with reality. When the qualitative method is used to construct the evaluation matrix, there is a risk of subjective interference, which leads to the loss of decision information and makes the judgment result biased toward subjectivity. Therefore, the entropy weight method is a method to reflect the effective information content of things by using information entropy, so as to obtain its weight, that is, to determine the weight objectively by calculating the information entropy in the index, 44 which belongs to the objective discrimination method. Although the entropy weight method has a solid mathematical theory support in the discriminant analysis of things, it ignores the influence of subjective factors on the analysis process and relies too much on objective data, making its evaluation results vulnerable to data fluctuations and prone to over-objective evaluation results. Therefore, the combination of AHP and Entropy weight method can not only effectively draw on expert experience and professional knowledge, but also make full use of the objective information of the data to avoid too subjective or objective evaluation. 45
The basic idea of AHP-Entropy weight evaluation method is as follows:
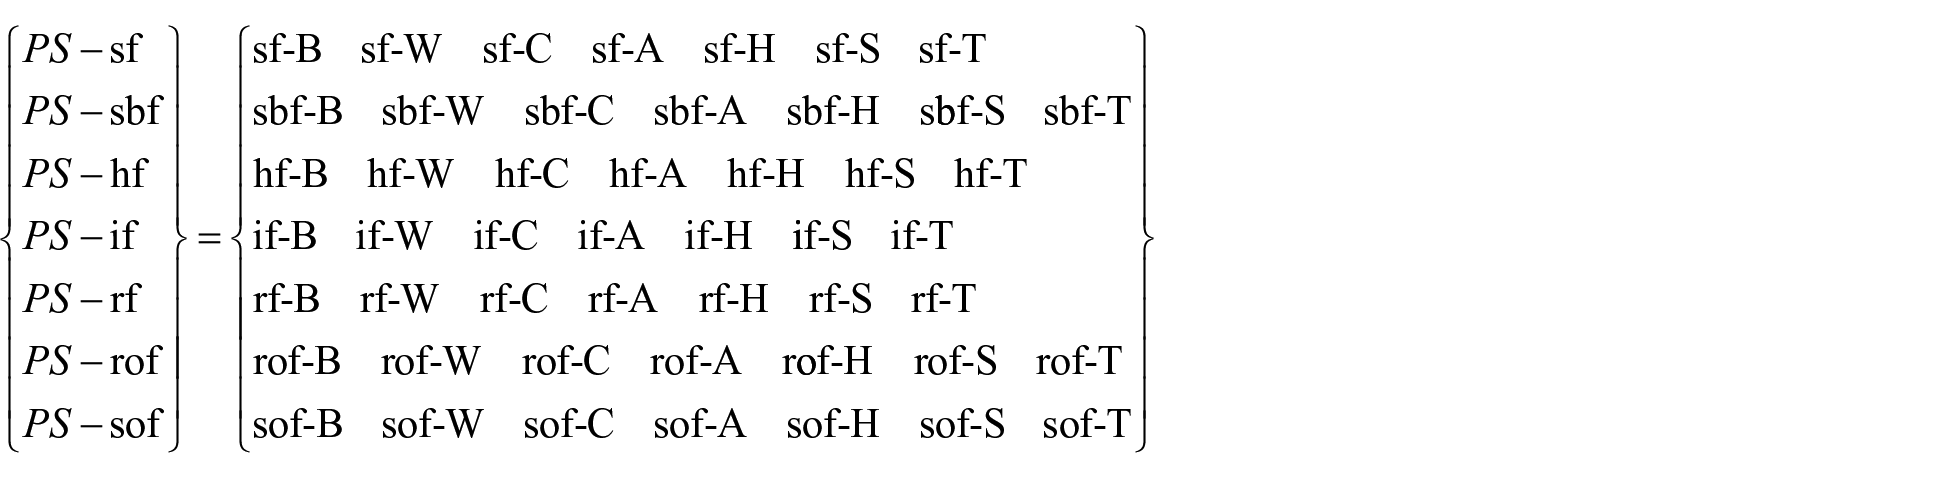
① Determine the evaluation index hierarchy of the evaluation object. The evaluation subject OC is divided into m evaluation dimensions (i.e. overall comfort perception), namely OC = {OS1, OS2,. . ., OSm}, and the secondary evaluation index is obtained under different dimensions OSm = {(sf-B, sf-W, sf-C, sf-A, sf-H, sf-S, sf-T), (sbf-B, sbf-W, sbf-C, sbf-A, sbf-H, sbf-S, sbf-T),. . ., (sof-B, sof-W, sof-C, sof-A, sof-H, sof-S, sof-T)}, where m stands for comfort perception in a specific evaluation dimension, that is, 1 m stands for stuffy feeling, sticky body feeling, humidity feeling, itchy feeling, restrain feeling, rough feeling feeling, and soft feeling respectively. The hierarchical framework of evaluation indicators is shown in Figure 6, Tables 3 and 4.
(2) constructing the judgment matrix J.

Evaluation index system.
Weight distribution of tight clothing evaluation index system (a).
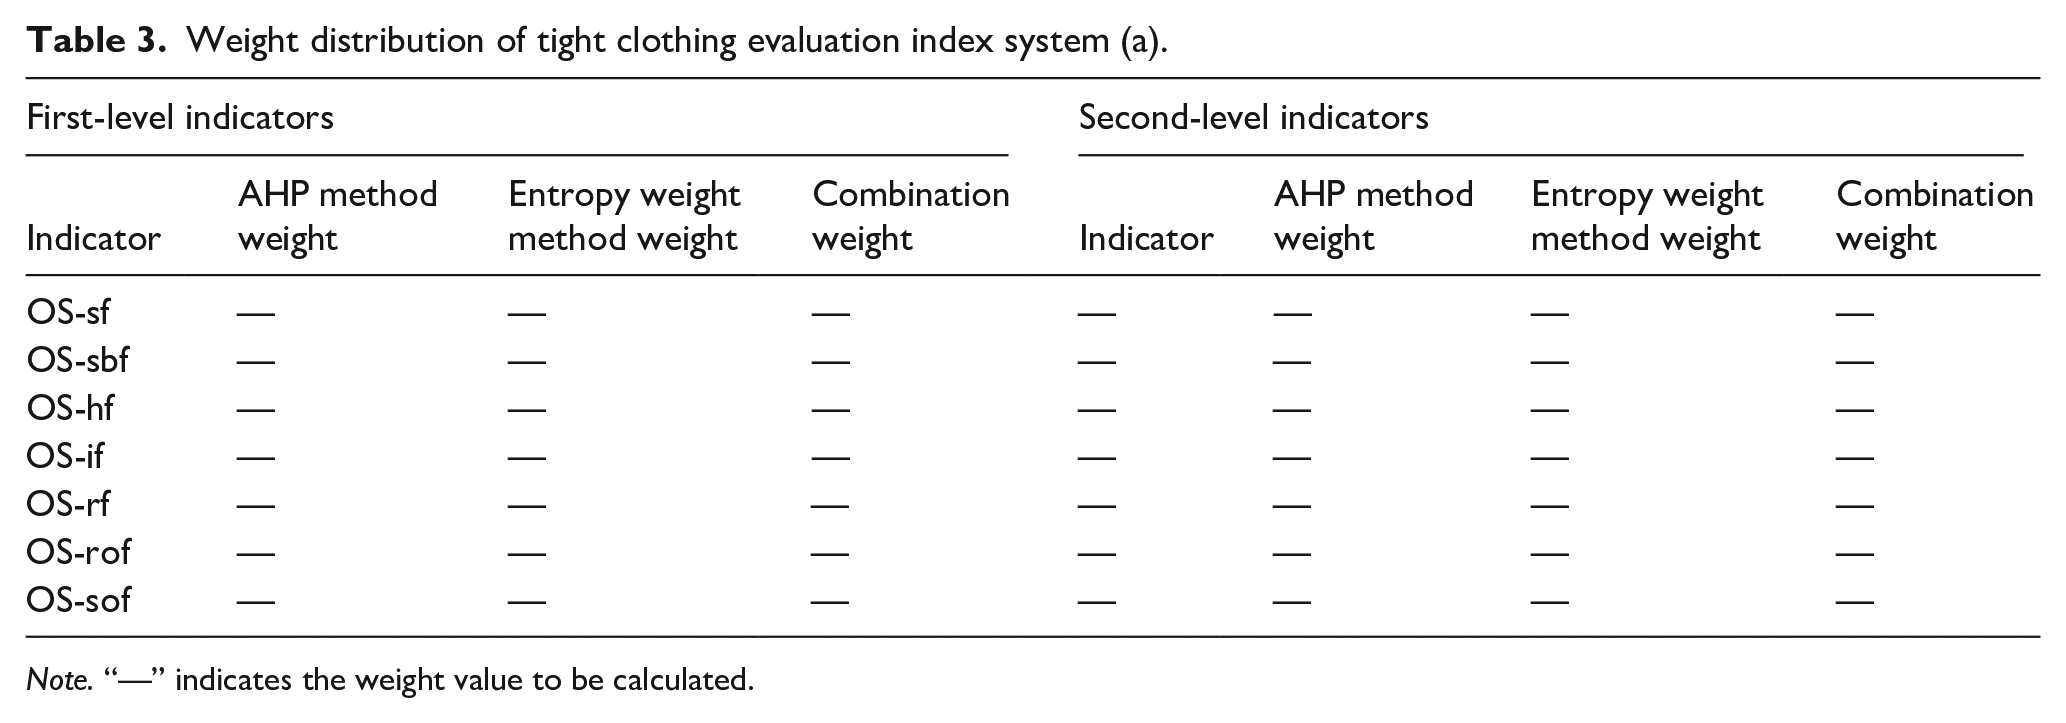
Note. “—” indicates the weight value to be calculated.
Weight distribution of tight clothing evaluation index system (b).

Note. “—” Indicates the weight value to be calculated.
In this study, three associate professors, four lecturers, two doctors, and two subjects were invited to form an expert team (all the members of the expert team were from the clothing industry for more than 3 years, and they had quite rich clothing professional knowledge, and all the members had more than 2 years of running experience). According to the subjective comfort scores (including overall comfort score, overall comfort perception score, local comfort score and local comfort perception score) of the subjects in the wearing experiment, and according to the index importance scoring criteria in Table 5, the expert team compares the importance of each layer of comfort in each movement stage of the wearing experiment and scores it. Then, the opinions of all experts are averaged, and the judgment matrix J is obtained by comparing the n indicators in pairs: J = (aij)n × m, where, aij > 0, aij = 1/aji, i = 1, 2,. . ., m; j = 1, 2,. . ., n.
③ According to the definition of Entropy, determine the entropy value and entropy weight of the evaluation index, as shown in Formula (1)-Formula (4).


where, Hi means the i-th index entropy;
Setting the standard group of values.

④ Determine the comprehensive weight. According to the subjective weight obtained by AHP and the objective weight obtained by entropy weight, the comprehensive weight is obtained by linear weighting method, which takes both subjectivity and objectivity into account, as shown in Formula (5).

where,
After calculation, the perceived weight matrix that affects the overall comfort is obtained respectively, as shown in Formula (6).

where, wspeed represents the weight at different moving speeds; wstep1sf represents the weight of sultry feeling in Step1; wstep2-1sbf indicates the weight of the viscous sensation in Step2-1; wstep3hf indicates the weight of humidity in Step3.
Results and discussion
Overall comfort and overall comfort perception
The change of weight represents the influence degree of some overall comfort perception on overall comfort, which means that the overall comfort has a great influence on overall comfort, and it can also mean that the change law of some overall comfort perception is similar or consistent with that of overall comfort. According to the weight calculation of AHP-Entropy weight evaluation model, the weight of the overall comfort that affects the overall comfort in Step1 is as follows.
Step1:
At warm-up step (step 1), the main overall comfort perceptions that affect the overall comfort are stuffy feeling, rough feeling, restrain feeling and soft feeling, while the sticky body feeling and itchy feeling are not obvious, and the evaluation is similar. At this time, the stuffy feeling is mainly cool feeling, because people are at rest, and the temperature of the human body can only be supplied by the body’s own functions. In addition, the stuffy feeling, rough feeling, etc. mentioned here are all overall perceptions, that is, the overall stuffy feeling, the overall rough feeling, etc., and the following expressions are adopted.
According to the weight calculation of AHP-Entropy weight evaluation model, the weight of the overall comfort perception that affects the overall comfort in Step2-1 is obtained as follows.
Step2-1:
At this stage of exercise, the stuffy feeling rises, because the human body begins to produce heat. However, compared with other perceptions, the restraint feeling has a relatively large weight on the comfort of tight-fitting sportswear in sports state, and the subjects are more sensitive to restraint, followed by the stuffy sense.
According to the weight calculation of AHP-Entropy weight evaluation model, the weight of the overall comfort that affects the overall comfort in Step2-2 movement stage is obtained as follows.
Step2-2:
At this stage, the influence of humidity perception on the overall comfort begins to increase, which also means that the amount of sweating increases. At the same time, the influence of stuffy feeling on the overall comfort has increased compared with the previous exercise stage, and the restrain sense is still the most important perception that affects the overall comfort at this exercise stage.
According to the weight calculation of AHP-Entropy weight evaluation model, the weight of the overall comfort perception that affects the overall comfort in Step2-3 is obtained as follows.
Step2-3:
In the third stage of exercise (step 2-3), the influence of stuffy feeling is weakened, probably because other perceptions are enhanced, so the influence of stuffy feeling on overall comfort at this time is relatively slightly weakened. The effects of sticky body feeling and humidity feeling have increased, and the increase of sticky body feeling is greater than that of humidity feeling.
According to the weight calculation of AHP-Entropy weight evaluation model, the weight of the overall comfort perception that affects the overall comfort in Step2-4 is obtained as follows.
Step2-4:
At this stage (step 2-4), the influence of humidity feeling (the average value of subjective evaluation of humidity is 4.3) is obvious, and the humidity value of most parts at this stage has reached 100%, indicating that the subjective evaluation is consistent with the objective data, and the sticky body sense (the average value of sticky body sense at this time is 3.4, and the general sticky body) is obvious, and the influence of sticky body on the overall comfort is obvious. The influence of rough feeling and soft feeling on the overall comfort has been weakened, and the influence of humidity feeling on the overall comfort has reached the maximum at this stage. Compared with the previous exercise stage, the influence of restraint feeling has decreased slightly.
According to the weight calculation of AHP-Entropy weight evaluation model, the weight of the overall comfort that affects the overall comfort in Step2-5 is obtained as follows.
Step2-5:
At this stage (step 2-5), the influence of sticky body feeling (the average value of viscidity is 4.3) on the overall comfort increases, and sticky body feeling has a stronger influence on the overall comfort than other senses, becoming the most important perception that affects the overall comfort, while the influence of humidity sense on the overall comfort decreases (although the average evaluation value of humidity perception is 4.6, which is very humid), and the influence of restrain feeling is still decreasing.
According to the weight calculation of AHP-Entropy weight evaluation model, the weight of the overall comfort perception that affects the overall comfort in Step3 is obtained as follows.
Step3:
In the rest stage after exercise (step 3), the influence of sticky body feeling and moisture feeling on the overall comfort is rising, and the sense of restraint is rising, but its influence on the overall comfort is still not as good as that of sticky body feeling and moist feeling, which means that sticky body feeling and moisture feeling are key to the comfort after exercise, and it also shows that the design of tight-fitting sportswear should consider the optimal design that is beneficial to reducing sticky body feeling and moisture feeling after exercise.
In order to more intuitively analyze the change of comfort perception in the whole exercise process and its influence on the overall comfort, the average comfort perception in each exercise stage, the average overall comfort in each exercise stage and the weight of the influence of each comfort perception on the overall comfort are plotted respectively, as shown in Figures 7 and 8.
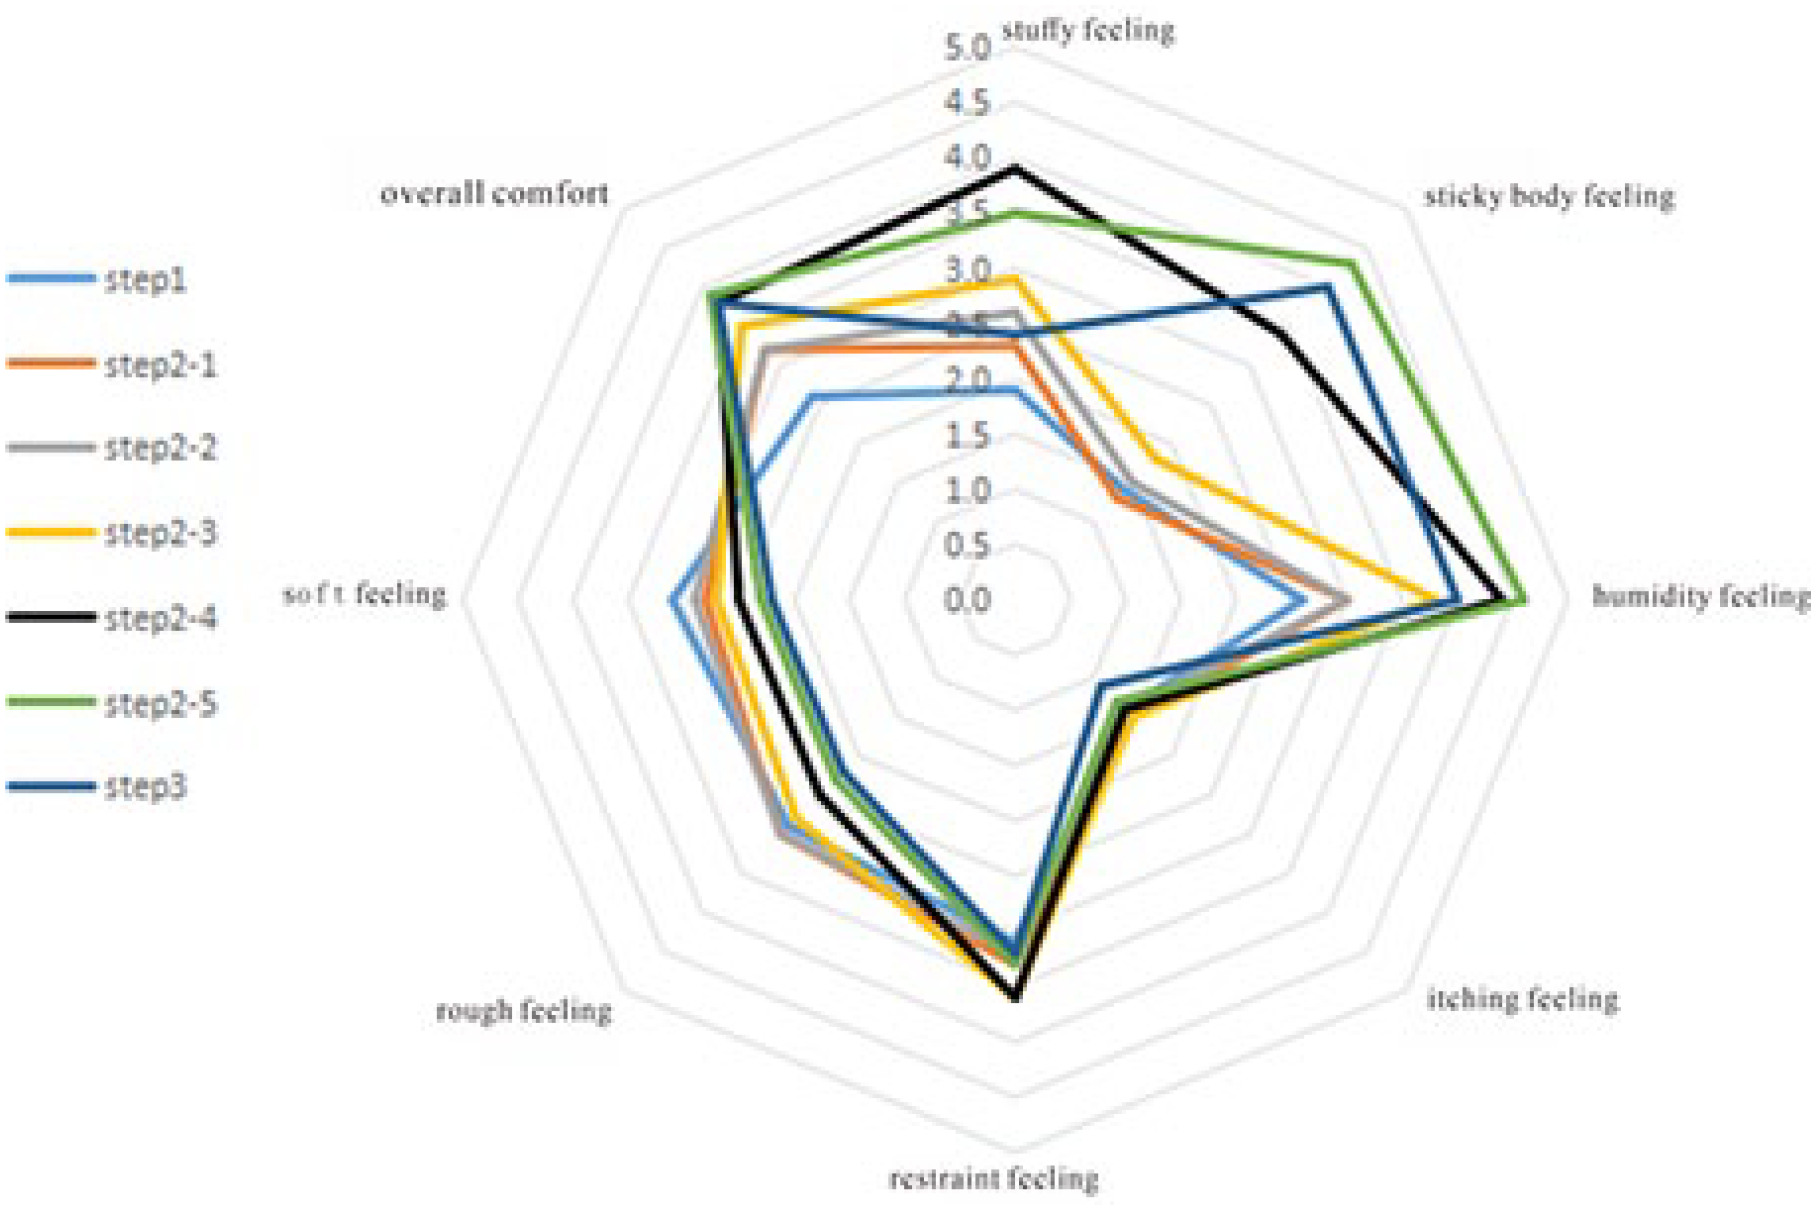
Average comfort and overall comfort in different exercise stages.

Distribution of perceived weight affecting overall comfort in different exercise stages.
As can be seen from Figures 7 and 8, the perception that affects the overall comfort has changed greatly before, during and after exercise, and the sense of restraint is the main perception that affects the overall comfort in the whole exercise stage, followed by the sense of humidity, and sticky body. There are some differences in the sense of restraint between sports and non-sports stages, which shows that the state of human movement has a great influence on the sense of restraint. The stuffy feeling drops between Step1 and Step2-1, mainly because it is mainly cool at rest (Step1). With the development of exercise, the human body begins to generate heat. With the increase of heat, the cool feeling gradually weakens. With the increase of exercise time (in Step2-2), the cool feeling disappears and the human body has a hot feeling, but at the same time, the amount of sweat of the human body will increase continuously, and the heat conduction of the tights fabric and the evaporation of sweat take away some of the heat. With the continuation of exercise and the increase of human sweating, the influence of thermal sensation on overall comfort gradually decreases (Step2-3, Step2-4, and Step2-5), while the influence of moisture sensation and sticky body sensation on overall comfort gradually increases. The change trend of humidity feeling and sticky body feeling in the movement stage is close.
With the continuous movement, various perceptions have changed, especially the sense of restraint, which is not obvious at rest, has become the most prominent during movement. Moreover, in the exercise stage, with the change of exercise time, the influence of restraint feeling on overall comfort first strengthens and then weakens. The stuffy feeling decreased in the exercise stage because the human body changed from cold feeling to hot feeling, but the influence of hot feeling on the overall comfort was not as good as that of wet feeling during the whole exercise, which showed that the heat dissipation performance of tight-fitting sportswear in the human body during exercise was better. The influence of rough feeling on the overall comfort is gradually decreasing, and at the same time, according to the subjective evaluation data, the subjective evaluation values of rough feeling in various parts are also decreasing, which may be mainly caused by the absorption of a lot of sweat by the fabric of tight-fitting sportswear. However, when the tight-fitting sportswear absorb a small amount of sweat (the humidity data from rest to Step2-1 shows that the humidity of all parts increases in different degrees at this time), the rough feeling will increase, but in this process, the average evaluation value of the rough feeling of tights will increase (from 2.9 at rest to 3.0).
In the first three stages of exercise (Step2-1, Step2-2, and Step2-3), the sense of restraint has always been the most important perception that affects the overall comfort. In the fourth stage of exercise (Step2-4), the sense of humidity has become the most important perception that affects the overall comfort, and the influence of sticky body sensation is also increasing, gradually surpassing the sense of restraint, which means that with the increase of human exercise, the sense of humidity, and sticky body feeling is gradually prominent (moreover, the average subjective evaluation of humidity feeling at this time is 4.4, which is very humid; at this time, the average value of sticky body sensation is 3.4, which is very sticky.). In the rest stage after exercise, the average evaluation values of humidity feeling and sticky body feeling are 4.0, but the influence of sticky body feeling on overall comfort is slightly stronger than that of humidity feeling.
Research shows that the factors that affect the overall discomfort will change with the passage of time, and there is also a correlation between comfort perceptions. This paper studies the correlation between comfort through Spearman correlation analysis, as shown in Formula (7), as shown in Table 6.

where, Ri and Si are the values of the observed value i, respectively;
Correlation between comfort perceptions.

Note. *Indicates that at the level of 0.05 (double tail), the correlation is significant.
From Table 6, it can be seen that the stuffy feeling is significantly correlated with the sticky body feeling and the humidity feeling respectively (p < 0.001). Sticky body feeling was also significantly correlated with humidity and rough feeling (p < 0.001). In addition, there is a negative correlation between humidity feeling and rough feeling, and the correlation coefficient is −0.618, which shows that the stronger the humidity, the less obvious the rough feeling, and the rough feeling decreases with the increase of humidity feeling. There is a significant correlation between sticky body feeling and humidity feeling, which also verifies the similarity of their influence on the overall comfort (i.e. the increasing trend of the influence degree).
Generally speaking, the sense of restraint, humidity, sticky body and stuffy are the main perceptions that affect the overall comfort in the exercise state. Although rough feeling and soft feeling have certain influence on the overall comfort in the initial stage of exercise, their influence on the overall comfort gradually weakens with the passage of exercise time. In addition, the influence of itchy feeling on the overall comfort is always the lowest. Although some parts itch during exercise (according to the subjective evaluation data of itchy feeling), they are different from other perceptions, the sense is weak.
However, for the perception that affects the overall comfort, we should know which parts of the perception have the greatest influence on the overall comfort, and make a more specific positioning to better improve the overall comfort, rather than just knowing what perception affects the overall comfort. In order to improve the comfort of tights better and more accurately, this paper will analyze the correlation between local comfort and overall comfort. In addition, whether these comforts are affected by the changes of human temperature, humidity and pressure will be analyzed in the module of local comfort and overall comfort.
Overall comfort perception and local comfort perception
First of all, analyze which parts of the perception affect the comfort, and then affect the overall comfort. For example, in Step2-2, the back humidity feeling is the main factor that affects the overall humidity feeling (OS-sbf). If the humidity feeling has a great influence on the overall comfort (OC) at this stage, the back humidity feeling is the local comfort feeling that affects the overall comfort.
The weight matrix that affects the overall comfort perception is shown in Formula (8).

Where, η represents step 1, step 2-1,. . ., step 3; wηsf-B represents the weight of back stuffy feeling in η stage; wηsf-W represents the weight of waist stuffy feeling in η stage; wηsbf-B indicates the weight of back sticky body sensation in η stage, etc.
According to the weight calculation of AHP-Entropy weight evaluation model, the weight of local comfort (i.e. the comfort sense of each part) that affects the overall comfort in Step1 is obtained as follows.
Step1:
At rest(step1), the stuffy feeling at this time is mainly manifested as coolness, with the coolness of the shank more obvious, and the stuffy feeling in other parts is less obvious; In this state, the itching feeling is not obvious, and the perceptual weights of all parts will be consistent or close; The influence of roughness of thigh-fitting sportswear and shank on overall comfort is more obvious than that of other parts, and so is soft feeling, which means that thigh and shank are more sensitive to roughness and softness than other parts; The sense of restraint is a manifestation of pressure in the state of exercise, but it is not that the sense of restraint is strong when the pressure is high, which is mainly related to the sensitivity of the position to pressure and the pressure. At present, many studies have some differences about the pressure comfort threshold of each position. Many scholars have different views on the threshold of pressure comfort. Makabe et al. 46 analyzed the pressure feeling at the waist of tights, and concluded that the pressure range of no discomfort at the waist was 0–1.47 kPa, the pressure range of slight discomfort was 1.47–2.46 kPa, and the pressure of extreme discomfort was over 2.46 kPa. Some researchers47–49 obtained the pressure comfort thresholds of chest, back, waist, abdomen and buttocks respectively, which were 0.64–1.04, 0.40–0.53, 0.14–0.31, 0.65–0.83, and 0.62–0.83 kPa; Some scholars believe that the comfort pressure in the exercise state is 0.49–2.6 kPa, and the comfort pressure in the static state is 0.14–1.19 kPa (50,51 used self-made pressure equipment to analyze the pressure comfort values of key parts of human body, and obtained that the comfort pressure of abdomen is 2.75 kPa, that of waist is 1.28 kPa, that of abdomen is 1.26 kPa, and that of chest is 0.94 kPa. Wang and Yao 52 thought that the comfortable pressure in general exercise state was 0.49–2.6 kPa, but in strenuous exercise, the pressure comfort value in some parts should be increased by 1.96 kPa; Senthilkumar et al. 53 found that the comfort pressure of calf is 1.87 kPa, and that of thigh is 1.07–1.33 kPa.
Based on the subjective evaluation and pressure measurement data of the subjects wearing all the combination of tight-fitting clothing, this paper defines the pressure threshold of the sense of restraint under different exercise states. In addition, because sticky body, humid and stuffy feelings are responses to temperature and humidity, the Spearman correlation coefficient shows that there is a significant correlation among the three. Therefore, sticky, humid and sultry feelings of each part will also be analyzed to find out the corresponding temperature and humidity values.
According to the previous correlation analysis of comfort, there are notable differences in the perception of various body parts during exercise, particularly regarding the sensation of constriction. Consequently, in this experiment, subjects were instructed to provide immediate feedback upon experiencing any sense of constriction. They were asked to rate this sensation and record the corresponding pressure values at that moment, along with temperature and humidity readings related to other sensations. In a static state, the shank experienced slight constriction (with an average rating for the sense of bondage being 2.8; the average pressure value on shank ranged from 0.55 to 1.04 kPa); similarly, there was slight restraint on the thigh (average evaluation score: 2.6; mean pressure value on thigh: 0.50–0.53 kPa); slight constriction was also noted in the chest area (average evaluation score: 2.9; mean pressure value for chest: 0.13–0.27 kPa); mild restraint was observed in the back region (average score: 2.5; mean back pressure value: 0.19–0.31 kPa); and finally, there was slight restraint felt in the hip area (average evaluation score: 2.4; mean hip pressure values ranged from 0.76 to 1.25 kPa). The impact of chest constriction on overall perceived restraint is significant due to its heightened sensitivity to pressure compared to both shank and thigh regions.
In summary, under stationary conditions, the overall perception that influences comfort is primarily affected by feelings of stuffy (weight: 0.308), rough feeling (weight: 0.219), restraint feeling (weight: 0.158), and soft feeling (weight: 0.106). Therefore, we will analyze the ranking of local perceptions that affect these overall perceptions. The ranking of local stuffiness affecting overall stuffiness is as follows: calf stuffy feeling (weight: 0.408), chest stuffy feeling (weight: 0.187), and waist stuffy feeling (weight: 0.183). This indicates that shank stuffy feeling has a significant impact on overall perceived stuffiness during this phase, followed by chest stuffy feeling. For the ranking of local roughness affecting overall roughness, we have thigh rough feeling (weight: 0.232) and shank rough feeling (weight: 0.227). This suggests that thigh rough feeling plays a more substantial role in influencing overall perceived roughness at this stage compared to shank rough feeling. Regarding the ranking of local constriction impacting overall restraint, it is as follows: chest restraint feeling (weight: 0.253), shank restraint feeling (weight: 0.244), thigh restraint feeling (weight: 0.196), and back restraint feeling (weight: 0.129). This implies that chest restraint feeling significantly affects the perception of overall constriction during this phase. Lastly, for the ranking of local softness affecting overall softness, we find thigh soft feeling with a weight of 0.272 and shank soft feeling with a weight of 0.251; thus indicating that thigh soft feeling has a greater influence on perceived overall soft feeling in this context.
Based on the AHP-Entropy weight evaluation model’s calculations, we obtain the weights for Step2-1 regarding how various aspects contribute to comfort during physical activity stages as follows.
Step2-1:
In the initial phase of exercise, the sensation of stickiness is not prominent; therefore, the weight of stickiness across various body parts is relatively similar, with no particular area exhibiting a significant degree of stickiness. Although the impact of itching on overall comfort during this stage is minimal, certain areas do contribute to the overall sensation of itchiness. This primarily occurs in the upper body regions such as the chest, back, and waist, where itchiness tends to manifest more readily compared to lower body areas. The roughness perceived in the chest region is particularly pronounced and significantly affects overall comfort perception. During this exercise phase, perceptions of comfort in the back, chest, and thigh have a considerable influence on overall comfort levels. The lack of noticeable differences in sensory weights among different body parts can be attributed to indistinct variations in heat and humidity sensations-such as stuffiness and dampness-during the early stages of physical activity. However, exercise induces differential constriction sensations across various regions; specifically, feelings of restraint in the shank, thigh, back, and chest are markedly stronger than those experienced in other areas. Their average ratings for constriction are 3.6 (shank), 3.6 (thigh), 3.4 (back), and 3.4 (chest). Both thigh and calf experiences approach a high level of constriction while both back and chest report an average level. At this point in time, pressure values for these regions range from 1.61 to 2.13 kPa for shank; 1.31–1.52 kPa for thigh; 0.31–0.36 kPa for back; and 0.28–0.37 kPa for chest respectively. Additionally, hip also exhibit a notable sense of restraint with an average rating at this stage being evaluated at 3.0—indicating moderate restraint—with corresponding pressure values ranging from 1.32 to 1.55 kPa.
At this stage (step2-1), the overall perception that affects overall comfort is mainly a sense of restraint feeling (weight value 0.292), stuffy feeling (weight value 0.186), rough feeling (weight value 0.138), humidity feeling (weight value 0.123), and soft feeling (weight value 0.111). Therefore, the ranking of local restraints that affect overall restraint is: shank restraint (weight value 0.372), thigh restraint (weight value 0.256), back restraint (weight value 0.142), and chest restraint (weight 0.120); The ranking of local stuffy feeling that affects overall stuffy feeling is: stuffiness in the thigh (weight value 0.244), stuffiness in the shank (weight value 0.190), stuffiness in the waist (weight value 0.167), and stuffiness in the abdomen (weight value 0.162); The ranking of local rough feeling that affects overall rough feeling: chest rough feeling (weight value 0.307), thigh rough feeling (weight value 0.227), back rough feeling (weight value 0.193); The ranking of local humidity sensations that affect overall humidity sensation: back humidity sensation (weight value 0.312), chest humidity sensation (weight value 0.249), thigh humidity sensation (weight value 0.163); The ranking of local soft feeling that affects overall soft feeling is: thigh soft feeling (weight value 0.243), shank soft feeling (weight value 0.217), back soft feeling (weight value 0.201), and waist soft feeling (weight value 0.117).
According to the weight calculation of the AHP-Entropy weight evaluation model, the weights of the local comfort (i.e. comfort of each part) that affect the overall comfort during the motion phase of Step 2-2 are obtained as follows.
Step2-2:
As the movement persisted, the thermal sensation in the chest emerged conspicuously (at this time, the average humidity of the chest was 43.6%–57%, and the average temperature was 29.1°C–30.9°C). As a crucial area of thermal sensation in the upper body, it has always been the research focus of thermal comfort. At this stage(step2-2), the thermal sensation in the thighs was also relatively prominent (at this time, the average humidity of the thigh was 30%–33%, and the average temperature was 30.2°C–31.2°C); there was a slight sticky sensation on the back (average humidity: 96%–100%, average temperature 32.1°C–32.5°C), thigh and chest (average humidity: 93%–95%, average temperature: 30.9°C–31.1°C), but the sticky sensation at this time had a relatively small impact on the overall comfort. The itchy sensation’s influence on the overall comfort was further weakened at this time. Itchiness only existed in the chest, and the itchy sensation in other parts basically disappeared. The influence degrees of the soft and rough sensations gradually declined, while the sensations of stuffiness and dampness significantly increased. The restraint sensation’s influence on the overall comfort remained rather significant. At this stage, the restraint sensations of shank, thigh, back and chest had a significantly stronger influence on the overall restraint sensation than other parts. Their average evaluation values of the restraint sensation were 3.7, 3.6, 3.4, and 3.3 respectively. The restraint sensations of the thigh and shank were close to relatively tight, while those of the back and chest were both generally tight. At this time, the average pressures at the shank, thigh, back and chest still were 1.61–2.13, 1.31–1.52, 0.31–0.36, and 0.28–0.37 kPa respectively. At this time, the average evaluation value of the restraint sensation of the hip at this stage was 3.1, and the average pressure at this time was 1.32–1.55 kPa.
At this stage (step2-2), the overall perception that affects the overall comfort is mainly the sense of restraint (weight value 0.340), the sense of stuffy heat (weight value 0.213), the sense of humidity (weight value 0.148), and the sense of roughness (weight value 0.102). Then, the local sense of restraint that affects the overall sense of restraint is ranked as follows: shank restraint feeling (weight value 0.249), chest restraint feeling (weight value 0.202), thigh restraint feeling (weight value 0.186), hip restraint feeling (weight value 0.112), and back restraint feeling (weight value 0.103); The order of local stuffy sensation affecting the overall stuffy sensation was: chest stuffy sensation (weight value 0.257), back stuffy sensation (weight value 0.239), thigh stuffy sensation (weight value 0.226), abdominal stuffy sensation (weight value 0.103); The order of local humidity that affected the overall humidity: back humidity (weight value 0.356), chest humidity (weight value 0.345), hip humidity (weight value 0.128); The order of local roughness affecting the overall roughness: chest roughness (weight value 0.198), thigh roughness (weight value 0.189), back roughness (weight value 0.164).
According to the weight calculation of AHP-Entropy weight evaluation model, the weight of local comfort (i.e. the comfort of each part) that affects the overall comfort in Step 2-3 is obtained as follows.
Step2-3:
In the Step2-3 stage, although other parts also gradually have a wet feeling, but the main wet feeling is still concentrated in the back and chest, the back has a strong humidity feeling and a slight sticky body feeling (at this time, the humidity is 98%–100%, the average temperature is 27.2℃–27.7℃); A slight cold sensation on the back (the humidity at this time is 98%–100%, the average temperature is 27.5℃–29.9℃); The chest is slightly sticky (humidity 100%, average temperature 29.2℃–29.4℃); The hip feel slightly sticky (average buttocks humidity 91%–94%, average temperature 25.1℃–27.9℃); The thigh feels slightly sticky (at this time, the average humidity of the thigh is 55%–58%, and the average temperature is 28.3℃–31.3℃); Slight heat sensation in the shank (average temperature is 29℃–29.3℃, average humidity is 80.3%–81.5%).
The influence of shank and thigh restraint on overall comfort was significantly stronger than that of back, chest, hip, waist, and abdomen. The average value of restraint evaluation of leg and thigh was 3.6 and 3.6 respectively. At this time, the average value of back and chest restraint evaluation was 3.5 and 3.4 respectively, and the feeling of thigh and shank restraint was still close to that of thigh and shank. The back and chest are generally restrained. The average pressure in the shank, thigh, back, and chest were still 1.61–2.13, 1.31–1.52, 0.31–0.36, and 0.28–0.37 kPa, respectively. The mean value of hip restraint was 3.1, and the mean value of pressure at this time was 1.32–1.54 kPa.
At this stage (step2-3), the overall perception that affects the overall comfort is mainly the feeling of restraint (weight 0.351), the feeling of humidity (weight 0.196), the feeling of sticky body (weight 0.143), and the feeling of stuffy (weight 0.104). Then, the order of the local feeling of restraint that affects the overall feeling of restraint is as follows: Thigh restraint (weight 0.266), shank restraint (weight 0.232), hip restraint (weight 0.161), chest restraint (weight 0.117), back restraint (weight 0.107); The order of local humidity that affected the overall humidity was as follows: back humidity (weight 0.276), chest humidity (weight 0.251), hip humidity (weight 0.172), abdomen humidity (weight 0.107); The order of local stickiness that affected the overall stickiness was thigh stickiness (weight 0.271), back stickiness (weight 0.254), chest stickiness (weight 0.172), and hip stickiness (weight 0.168). The ranking of local stuffy feeling affecting the overall stuffy feeling is as follows: back stuffy feeling (weight 0.277), chest stuffy feeling (weight 0.241), thigh stuffy feeling (weight 0.220), hip stuffy feeling (weight 0.107), and shank stuffy feeling (weight 0.102). At this time, the back and chest have reached the wettest state, but the impact of sticky body sensation on the overall sticky body is less than that of the thigh, which also means that in addition to humidity, sticky body sensation is related to other factors, such as temperature, contact area, and sensitivity to sticky body.
According to the weight calculation of the AHP-Entropy weight evaluation model, the weights of the local comfort (i.e. the comfort of each part) affecting the overall comfort in the exercise stage Step2-4 are obtained as follows.
Step2-4:
In this stage (step2-4), the sense of restraint in each part is weak, which leads to the weakening of the influence of the sense of restraint on the overall comfort. The mean values of the evaluation of the sense of restraint in the shank, thigh, back and chest are 3.3, 3.2, 3.1, and 3.0, respectively, and the thigh, shank, back and chest are all general restraints. The mean pressure of the shank, thigh, back, and chest were 1.21–1.37, 0.61–0.90, 0.31–0.36, and 0.28–0.37 kPa, respectively. The average binding sensation of the hip in P4, P2, and P3 tights is 3.2, and the average pressure at this time is 1.32–1.54 kPa. At this stage, a sense of bondage also appeared in the abdomen. At this stage, a sense of bondage suddenly appeared in the abdomen, which may be due to the adhesion between the tight-fitting clothing at this part and the abdomen after absorbing sweat, resulting in a “sense of restraint” in this part. At this time, the average abdominal pressure was 0.19–0.32 kPa.
In this exercise stage (step2-4), most parts such as the back and chest have reached the wettest state, but the wetness of the back and chest still has the largest influence weight on the overall comfort, which also means that the humidity sensitivity of the back is larger, so in the design of tight-fitting clothing, the moisture permeability of the back is the most important. The stuffy feeling is mainly concentrated in the thigh, back and chest. The temperature of the back began to drop at this stage, the temperature of the thigh dropped slightly, and the temperature of the abdomen fluctuated less.
In this stage (step2-4), the overall perception that affects the overall comfort is mainly humidity feeling (weight value: 0.334), restraint feeling (weight value: 0.223), sticky body feeling (weight value: 0.162), and stuffy feeling (weight value: 0.107). Then, the ranking of local humidity sensation that affects the overall humidity is as follows: Humidity sensation in the back (weight value: 0.219), chest (weight value: 0.203), waist (weight value: 0.166), abdomen (weight value: 0.144), thigh (weight value: 0.117); The order of local restraint that affected the overall restraint was hip restraint feeling (weight value: 0.201), leg restraint feeling (weight value: 0.198), thigh restraint feeling (weight value: 0.187), back restraint feeling (weight value: 0.122), abdomen restraint feeling (weight value: 0.112), and chest restraint feeling (weight value: 0.107). The order of local stickiness that affected the overall stickiness was: back stickiness (weight value: 0.221), chest stickiness (weight value: 0.219), thigh stickiness (weight value: 0.204) and abdomen stickiness (weight value: 0.195). The order of local stuffy sensation affecting the overall stuffy sensation is: thigh stuffy sensation (weight value: 0.231), chest stuffy sensation (weight value: 0.217), back stuffy sensation (weight value: 0.206), and shank stuffy sensation (weight value: 0.102).
According to the weight calculation of the AHP-Entropy weight evaluation model, the weights of the local comfort (i.e. the comfort of each part) affecting the overall comfort in the exercise stage Step2-5 are obtained as follows.
Step2-5:
In the Step2-5 stage, the sense of restraint in all parts was weakened. At this time, the mean values of the evaluation of the sense of restraint in the shank, thigh, back and chest were 3.0, 3.0, 2.9, and 2.8, respectively, indicating slight bondage. The mean pressure in the shank, thigh, back, and chest were still 1.21–1.37, 0.61–0.90, 0.31–0.36, and 0.28–0.37 kPa, respectively. The average value of hip restraint evaluation is 3.2, and the average value of pressure at this time is 1.32–1.54 kPa. According to the weight, the bondage feeling in this part has a greater impact on the overall bondage feeling.
The humidity of the back (still at 100% humidity) and chest (still at 100% humidity) also has a decreased impact on overall comfort, possibly because the temperature of sweat in the fabric of the chest and back is similar to or consistent with the skin temperature of the two areas, respectively, resulting in a decrease in the humidity weight of the two areas.
At this stage (step2-5), the overall perception that affects the overall comfort is mainly the sense of clinginess (weight value: 0.260), the sense of dampness (weight value: 0.247), the sense of mugginess (weight value: 0.136), and the sense of bondage (weight value: 0.119). Then, the order of local sticky body feeling that affects the overall sense of sticky body is as follows: back stickiness (weight value: 0.207), chest stickiness (weight value: 0.185), thigh stickiness (weight value: 0.167), abdomen stickiness (weight value: 0.138), waist stickiness (weight value: 0.116), hip stickiness (weight value: 0.101); The order of local humidity feeling that affected the overall humidity feeling was: back humidity feeling (weight value: 0.215), chest humidity feeling (weight value: 0.182), abdomen humidity feeling (weight value: 0.148), thigh humidity feeling (weight value: 0.136), hip humidity feeling (weight value: 0.123), waist humidity feeling (weight value: 0.117); The order of local stuffy sensation affecting the overall stuffy sensation was as follows: thigh stuffy sensation (weight value: 0.219), chest stuffy sensation (weight value: 0.186), waist stuffy sensation (weight value: 0.186), back stuffy sensation (weight value: 0.153), abdomen stuffy sensation (weight value: 0.122); The order of local bondage that affected the overall bondage was hip bondage (weight value: 0.201), shank bondage (weight value: 0.198), thigh bondage (weight value: 0.187), back bondage (weight value: 0.122), abdomen bondage (weight value: 0.112), and chest bondage (weight value: 0.107).
According to the weight calculation of the AHP-Entropy weight evaluation model, the weights of the local comfort (i.e. the comfort of each part) that affect the overall comfort in the exercise stage are obtained in Step3 as follows.
Step3:
In this stage (step3), despite the existence of pressure, the sense of restraint is almost not obvious. In addition, most of the other same sensations in each part are distributed evenly. For example, the weight of the sense of sticky body is similar between different parts, and the difference is no longer as big as in the previous stages of movement. During the rest stage, the sticky body feeling of the back and chest is still stronger than the sticky body feeling of other parts, and the sticky body feeling of the hip is gradually obvious, similarly, the humidity feeling of the hip is also more obvious. The humidity feeling of the back and chest is also the most pronounced compared to other areas.
At this stage (step3), the overall perception that affects the overall comfort is mainly sticky body feeling (weight 0.297), humidity feeling (weight 0.271), restraint feeling (weight 0.130), and stuffy feeling (weight 0.123). Then, the order of local sticky body feeling that affects the overall sticky body feeling is as follows: back sticky body feeling (weight 0.161), chest sticky body feeling (weight 0.152), hip sticky body feeling (weight 0.148), thigh sticky body feeling (weight 0.144), waist sticky body feeling (weight 0.139), abdomen sticky body feeling (weight 0.137), shank sticky body feeling (weight 0.119); Local bondage order that affects the overall bondage: Calf restraint (weight 0.158), thigh restraint (weight 0.149), hip restraint (weight 0.147), back restraint (weight 0.144), chest restraint (weight 0.138), abdomen restraint (weight 0.135), waist restraint (weight 0.129); Ranking of local mugginess that affects the overall feeling of mugginess: thigh stuffy feeling (weight 0.208), waist stuffy feeling (weight 0.179), abdomen stuffy feeling (weight 0.139), back stuffy feeling (weight 0.131), chest stuffy feeling (weight 0.127), hip stuffy feeling (weight 0.119), shank stuffy feeling (weight 0.102).
By comparing the restraint feeling and pressure values of each part in Step2-1 to Step2-4, it can be seen that the restraint feeling of the same part is similar and the pressure value is also similar. The corresponding pressure value of each part is analyzed in Step2-4. Throughout the exercise, the strongest degree of restraint is the back and chest, and only the thigh and shank are more strongly restrained. In Step2-5, the sense of bondage is slightly weakened. In different exercise stages, the influence of local comfort perception on the overall comfort perception has a certain difference, and the key parts are also changing, but in the late exercise (Step2-4 and Step2-5), the main comfort is wet, sticky, mainly concentrated in the back, chest and other parts. The upper body discomfort is mainly manifested as humidity feeling, sticky body feeling, stuffy feeling, etc., and the lower body discomfort is mainly manifested as restraint feeling, stuffy feeling, etc. Therefore, designers should pay attention to the appropriate choice of fabric materials when designing tight-fitting clothes worn under different movement times conditions, and also need to take into account that comfort is different in each period of exercise, including the rest stage after the exercise.
Local comfort and overall comfort
In order to clarify the influence weight of local comfort perception on overall comfort and obtain the key local perception that affects overall comfort, it is necessary to multiply the second-level weight (i.e. the weight value of local comfort perception affecting overall comfort perception) by the first-level weight (i.e. the weight of overall comfort perception affecting overall comfort) to obtain the comprehensive weight, that is, the weight of local comfort perception affecting overall comfort. The result is shown in Figure 9.

Local comfort perception weight values affecting overall comfort in different sports states.
In Step1, local comfort perception that affects overall comfort during exercise: shank stuffy sensation (weight value: 0.126), chest stuffy sensation (weight value: 0.058), waist stuffy sensation (weight value: 0.056), thigh rough sensation (weight value: 0.051), shank rough sensation (weight value: 0.050). This means that in this exercise stage, the stuffy feeling (cold feeling) of the shank has the greatest impact on the overall comfort, that is, when the shank feels cold, the overall feeling of the subject is colder, which in turn affects the overall comfort of the subject.
In Step2-1, local comfort perception that affects overall comfort under exercise: shank restraint feeling (weight value: 0.109), thigh restraint feeling (weight value: 0.075), chest rough feeling (weight value: 0.042), back restraint feeling (weight value: 0.041). This means that in this exercise stage, the sense of restraint of the shank has the greatest impact on the overall comfort, that is, when the shank feels very tight, the subject will feel the overall restraint to a large extent, and then affect the overall comfort of the subject.
In Step2-2, local comfort perception that affects overall comfort under exercise: shank restraint (weight value: 0.085), chest restraint (weight value: 0.069), thigh restraint (weight value: 0.063), chest stuffy (weight value: 0.055), back humidity (weight value: 0.053), back stuffy (weight value: 0.051), chest humidity (weight value: 0.051), thigh stuffy (weight value: 0.048).
In Step2-3, local comfort perception that affects overall comfort under exercise: thigh restraint (weight value: 0.093), shank restraint (weight value: 0.081), hip restraint (weight value: 0.057), back humidity (weight value: 0.054), chest humidity (weight value: 0.049), and chest restraint (weight value: 0.041).
In Step2-4, local comfort perception that affects overall comfort under exercise: back humidity (weight value: 0.073), chest humidity (weight value: 0.068), waist humidity (weight value: 0.055), abdomen humidity (weight value: 0.048), hip humidity (weight value: 0.045), shank humidity (weight value: 0.044), thigh humidity (weight value: 0.042).
In Step2-5, local comfort perception that affects overall comfort under exercise: back sticky body feeling (weight value: 0.054), back humidity feeling (weight value: 0.053), chest sticky body feeling (weight value: 0.048), chest humidity feeling (weight value: 0.045), thigh sticky body feeling (weight value: 0.043).
The rest phase after exercise affects the local perception of overall comfort: humidity sensation in the back (weight value: 0.051), humidity sensation in the chest (weight value: 0.049), sticky body sensation in the back (weight value: 0.048), sticky body sensation in the chest (weight value: 0.045), sticky body sensation in the hip (weight value: 0.044), sticky body sensation in the thigh (weight value: 0.043), humidity sensation in the hip (weight value: 0.043), stick body sensation on the abdomen (weight value: 0.041) and stick body sensation on the waist (weight value: 0.041).
It can be seen that pre-exercise: the discomfort is mainly concentrated in the shank, chest, waist, and thigh; During exercise: the discomfort is mainly concentrated in the shank, chest, back and thigh; After exercise: Discomfort is mainly concentrated in the back, chest and hip.
In some areas, the humidity reaches 100%, and there are some fluctuations or changes in temperature and perception. Take the back as an example, the back quickly reaches the wettest state (humidity of 100%), until the end of the rest phase of the exercise, the humidity of the back is still 100%, but the temperature has some fluctuations, first rising, then a small fluctuation up and down, and then falling. As can be seen from Figure 10, when the humidity of the back reaches 100%, the subjective evaluation of humidity maintains a high subjective evaluation value (average value is greater than 4.0), and the feeling of stuffy decreases first, then increases, and then decreases all the time. The sticky body sense is always rising, and the rise of sticky body sense is larger during exercise.

State of back comfort perception in different exercise stages.
In addition, when the humidity of each part did not reach the humidity saturation state, the temperature of each part rose slowly, but when it reached the wettest state, the performance of each part was different, and the hip temperature still rose when the humidity reached 100%. The shank temperature is also rising when the humidity reaches 100%; The temperature of the thigh decreases when the thigh reaches a wetter state (greater than 90%). When the humidity of the back reaches 100%, the temperature rises somewhat, and then begins to drop in 33rd–38th minute. The temperature of the back began to drop at this stage, the temperature of the thigh rose, and then slightly decreased, and the temperature of the abdomen fluctuated less. After the chest temperature reaches 100%, the temperature fluctuation is small. The influence of the sticky body sense on the overall comfort is mainly in the last stage of exercise, the restraint sense is the main perception in the early stage of exercise, and the influence of the sense of humidity on the overall comfort is mainly gradually obvious from the middle stage of exercise (Step2-3). With the extension of exercise time, the influence of rough feeling on the overall comfort gradually decreases. In the later stage of exercise (starting from Step2-4), it is mainly a sense of sticky body and humidity. The perception that affects the overall comfort changes with the increase of exercise time, so it is necessary to study the comfort during exercise.
To sum up, the main local comfort perception that affects the overall comfort of 6 km/h exercise are shank restraint feeling, shank stuffy feeling (cool), thigh restraint feeling, back humidity feeling, chest restraint feeling, chest stuffy feeling, back stuffy feeling, back sticky body feeling, thigh rough feeling, hip restraint feeling, back humidity feeling, chest humidity feeling, waist humidity feeling, waist stuffy feeling. In short, mastering the perception and its change rules during exercise, as well as the main perception affecting the movement process, can better design tight clothing, and thus improve the performance of the wearer during exercise.
Comprehensive analysis of local comfort perception affecting overall comfort
The main local comfort perceptions that affect the overall comfort during 6 km/h exercise are shank restraint feeling, shank stuffy feeling, thigh restraint feeling, back humidity feeling, chest restraint feeling, chest stuffy feeling, back stuffy feeling, back sticky body feeling, thigh rough feeling, hip restraint feeling, back humidity feeling, chest humidity feeling, waist humidity feeling, and waist stuffy feeling.
There are some similarities in the local comfort perception that affects the overall comfort. For example, the feeling of shank restraint, thigh restraint, back humidity, chest stuffy and back sticky body are the main comfort perceptions that affect the wearing comfort of tight-fitting sportswear. Moreover, it can be concluded that stuffy feeling, humidity feeling, sticky body feeling and restraint feeling are the main perceptions at 6 km/h. The perception that affects sports comfort is mainly concentrated in the key parts such as back, chest, shank and thigh, so these four parts are the key parts of tight-fitting sportswear design.
It is found that the upper body is the concentrated area of heat sensation and wet sensation, and the lower body is the concentrated area of restraint sensation. It is also found that the perception of some body parts has little influence on the overall comfort. For example, the shank sticky body feeling evaluation is not high, but the impact on the overall sticky body feeling is small, which indicates that the impact of shank sticky body feeling on the overall comfort is less than that of other parts. The stuffy sensation on the hip is less important for overall comfort than in other parts. Therefore, after comprehensive analysis of local comfort results at different motion steps, sensitivity of different body parts to each perception was sorted according to the sensitivity from best to worst (Because the tight-fitting clothing used in this experiment only appeared several times in individual parts or exercise stages, it was difficult to measure sensitivity of each part, and the influence on exercise comfort during the whole exercise process was not particularly important. Therefore, the sensitivity to itching is not evaluated), as follows.
The order of sensitivity to roughness: thigh, chest, back, shank, abdomen, waist, hip; The order of sensitivity to muggy: thigh, chest, back, waist, abdomen, shank, hip; The order of sensitivity to sticky body: back, thigh, chest, abdomen, waist, hip, shank; The order of sensitivity to humidity: back, chest, abdomen, hip, thigh, waist, shank; The order of sensitivity to restraint: chest, back, thigh, shank, hip, abdomen, waist; The order of sensitivity to softness: thigh, shank, back, chest, waist, abdomen, hip; The most likely parts of discomfort: chest, thigh, back, waist, abdomen, shank, hip.
At the same time, it was found that the humidity feeling of back and chest is stronger than other body parts, followed by the thigh and waist; And found that during the running, humidity feeling is the main position, so regarding the comfort of tight-fitting clothing, we should pay attention to the optimization design of moisture conductivity function. The most sensitive parts to stuffy and sticky body sensations were thigh, chest and back, which also indicated that the sensitivity of these three parts to these two sensations was similar. The impact of itching on overall comfort is always low, indicating that the tight-fitting clothing material used in this paper has good performance in itching.
From the perspective of comfort, during the exercise of 6 km/h, the feeling of pressure (bondage) is mainly concentrated in the shank and thigh, and the perception of heat and humidity is mainly concentrated in the chest, back and waist.
In general, the sultry sensation in front and rear of upper body was unevenly distributed, but for sultry sensation, the front of upper body (chest) was more sensitive to the rear of upper body (back); For dampness, the rear of the upper body (back) is more sensitive to the front (chest, abdomen). The upper body is more hot and wet than the lower body, and the lower body is stronger than the upper body. The sultry feeling of the thigh is usually hotter than that of the shank, and the sultry feeling of the shank is significantly lower than that of most parts of the body; The feeling of sweltering at rest is more intense (hotter) than the feeling of sweltering during exercise. During rest and exercise, the impact of the perception of the shank and chest on the overall comfort has always been a key part, while the feeling of bondage has a greater impact on the overall comfort in the first three stages of exercise, while the impact is less in the later stage. Therefore, the comfort and pressure optimization design of these parts are mainly considered in the design of tight-fitting clothing.
Research limitations
At present, this study is based on the laboratory controllable environment (ambient temperature 20 ± 2℃, relative humidity 60 ± 5%, and average wind speed less than 0.1 m/s), and analyzes the influence of comfort in different parts on comprehensive comfort, but there are two limitations: First, the experiment does not involve extreme weather scenes such as high temperature, high humidity or heat wave, and it is planned to carry out outdoor experiments during heat wave (such as daily maximum temperature is more than 35℃) in the future. Secondly, the sample features are relatively simple. At present, it is mainly healthy young men aged 20–30 (n = 10). Although the variables such as gender and BMI (20.2–23.6 kg/m²) are controlled, it does not cover women, adolescents, the elderly, and overweight/obese groups. In the future, the sample size will be expanded to n ⩾ 100, according to age (18–65 years old) and age. In addition, this study focuses on indoor standardized sports scenes, while climate variability such as solar radiation and wind speed in outdoor environment and complex sports scenes such as walking and cycling may significantly affect comfort. In the future, it is necessary to combine the case study of clothing and outdoor thermal comfort (OTC),54,55 to analyze the interaction between outdoor thermal comfort (OTC) and tights material and exercise intensity, in order to enhance the guiding value of research on real sports scenes under the background of climate change.
Although there are some limitations in this research, the results of this study provide basic data for the construction of comfort prediction model in outdoor complex environment, and suggest that wearable sensors (such as continuous body temperature monitoring patches) and machine learning algorithms should be combined in the future to realize real-time comfort feedback and further enhance the practical value of the research.
Conclusion
This study innovatively adopted the AHP-entropy evaluation model. Through the dual calibration of subjective weighting (AHP) and objective weighting (Entropy weighting), the weights of six key perceptual factors such as “sticky body feeling” and “humidity feeling” were quantified, verifying the necessity of multi-factor comprehensive evaluation for capturing complex comfortable experiences.
(1) Through AHP-Entropy weight evaluation method, this paper analyzes the comfort perception that affects each stage and the main comfort perception of different parts, and finally determines the perception that affects the overall comfort and the key parts. The feelings of restrain, humidity, sticky body, and sultry are the main perceptions that affect the overall comfort in the exercise state. During the whole exercise process, the key parts that produce the restrain feeling are the back, chest, thigh and shank. In Step2-5, the restrain feeling is slightly weakened. In different stages of exercise, the influence of local comfort perception on the overall comfort perception is different, and the key parts are also changing, but in the later stages of exercise (Step2-4 and Step2-5), the main comfort is humidity feeling and sticky body feeling, mainly concentrated in the back, chest and other parts. The discomfort of the upper body is mainly manifested as humidity, sticky body and stuffy, while the discomfort of the lower body is mainly manifested as restrain and stuffy. Humidity and sticky sensation are mainly concentrated in the back and chest. By analyzing the weight of local comfort perception that affects the overall comfort in different exercise states, the main local comfort perception that affect the overall comfort in 6 km/h exercise are shank restraint, shank stuffy feeling (cool feeling), thigh restraint, back humidity feeling, chest restraint, chest stuffy feeling, back sticky body feeling, thigh rough feeling, hip restraint feeling, back humidity feeling, waist humidity feeling, and waist stuffy feeling.
(2) The stuffy feeling is significantly correlated with the sticky body feeling and the humidity feeling; Sticky body feeling is also significantly related to humidity feeling and rough feeling. There is a negative correlation between humidity feeling and rough feeling, which shows that the stronger the humidity feeling, the less obvious the rough feeling, and the rough feeling decreases with the increase of humidity feeling.
In conclusion, this study has established a multi-dimensional comfort evaluation system for tight-fitting sportswear under exercise conditions. It not only makes up for the methodological deficiencies of existing research but also realizes the quantitative assessment of the comfort of tight-fitting sportswear under exercise conditions, providing a new scientific perspective for the adaptive design of sports equipment in the context of climate change.
Footnotes
Consent to participate
Informed consent was obtained from all individual participants included in the study.
Consent for publication
The authors affirm that the participants provided informed consent for publication.
Funding
The author(s) disclosed receipt of the following financial support for the research, authorship, and/or publication of this article: The authors would like to acknowledge the financial support from Supported by Scientific Research Foundation, Zhejiang Sci-Tech University (No. 24072193-Y), Zhejiang Provincial Department of Education General Scientific Research Project (No. Y202454304).
Declaration of conflicting interests
The author(s) declared no potential conflicts of interest with respect to the research, authorship, and/or publication of this article.