
Abstract
Fused Deposition Modeling (FDM) is a widely used 3D printing technique, which works based on the principle of melted polymer extrusion through nozzle(s) and depositing them on a build plate layer by layer. However, products manufactured with this method lack proper mechanical strength. In this work, 2/1 twill weave fabric structures are 3D printed using poly (lactic) acid (PLA). The ultimate tensile strength in the warp and weft directions and the modulus (stiffnesses) are measured for non-heat-treated (NHT) samples. The printed samples were heat-treated (HT) to improve the strength and stiffness. The variation in ultimate tensile strength is statistically insignificant in warp direction at all temperatures; however, the tensile strength in weft direction decreased after heat treatment. The modulus in warp direction increased by 31% after heat treatment while in the weft direction it decreased after heat treatment. Differential scanning calorimetry (DSC) tests showed the highest crystallinity at 125°C. The properties of the twill fabrics were compared with a standard dog-bone (DB) specimen using uniaxial tensile tests, Differential scanning calorimetry tests, and optical microscope (OM). For dog-bone specimens, the maximum values of crystallinity, ultimate tensile strength, and modulus were found to be at 125°C. The maximum crystallinity percentages are higher than that of the NHT samples. The ultimate tensile strength of NHT DB specimen 3D printed in horizontal orientation improved after heat treatment. The ultimate tensile strength of DB samples in vertical directions increased after heat treatment as well. The stiffness increased in both directions for DB samples.
Keywords
Introduction
Additive manufacturing (AM) is a revolutionary manufacturing technology which has the potential to build almost any complex product within a reasonably short time with minimal waste. 1 This technology is classified into seven categories by The American Society for Testing and Materials (ASTM): material extrusion, material jetting, binder jetting, sheet lamination, vat photopolymerization, powder bed fusion, and directed energy deposition. 2 Fused deposition modeling (FDM) works based on the material extrusion principle and utilizes thermoplastic materials such as poly (lactic) acid (PLA), acrylonitrile butadiene styrene (ABS), polyether ether ketone (PEEK), nylon, Poly (methyl methacrylate) (PMMA), and poly (carbonate) (PC). The polymer is melted and extruded through a nozzle and deposited on a build plate layer by layer forming a solid object. 3 The mechanical strength of FDM 3D printed parts is lower compared to those obtained from injection molding or other manufacturing methods due to the presence of voids and weaker bonding between layers and rasters. 4 Therefore, different methods have been proposed to increase the strength which includes parameter optimization, addition of filler materials and post curing with heat treatment (HT).
Akhoundi and Behravesh
5
investigated the effect of filling patterns and infill density on the mechanical properties of 3D printed parts and concluded that concentric fill at all infill densities and Hilbert curve pattern (named after the German mathematician David Hilbert which is a continuous space-filling curve) at 100% infill density show increase in mechanical strength of the products. However, a study of these parameters on non-standard materials such as 3D printed fabrics would be required to truly compare their effects on non-standard materials. Chacón, et al.
6
studied several process parameters such as build orientation, layer thickness, and feed rate and their effects on final strength of 3D printed products and found that upright orientation exhibited the lowest mechanical properties whereas on-edge and flat orientations the highest. They also observed increase in mechanical properties with increasing layer thickness and decrease with increasing feed rate for upright orientation whereas the layer thickness and feed rate play insignificant role for on-edge and flat orientations. However, it should be mentioned that all non-standard materials may not be possible to print in flat or on-edge orientations. Chacón et al.
7
worked on continuous fiber reinforced thermoplastic composites and demonstrated that the carbon fiber reinforced samples developed the highest strength and stiffness than all other samples. Heat treatment increases the crystallinity of samples and hence improves the mechanical properties in comparison with the non-heat-treated (NHT) samples.
8
This method increases the bonding between the layers and rasters. Avila et al.
9
investigated the effect of heat treatment at 90% of glass transition temperature (
Recently, FDM has been used in fashion and textile industries to produce bikinis, 12 gowns, 13 and shoes. 14 Melnikova et al. 15 3D printed textile-based structures using different polymers. They studied PLA, soft PLA, Lay Tekkks and BendLay, and demonstrated that soft PLA is the potential candidate to be used to print textile-like structures. Partsch et al. 16 used ABS to insert textile properties in 3D printed objects. They designed, printed, and evaluated three different plain weaves. Quan et al. 17 3D printed multi-directional preforms using ABS and showed the feasibility of 3D printing of multi-directional textile-based preforms. Lussenburg et al. 18 designed a wearable garment using PLA and concluded that final product does not resemble all the fabric properties and needs further research to improve tear resistance and softness of the structures. Although several researchers attempted to 3D print fabric structures, the evaluation of mechanical properties of 3D printed fabric structures is lacking in the literature except as indicated in our previous work. 4 We evaluated the tensile and flexural properties of 3D printed twill weave fabric structures and found that the fabrics in weft direction fail at less than 5% of strain under uniaxial tensile loading and less than 5 mm in flexural displacement. Fabrics in warp direction exhibited more strength and broke at an elongation between 10% and 30% under tensile loading and between 8 mm and 12 mm under flexural displacement. The average ultimate tensile strengths were 32 MPa and 10 MPa in warp and weft directions, respectively.
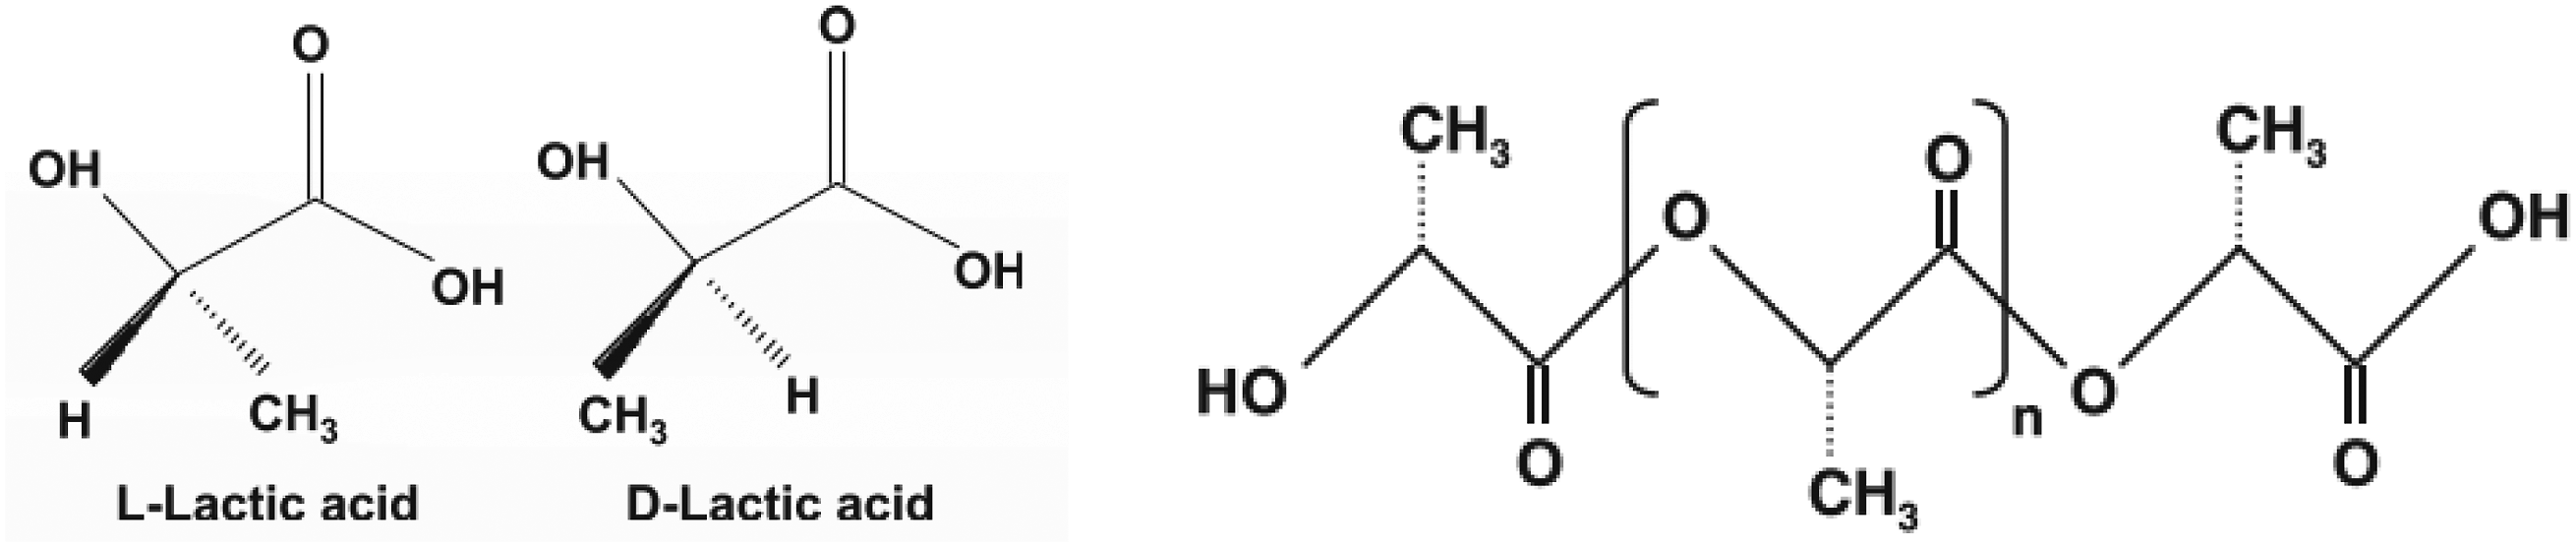
PLA is one of the most common materials used in 3D printing with FDM. It is bio-degradable, recyclable, and renewable thermoplastic material synthesized from starch obtained from corn, wheat, rice, etc.19,20 It is produced by processing and polymerization of lactic acid monomer and it exists in two optically active configurations, the L (+) and D (−) isomers as shown in Figure 1.21–23 The content of L, D, and D-L type of lactides in the blend influences crystallinity, mechanical properties and degradation characteristics of PLA.
8
A highly crystalline PLA can be produced by decreasing the D content (<2%) whereas a totally amorphous PLA can be obtained by increasing the D content (>20%).22,24 Hence, to produce the PLA material for commercial use, generally a higher amount of L type lactides and lower content of D type lactides are used.8,24 These lactides are blended in a required amount to produce either semi-crystalline PLLA (poly-L-lactic acid) or amorphous PDLA (poly-D-lactic acid) by a ring opening polymerization process. Chemical structure of L and D isomers of lactic acid (left) and high molecular weight PLA formed by ring opening polymerization (right).
22
The arrangement of macromolecular polymer chains is an important factor related to the mechanical strength. In crystalline regions, the macromolecular chains are arranged in a regular fashion and hence they contribute towards the higher intermolecular forces whereas in amorphous regions, the macromolecular chains have a random arrangement and therefore they are weaker in strength. Figure 2 shows a schematic diagram representing the arrangement of crystalline and amorphous regions of 3D printed PLA samples. Schematic diagram showing the arrangement of crystalline and amorphous regions in 3D printed PLA samples.
This research focuses on 3D printing of twill weave structures for wearable fabrics which is a current development area. The effect of heat treatment at various temperatures on the mechanical properties and crystallization behavior of PLA is studied. The relationship between crystallinity and mechanical properties (e.g., modulus and ultimate tensile strength) is investigated. The properties of 3D woven fabric structures are compared with those of standard dog-bone samples.
Materials and methods
Materials and 3D print settings
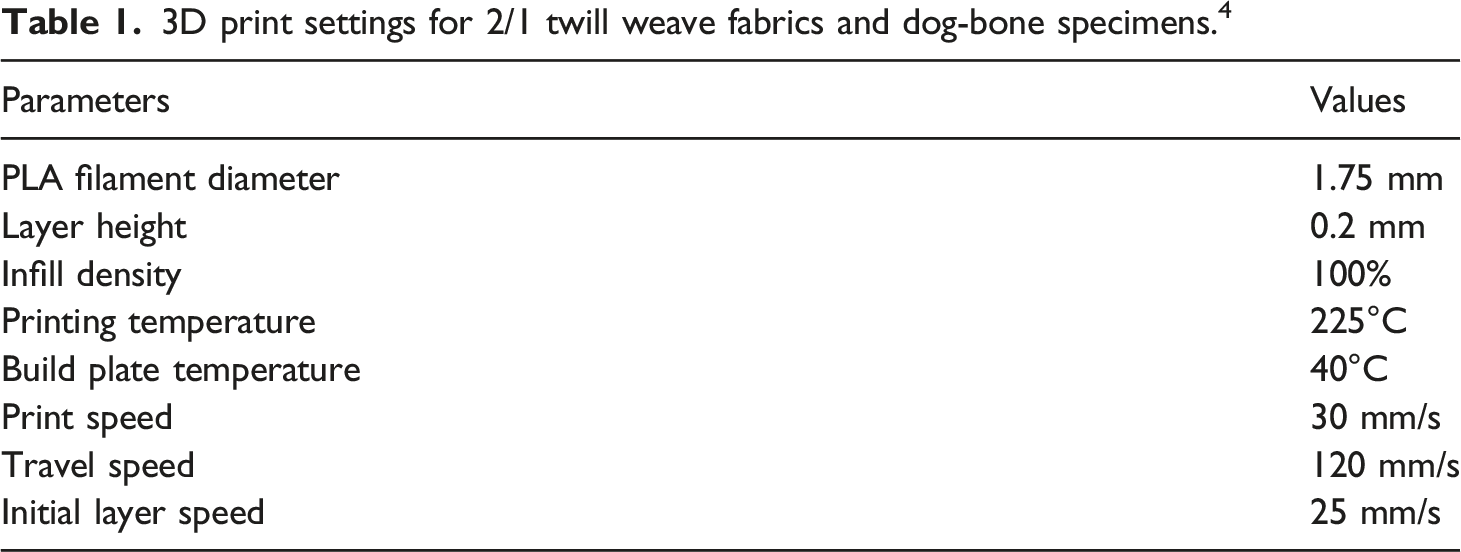
3D print settings for 2/1 twill weave fabrics and dog-bone specimens. 4
3D printing of specimens
3D models of 2/1 twill weave fabrics and dog-bone specimens were prepared using computer aided design (CAD) software, Solidworks® and saved with. STL format. Dremel DigiLab 3D slicer 1.2.2 software was used to slice the 3D models, and the resulting g-code files were used for 3D printing using Dremel DigiLab® 3D45 3D printer (Dremel Manufacturing Company, Racine, Wisconsin, USA). The printer had a nozzle diameter of 0.4 mm.
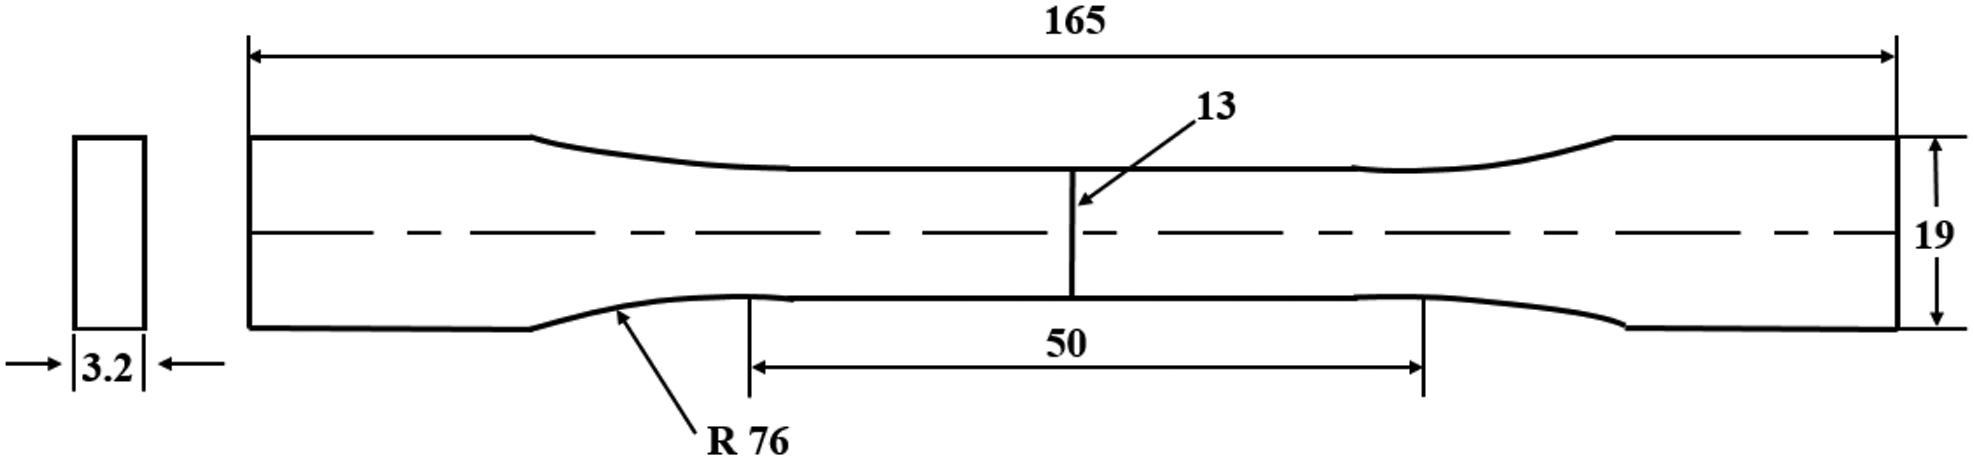
The movement of the nozzle in x-direction is the print direction (PD, 0°) and the movement in z-direction is the cross-print direction (CD, 90°). The yarns in printing direction are called warp yarns and the perpendicular yarns in cross-printing direction are termed as weft yarns. Y-axis represents the thickness of the fabric structure. The fabrics were printed in a vertical orientation in a square shape. Figure 3 represents the schematic of FDM process used in the 3D printing of twill weave fabrics and Figure 4 shows the FDM 3D printed twill fabric structures. The dimensions of the 3D printed fabrics are 92 mm × 92 mm with 30 warp and 30 weft yarns; each yarn diameter is 1 mm. The spacing between the yarns is 3 mm in both directions. The areal density of the fabric is 1.018 Schematic of FDM printing of 2/1 twill weave fabric structures (not to scale). FDM 3D printed 2/1 twill weave fabric structure: (a) Front view of the fabric along with its unit cell, and (b) Side view of the 3D printed fabric. Dog-bone specimen geometry and dimensions for uniaxial tensile tests according to ASTM D638-14, Type I standard (dimensions in mm).
25
3D printed and non-heat-treated dog-bone specimen.


Heat treatment of samples
The printed samples were heated in a temperature-controlled lab oven at different temperatures for 1 h and then allowed to cool slowly in the oven, a process called furnace cooling. The samples were heat-treated at 50°C, 75°C, 100°C, and 125°C for 1 h and were termed as HT50, HT75, HT100, and HT125, respectively. The nomenclature of the samples used in this study is shown in Figure 7. Nomenclature of the samples used in this study.
Uniaxial tensile testing
The tensile test samples were cut from the printed twill fabric structures in warp and weft directions having dimensions of 92 mm (length) × 46 mm (width) × 3.15 mm (thickness) in such a way that each test specimen contained 15 yarns. Mechanical properties of 3D printed, heat-treated (HT) and non-heat-treated (NHT) twill weave fabric structures were measured using an Instron 5565 universal testing machine (Norwood, MA, USA) with a load cell of 1 kN following the ASTM D5035 standard,
25
with a gage length of 25 mm, and crosshead speed of 3 mm/min. The breakage of the first yarn is considered as the failure of the fabric structure. The experimental data were processed to determine the ultimate tensile strength and Young’s modulus. Tensile stress (
Similarly, the mechanical properties of 3D printed, heat-treated, and non-heat-treated rectangular dog-bone specimens were measured using the same equipment with a load cell of 5 kN, a gage length of 50 mm and thickness of 3.2 mm (Figure 5) following ASTM D638-14, Type I standard.
26
The tensile test was carried out on five specimens for each structure at room temperature, and the average values were reported. Tensile stress (
Young’s modulus (E) was measured in linear region by using the following equation
Differential scanning calorimetry
Differential scanning calorimetry test was conducted using a Q 2000 (TA instruments, USA) maintaining a nitrogen atmosphere with a supply rate of 50 mL/min. The samples used weighs in the range of 4–8 mg. They were first heated from 40°C to 200°C and then were cooled back to 40°C at a heating and cooling rate of 10 °C/min. The measurements such as glass transition temperature (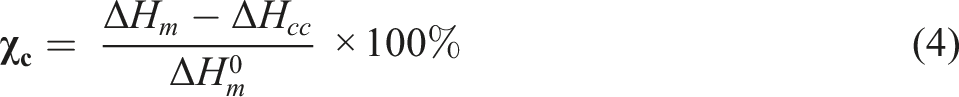
Optical microscope images
The cross-sections and longitudinal surfaces of warp yarns, weft yarns, and dog-bone specimens fractured during tensile testing were studied using an optical microscope (Olympus SZX7, Japan). The optical microscope was used to measure the area of voids on each image and percent void content relative to the total area, as shown in Figure 8. The void content is calculated as the ratio of void area to total cross-sectional area or surface area. Mathematically, it can be expressed as Example showing the measurement of void content on the cross-section of HT125-warp sample.

The void content of HT125-warp sample is
Statistical Analysis
Analysis of variance (ANOVA) test was done for tensile test results by using Microsoft Excel to evaluate the effect of heat treatment on the 3D printed fabrics and dog-bone samples. All analyses were carried out at 0.05 significance level (i.e., α = 0.05). To determine exactly which group means are significantly different, a Tukey–Kramer post hoc test was performed.
Results and discussion
Optical microscope Analysis
The OM images of the cross-sections of fractured NHT and HT twill fabric samples are presented in Figure 9. The cross-section of NHT-warp shows uniform fusion of fibers having smaller pores, whereas the HT125-warp has separated fibers having a large volume of voids, as indicated by dotted circles. Although each fiber is separated, the breaking of individual fibers is not seen. Since all the fibers are positioned parallel to each other, they are united under tensile loading and contribute equally to mechanical strength. The NHT-weft yarn has proper fusion of fibers on its cross-section, but it contains crack growth lines extending from the circumference towards the center with a void content of 1.82% of its total cross-sectional area. After heat treatment at 125°C, the crack propagated causing each deposited layer to be fractured and the void content increased to 6.78% of the total cross-sectional area. The fractured layer contributes to strength reduction and ultimately the failure. Optical microscope images showing the cross-sections of non-heat-treated and heat-treated warp and weft yarns separated from 3D printed 2/1 twill fabric structures after tensile testing: (a) NHT-warp, (b) HT125-warp, (c) NHT-weft, and (d) HT125-weft.
The longitudinal surfaces of warp and weft yarns are shown in Figure 10. The surface of NHT-warp is observed to be intact and voids are hard to find, whereas in the HT125-warp yarn, the broken fibers can be easily observed. However, most of the fibers are still intact and continuous; as a result, the change in tensile strength was statistically insignificant. In case of weft yarns, the NHT-weft yarn contained proper fusion of deposited layers except few voids, which is only 0.69% of the total surface area. As a result of heat treatment at 125°C, the layers are broken multiple times as shown by dotted circles (Figure 10(d)) and the void content became 1.17% of total surface area. Since the tensile force is applied perpendicular to these deposited layers, they got detached from each other under relatively small loads, which contributed towards the reduction in mechanical properties. Optical microscope images showing the longitudinal surfaces of heat-treated and non-heat-treated warp and weft yarns separated from 3D printed 2/1 twill fabric structures after tensile testing: (a) NHT-warp, (b) HT125-warp, (c) NHT-weft, and (d) HT125-weft.
Figure 11 represents the microscopic images of cross-sections for heat-treated (at 125°C) and non-heat-treated dog-bone specimens. The cross-section of NHT-horizontal specimen shows the fusion of the deposited layers; after heating at 125°C, the layers are arranged in a sequence. The HT125-horizontal specimen undergoes brittle failure showing higher mechanical strength and lower elongation at maximum load. In vertical specimens, a void content of 26.70% of the total cross-sectional area between the layers can be seen as shown by the arrows. Those voids are filled up by the respective layers at 125°C and reduced to 5.65%. This might have happened due to heating above glass transition temperature at which the polymer chain got chance to reinfuse together. It is believed that this reinfusion of layers improved the mechanical properties. Optical microscope images showing the cross-sections of heat-treated and non-heat-treated horizontal and vertical dog-bone specimens after tensile testing: (a) NHT-horizontal, (b) HT125-horizontal, (c) NHT-vertical, and (d) HT125-vertical.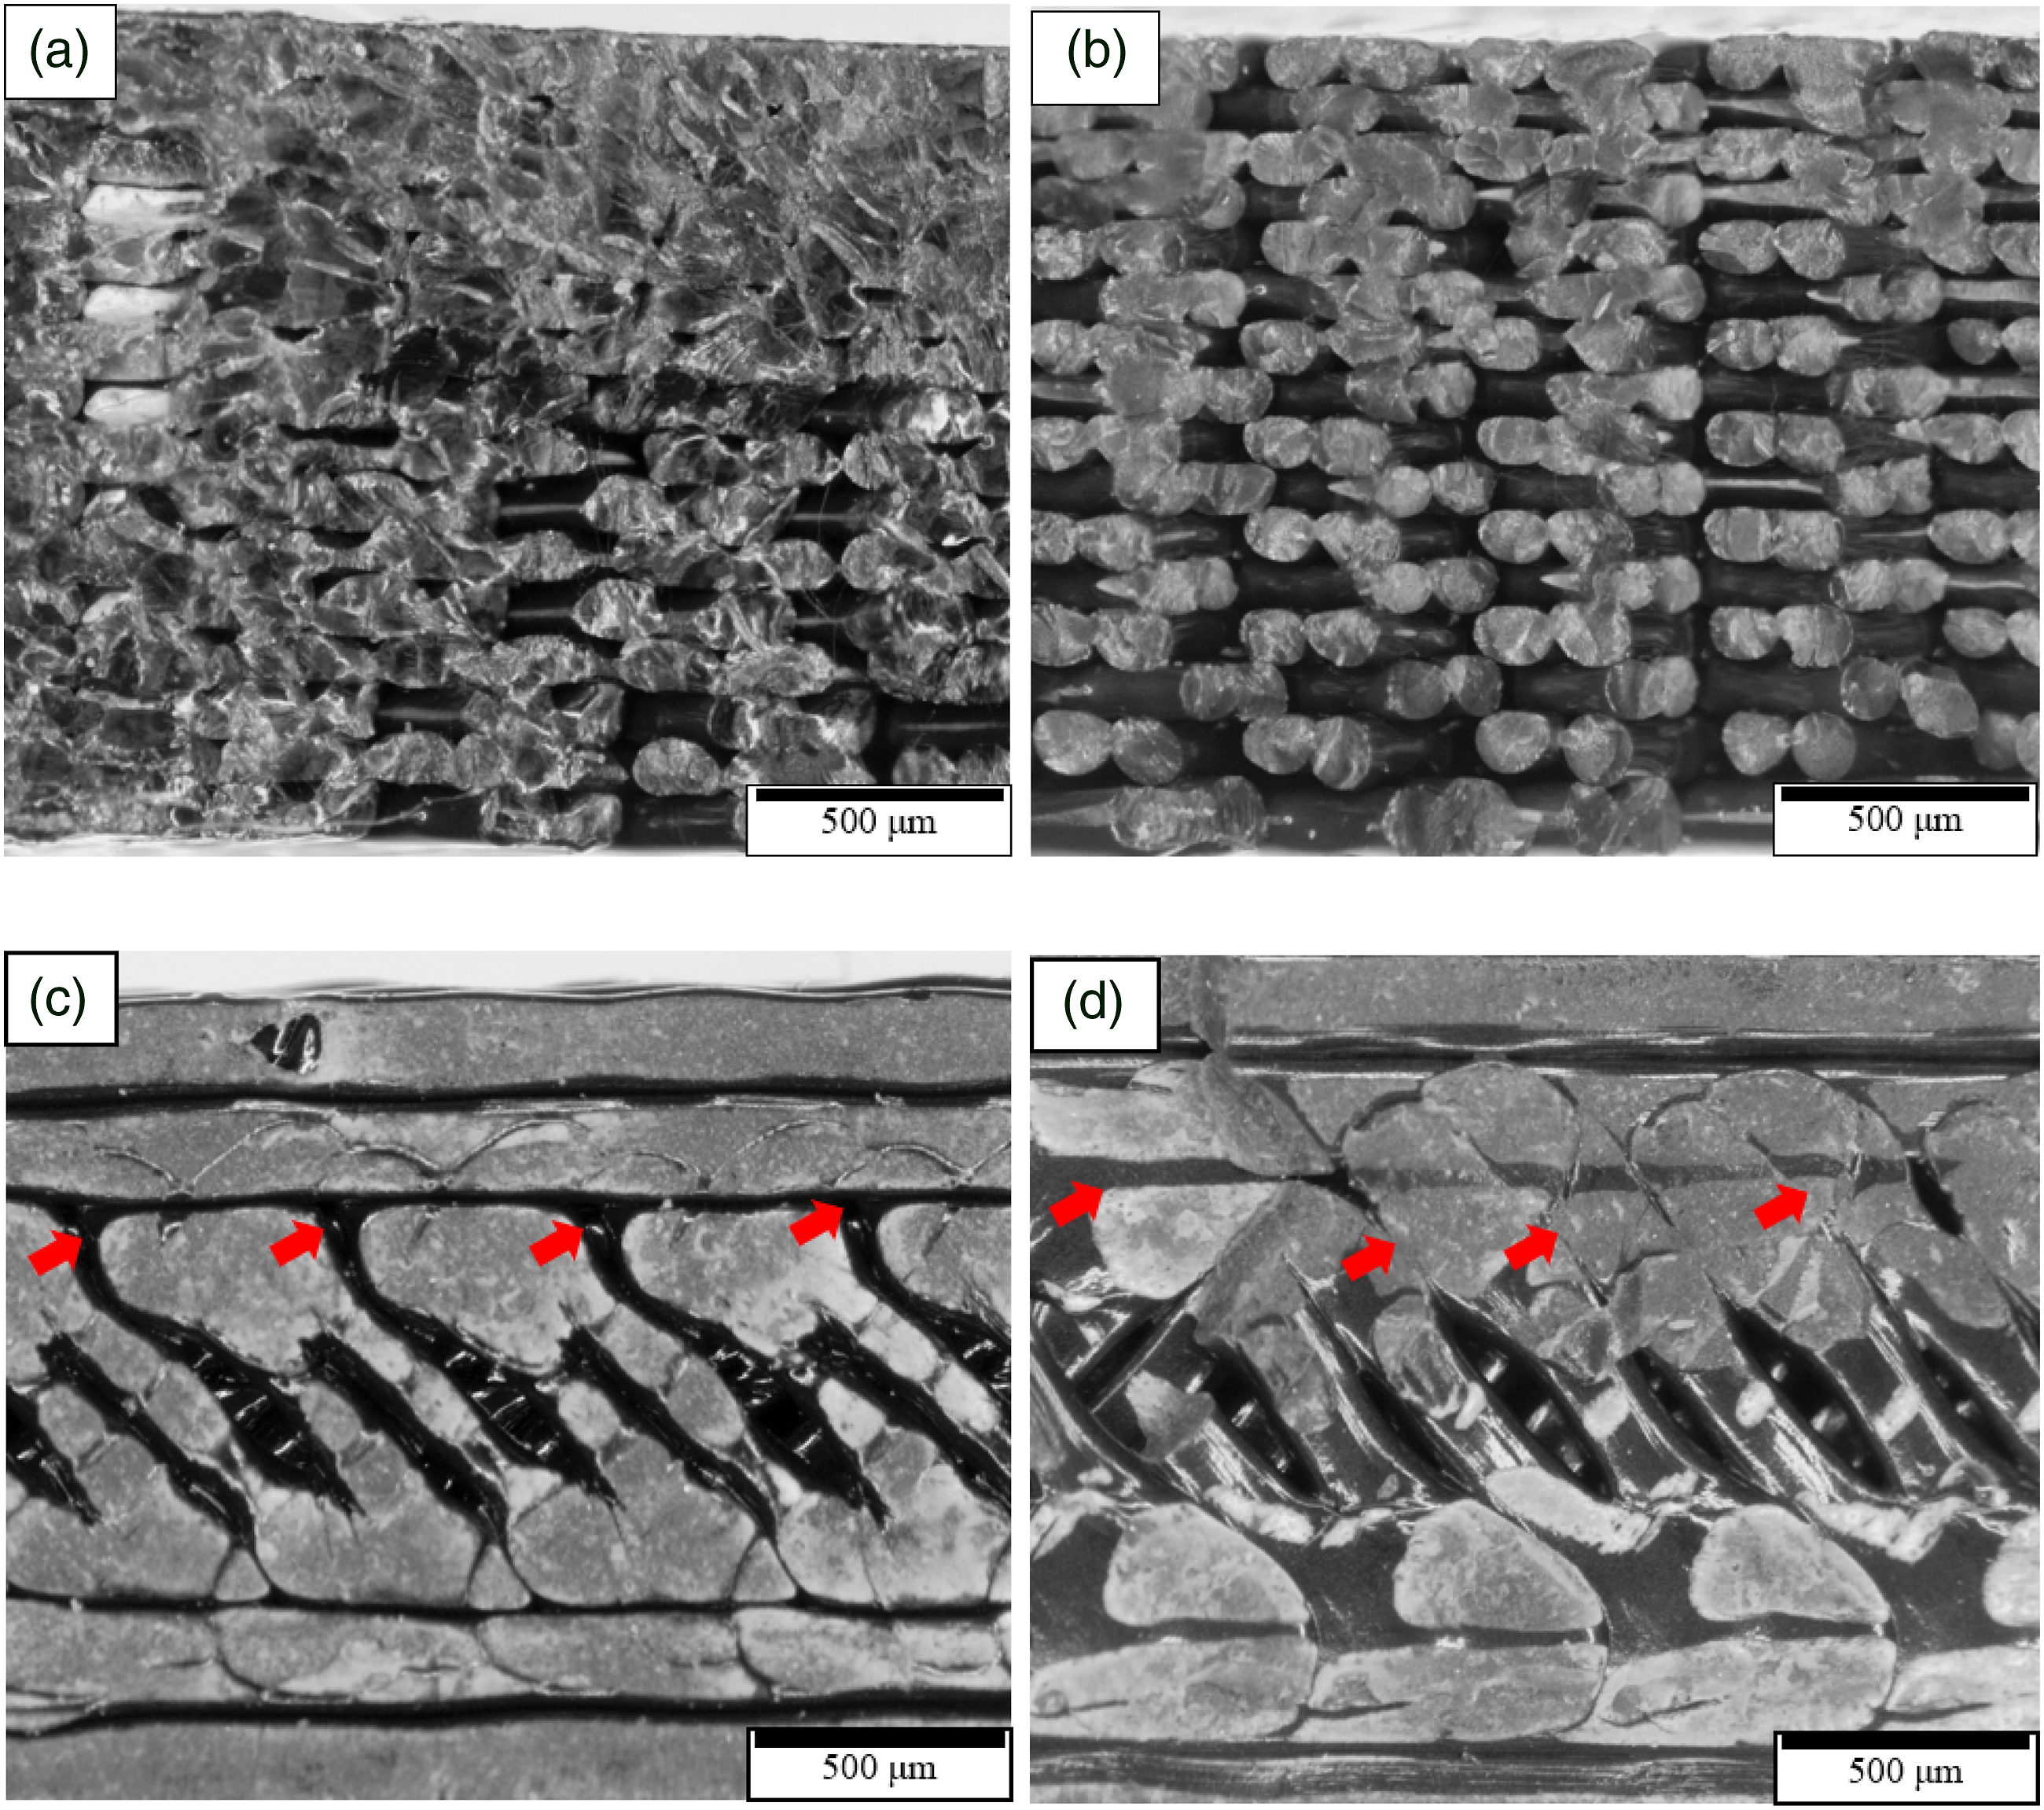
The longitudinal surfaces of dog-bones samples are shown in Figure 12. The surface of NHT-horizontal sample showed separation between the deposited layers as shown in the figure by rectangular boxes. These layers became attached after heating at 125°C as shown by arrows. The layers of dog-bone samples printed in vertical orientation has higher void content as indicated in the figure. After heating at 125°C, void content was reduced to 0.75% of the total surface area. The reduction in void content improved the mechanical properties. Optical microscope images showing the longitudinal surfaces of heat-treated and non-heat-treated horizontal and vertical dog-bone specimens after tensile testing. (a) NHT-horizontal, (b) HT125-horizontal, (c) NHT-vertical, and (d) HT125-vertical.
Uniaxial tensile test results
The uniaxial tensile test results of NHT and HT samples of twill fabrics and dog-bone specimens are presented in Figures 13 and 14, respectively. In case of twill fabrics, the statistical analysis shows that there is no significant difference in ultimate tensile strength with the increasing temperature in warp direction (p > 0.05), whereas it decreases at 100°C and 125°C in weft direction (p < 0.05). The ultimate tensile strengths for fabric in warp direction are 29.85 ± 4.05 MPa, 28.60 ± 4.20 MPa, 27.70 ± 2.90 MPa, 26.30 ± 1.95 MPa, 25.80 ± 1.85 MPa for NHT, HT50, HT75, HT100, and HT125 samples, respectively. Similarly, on applying Tukey–Kramer post hoc test on multiple comparisons, it was found that the stiffnesses of fabrics in warp direction are significantly different (p < 0.05) except for NHT-warp versus HT50-warp. The stiffness of HT100-warp samples is 651.15 ± 36.50 MPa and that of NHT-warp samples is 497.30 ± 50 MPa, which shows an increment of 31%, whereas the stiffness of HT125-warp samples is 578.07 ± 85.80 MPa, which shows an increment of 16.25%. The ultimate tensile strengths of the fabrics in weft direction are 15.70 ± 1.15 MPa, 16.65 ± 1.15 MPa, 14.08 ± 1.10 MPa, 7.73 ± 2.12 MPa, 12.54 ± 1.05 MPa for NHT, HT50, HT75, HT100, and HT125 samples, respectively. The tensile strength of HT125-weft samples is 20.13% less than that of NHT-weft samples. The stiffness of HT100-weft samples is 463.70 ± 69.60 MPa and that of NHT-weft samples is 539.30 ± 38.30 MPa, which shows a decrease of 14%, whereas the stiffness of HT125-weft samples is 431.65 ± 90.63 MPa, which shows a decrease of 20%. As a result of applying Tukey–Kramer post hoc test on multiple comparisons, it was found that the elongations at maximum load are significantly different in warp and weft directions for HT75 and HT100 samples as compared to NHT samples. The elongation at maximum load decreases from 17.90% ± 6.55% for NHT-warp samples to 10.64% ± 0.88% for HT75-warp samples and to 10.20% ± 2.03% for HT100-warp samples. Similarly, the elongations decrease from 4.30% ± 0.55% for NHT-weft samples to 2.92% ± 0.45% for HT75-weft samples and to 3.09% ± 0.72% for HT100-weft samples Uniaxial tensile test results of the fabrics: (a) Twill fabric in warp direction, (b) Twill fabric in weft direction, (c) Failure of HT125-warp sample, and (d) Failure of HT125-weft sample. Uniaxial tensile test results of DB samples: (a) Dog-bone specimen in horizontal orientation and (b) Dog-bone specimen in vertical orientation.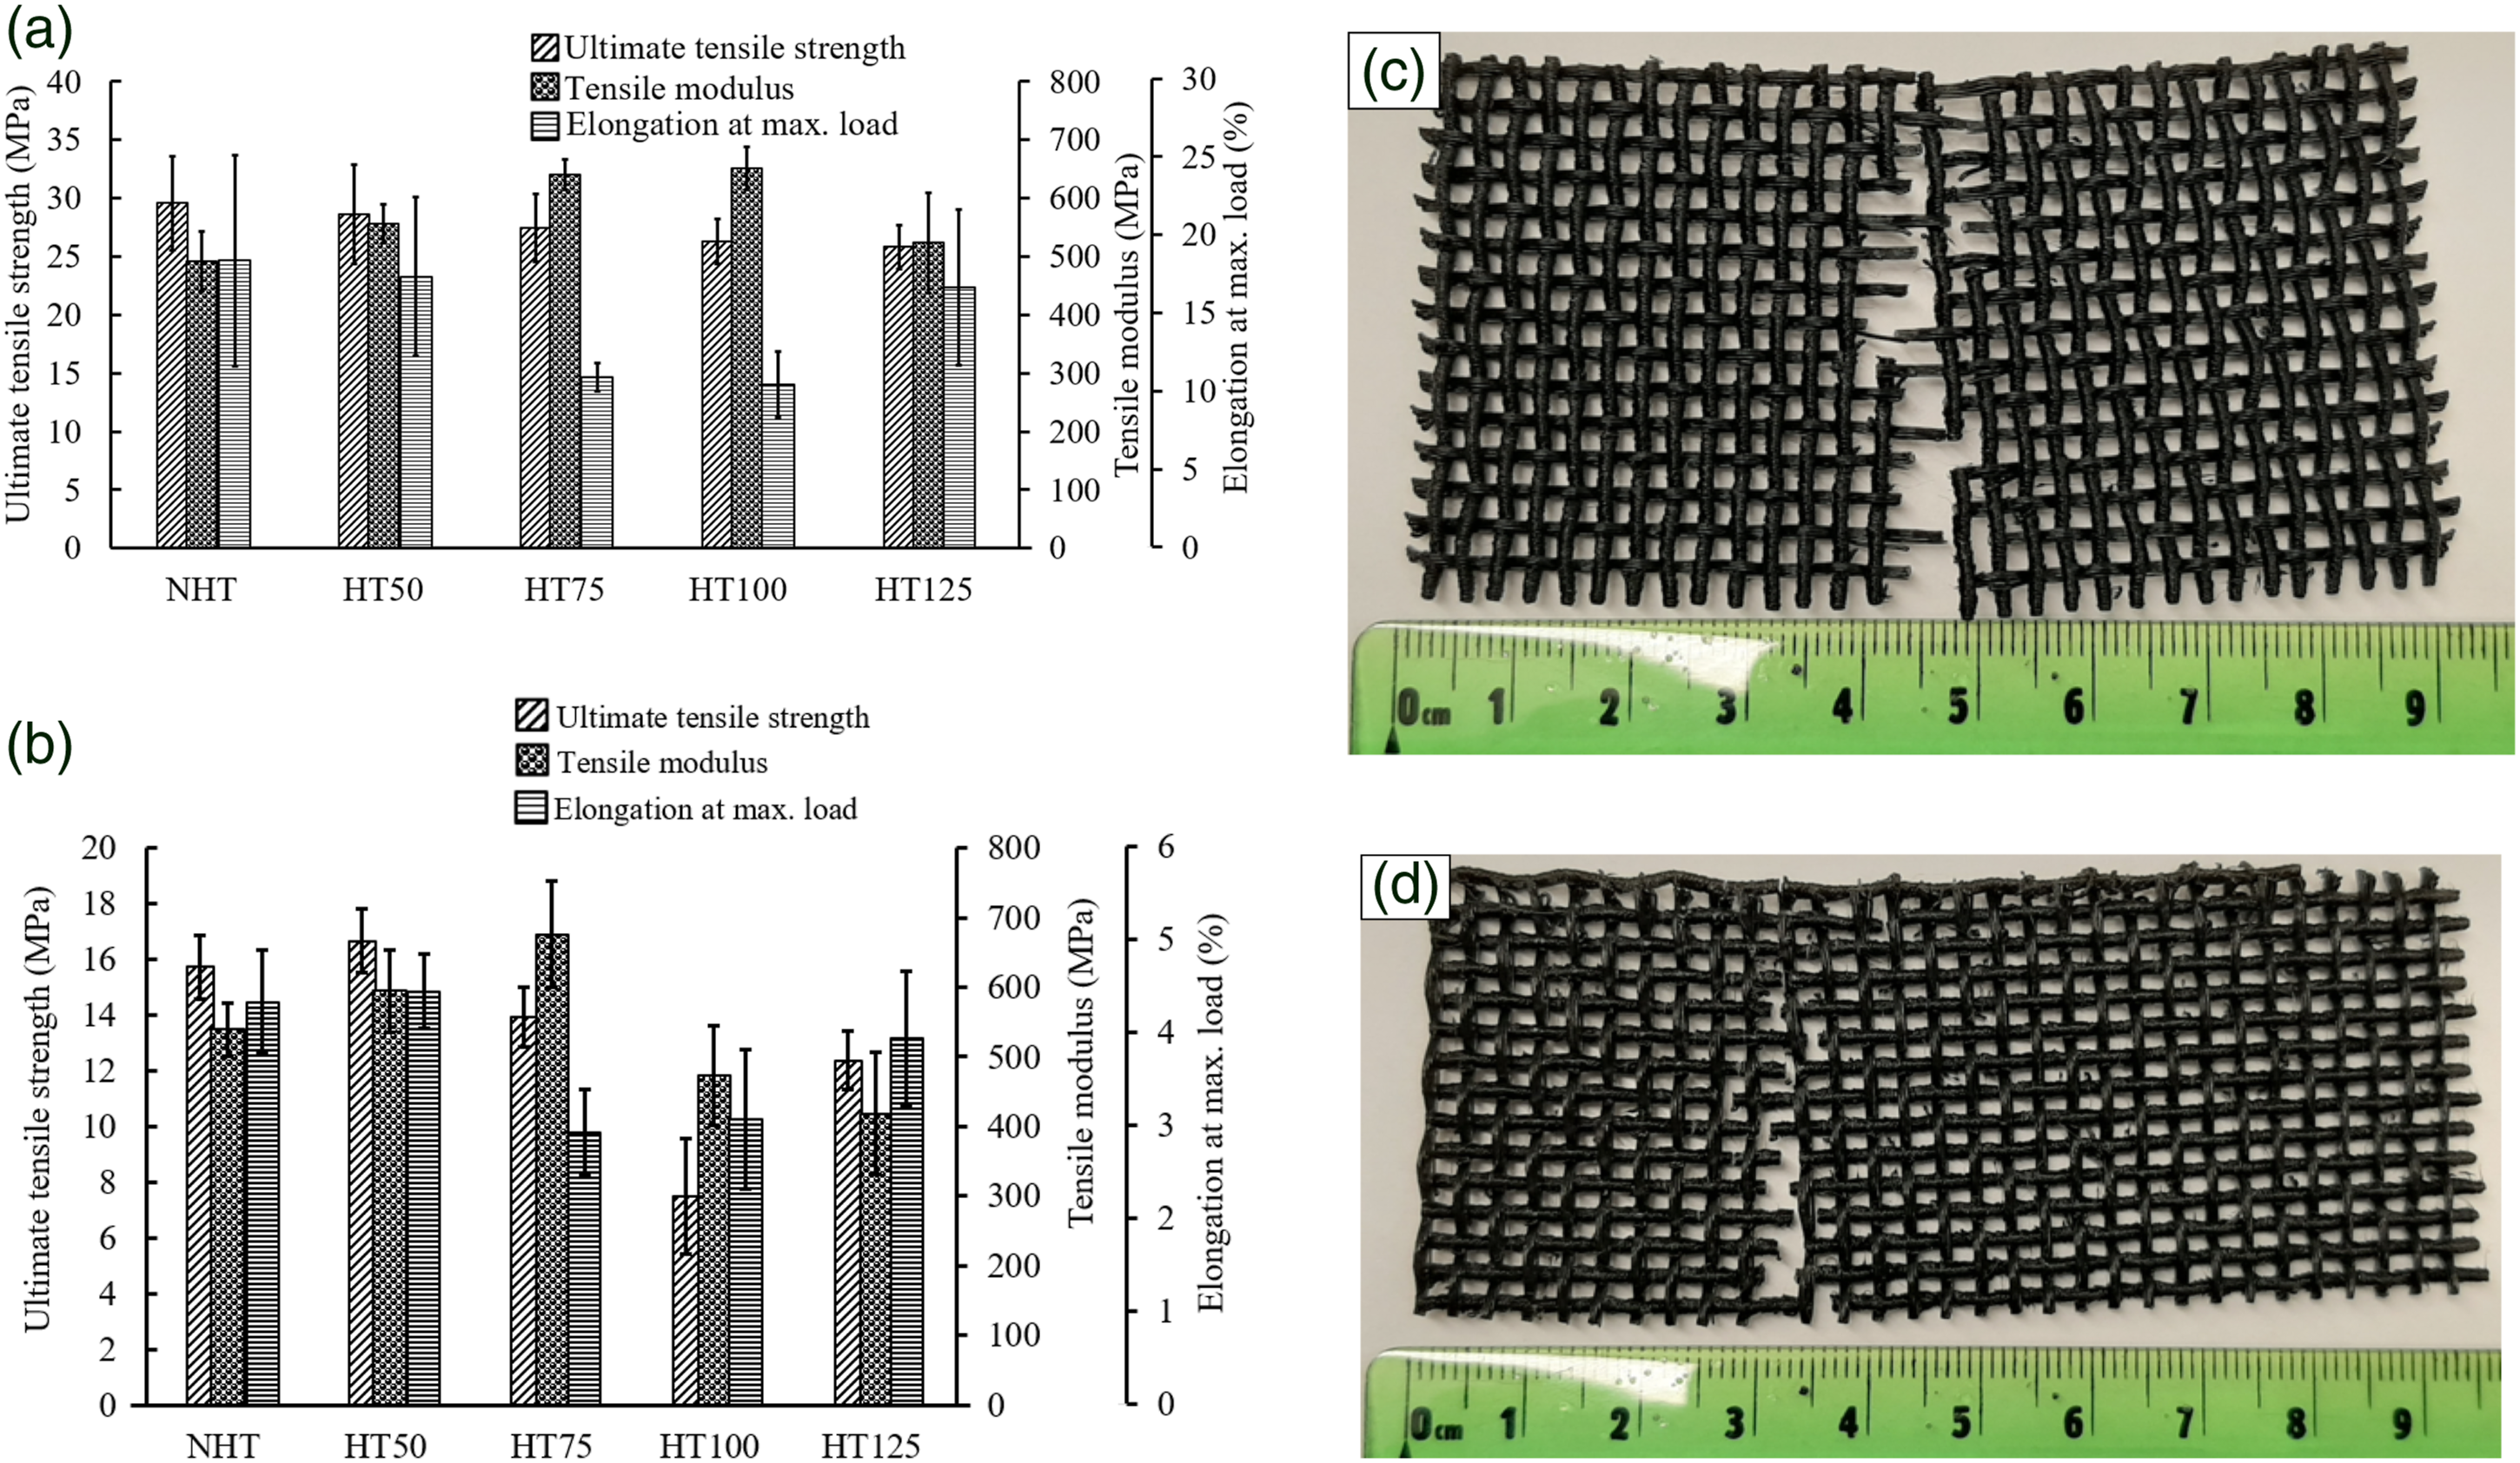

In this study, the improvement in fabric stiffness in warp direction, unchanged tensile strength in warp direction, and decrease in tensile strength and modulus in weft direction are observed. The mechanical properties of fabrics in warp direction are satisfactory since the fibers are continuous and aligned parallel to each other in warp direction. Although some separation between the fibers can be seen in the cross-section (shown in Figure 9(a) and (b)), all the fibers are grouped together providing the strength. As shown in Figure 10(a) and (b), the breakage of a fiber is visible; however, most of the fibers are still intact which tend to preserve the strength of the fabric. On the other hand, the fabric mechanical properties are not satisfactory in weft direction. This is because the weft yarns are formed by deposition of staple-like fibers on top of each other on the cross-section (as shown in Figure 10(c) and (d), which results in fibers being discontinuous along the weft direction. As stated earlier, a single deposited layer is broken multiple times as shown by dotted circles since the void content increased from 1.82% in non-heat-treated state to 6.78% of the total cross-sectional area in heat-treated state and the void content on the surface of weft yarns increased from 0.69% to 1.17% of the total surface area as a result of heat treatment. As a result, stress concentration increased at cross-over points during tensile loading making them easier to break.
After performing Tukey–Kramer post hoc test on multiple comparisons, the ultimate tensile strength increased for dog-bone samples heat-treated at 100°C and 125°C in both horizontal and vertical directions. The ultimate tensile strengths of dog-bone samples in horizontal direction are 37.80 ± 3.60 MPa, 40.30 ± 3.10 MPa, 40.30 ± 7.55 MPa, 45.20 ± 1.40 MPa and 47.70 ± 3.15 MPa for NHT, HT50, HT75, HT100, and HT125 samples, respectively. There is 20% and 26% increase in ultimate tensile strength after heat treatment at 100°C and 125°C, respectively. The ultimate tensile strengths of dog-bone samples in vertical directions are 22.75 ± 1.75 MPa, 23.05 ± 4.0 MPa, 25.05 ± 1.70 MPa, 26.60 ± 1.5 MPa and 28.0 ± 1.40 MPa for NHT, HT50, HT75, HT100, and HT125 samples, respectively. There is a 17% and 23% increase in ultimate tensile strength after heat treatment at 100°C and 125°C, respectively. This is because higher temperature might have made the polymer rubbery in nature, enhancing the polymer chain mobility and hence allowing the deposited layers to glue better with each other as shown in Figures 11 and 12. The stiffness also increased due to heat treatment in both directions at 100°C and 125°C. It increased from 1.49 ± 0.18 GPa for NHT-horizontal to 1.79 ± 0.03 GPa for HT100-horizontal samples (20% increment) and to 2.07 ± 0.41 GPa for HT125-horizontal samples (39% increment). In vertical orientation, the stiffness increased from 1.63 ± 0.07 GPa of NHT to 1.80 ± 0.05 GPa of HT100 samples (10% increment) and to 2.15 ± 0.07 GPa of HT125 samples (32% increment). The elongation at maximum load decreased for HT125-horizontal samples (30% less); however, there is no statistically significant difference in elongation for dog-bone samples 3D printed in vertical orientation. The thermal processing might have enhanced the polymer chain mobility and provided enough time to recrystallize which improved the crystallinity of polymer. In addition, it also provided an opportunity for reinfusion between the deposited layers and hence increased the bonding between the layers and rasters (Figures 11 and 12). As a result, improvement in mechanical properties has been observed.
Different behavior of 3D printed twill fabrics was observed after heat treatment in comparison with the dog-bone samples, which can be attributed to the yarns in the fabric structure having crimps. Stress concentration at cross-over points of fabrics plays a significant role in fabric failure, which causes them to break easier. In addition, deposited layers or fibers on the surfaces were broken which affected the mechanical strength.
Differential scanning calorimetry results
The DSC curves showing the first heating and cooling cycles of NHT and HT twill fabric and dog-bone specimens are presented in Figures 15 and 16 and the properties obtained from the tests are tabulated in Tables 2 and 3, respectively. The important phases such as glass transition ( DSC graphs of heat-treated (HT) and non-heat-treated (NHT) specimens: (a) Twill fabric in warp direction (b) Twill fabric in weft direction. DSC graphs of heat-treated (HT) and non-heat-treated (NHT) specimens: (a) Dog-bone specimen printed in horizontal orientation and (b) Dog-bone specimen printed in vertical orientation. DSC results of 2/1 PLA twill fabric samples obtained from the first heating cycle. Note: * sign indicates the disappearance of cold crystallization peak. For NHT and HT50 samples, the cold crystallization peak appears around 100°C and for HT75 samples, it is seen around 150°C whereas it vanishes when the samples are heat-treated at higher temperatures which proves that the specimens are more crystalline. DSC results of dog-bone specimens obtained from the first heating cycle. Note: * sign indicates the disappearance of cold crystallization peak. For NHT and HT50 samples, two cold crystallization peaks are seen, whereas it vanishes when the samples are heat-treated at higher temperatures which proves that the specimens are more crystalline.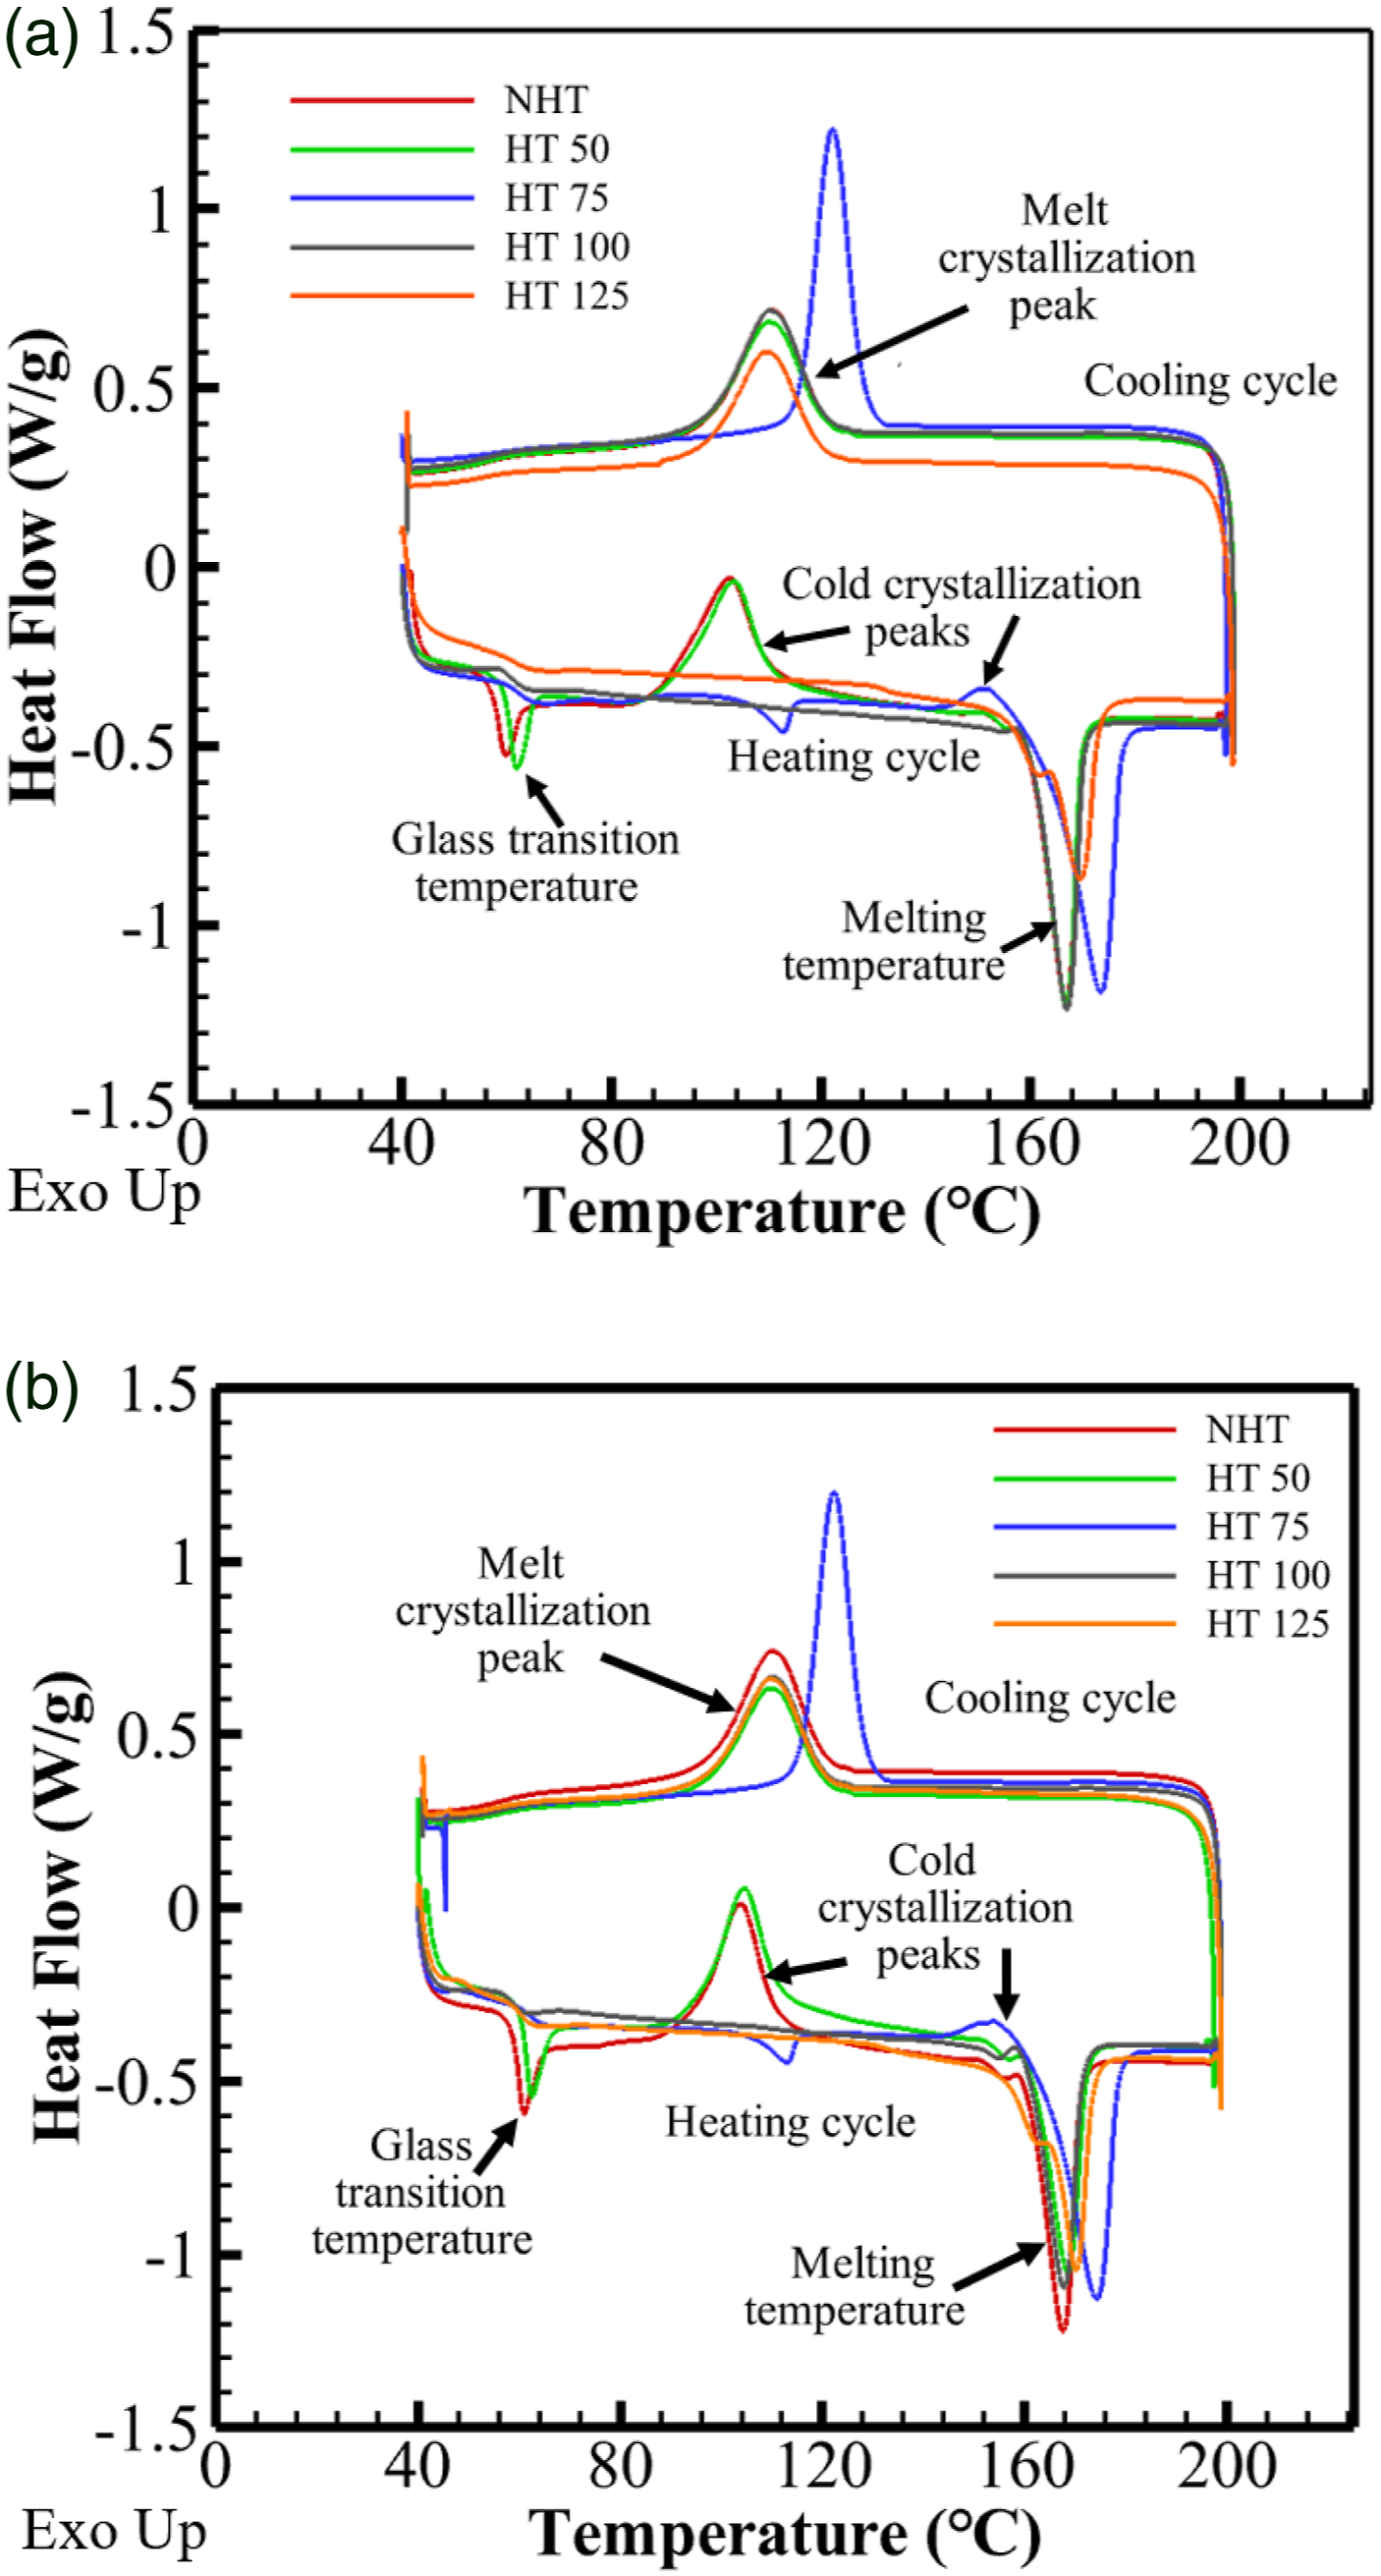


In case of twill fabrics, the cold crystallization point is observed only for NHT and HT50 samples at about 103°C. A peak of small area is observed for HT75 sample showing the cold crystallization temperature at 152°C and average enthalpy of 4.4 J/g in both directions. Since the NHT and HT50 samples are below
In case of dog-bone specimens, two cold crystallization peaks are seen at about 85°C and 153°C for NHT-horizontal and HT50-horizontal samples, similar to observations in ref. 29 , whereas these peaks appear at 103°C and at 152°C for NHT-vertical and HT50-vertical samples. This type of cold crystallization is caused by rapid cooling of the melt during the extrusion process. Similar to the fabric samples, the heat-treated dog-bone samples show a cold crystallization peak having enthalpy of about 5 J/g at 154°C for HT75-horizontal samples and at 144°C for HT75-vertical samples. Again, the crystallization is improved with increasing temperatures, caused by better mobility of polymer chains.
During the first heating cycle, HT125-warp and HT125-weft samples exhibited two endothermic melting peaks at ∼160°C and ∼170°C, similar to observations in ref,
30
which has been formed due to the presence of multiple crystalline states (
The factors such as spatial confinement, nucleation on sample boundaries, temperature gradient, and melt flow play a vital role in crystallization of polymers.
33
Similarly, the addition of foreign substances in the pure PLA matrix affects the crystallization of PLA either by assisting or hindering the chain mobility.
34
The PLA filament used in this study has a crystallinity of 14.74%,
The crystallinity percentage of NHT-horizontal dog-bone specimen is 11%, which indicates more amorphous and less crystalline behavior. The NHT-vertical specimen has a lower crystallinity, about 4% because of fast extrusion over adjacent layers and rapid cooling. With the increasing temperature, the crystallinity increases until 125°C, with the maximum values of 38.28% and 28.96% in horizontal and vertical orientations, respectively. Higher temperature might have assisted in recrystallization.
The lower crystallinity in non-heat-treated samples might have happened due to melting, and extrusion through nozzle at higher temperature and rapid cooling of the polymer during 3D printing. During 3D printing, a high-temperature difference between nozzle and print-bed occurs that provides a short period of time to crystallize which results in lower crystallinity.
Relationship between crystallinity and mechanical strength
Figure 17 shows the effect of crystallinity on mechanical properties of the samples. As shown in the figure, the crystallinity increases slightly at 50°C, which indicates that the crystallinity can increase due to thermal processing after 3D printing. Further heat treatment at 75°C, 100°C, and 125°C increased the average value of crystallinity to 28%, 30%, and 31%, respectively. This improvement might have happened due to better chain mobility of polymers and enough time for crystallization. There is no significant difference between the modulus for NHT-warp and HT50-warp samples; however, a significant improvement in modulus can be observed for HT75-warp, HT100-warp, and HT125-warp samples. The stiffness was increased by 29%, 31%, and 16% after heat treatment at 75°C, 100°C, and 125°C, respectively. This shows that increase in crystallinity might have increased the stiffness of the structure. However, the ultimate tensile strength remains statistically insignificant in warp direction. The stiffnesses of fabrics in weft direction decreased by 14% at 100°C and 20% at 125°C. Likewise, the strength also decreased by 50%, and 20% at 100°C, and 125°C, respectively. Relationship between crystallinity and mechanical properties of 3D printed parts using PLA for heat-treated (HT) and non-heat-treated (NHT) samples: (a) Twill fabric in warp direction and (b) Twill fabric in weft direction.
It has been reported that increase in crystallinity should increase tensile strength and stiffness of the PLA material.22,23,35 However, in this study, improvement in stiffness for fabrics in warp directions, unaffected tensile strength in warp direction, and decrease in strength and modulus in weft direction have been observed. This may have happened due to the interlacing nature of the fabrics made of brittle materials like PLA, which develops stress concentration making them easier to break at the cross-over points of yarns. Also, the slower cooling method could have caused shrinkage distortion leading to internal defects and residual stress affecting the mechanical strength of 3D printed PLA fabric samples. 11
Figure 18 shows the relationship between crystallinity and mechanical properties of HT and NHT DB samples. The thermal processing lower than glass transition temperature did not have significant effect on crystallinity. However, heat treatment at 75°C, 100°C, and 125°C caused an improvement up to 32%, 34%, and 38% for HT75-horizontal, HT100-horizontal, and HT125-horizontal samples, respectively, and up to 27%, 28%, and 29% for HT75-vertical, HT100-vertical, and HT125-vertical samples, respectively. The ultimate tensile strength increased for dog-bone samples heat-treated at 100°C and 125°C in both horizontal and vertical directions. It increased by 20% and 26% for HT100-horizontal and HT125-horizontal samples, respectively. Similarly, in vertical direction, it is improved by 17% and 23% after heat treatment at 100°C and 125°C, respectively. The stiffness also increased due to heat treatment in both directions at 100°C and 125°C. It increased by 20% for HT100-horizontal samples and by 39% for HT125-horizontal samples. In vertical orientation, the stiffness increased by 10% at 100°C, and by 32% at 125°C. Relationship between crystallinity and mechanical properties of 3D printed parts using PLA for heat-treated (HT) and non-heat-treated (NHT) samples: (a) Dog-bone specimen in horizontal orientation and (b) Dog-bone specimen in vertical orientation.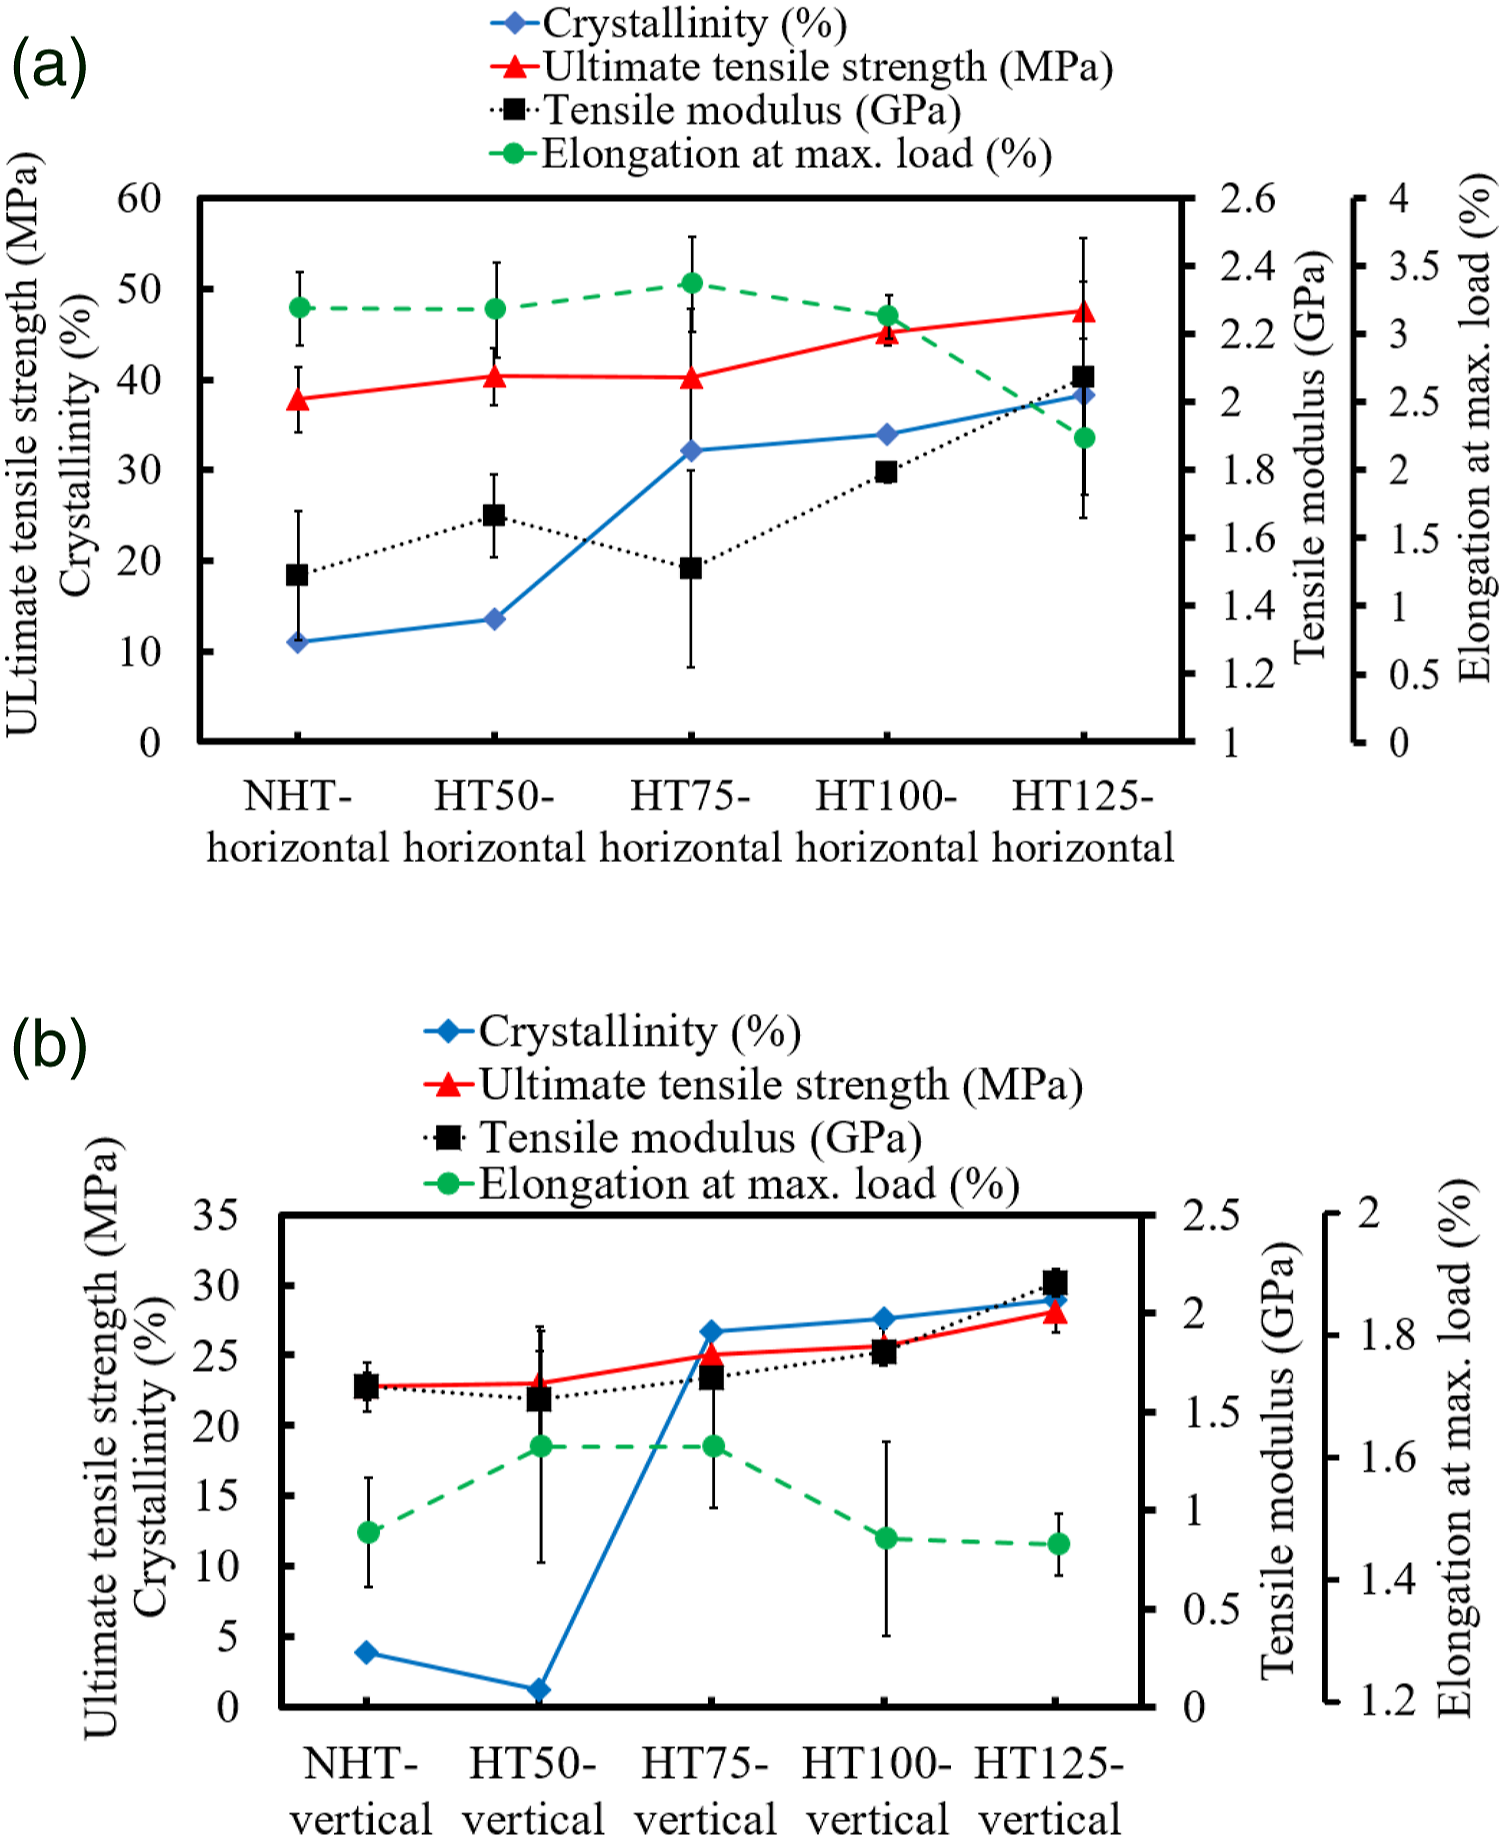
From this analysis, it can be concluded that heat treatment increases the crystallinity of samples and also improves the mechanical properties in comparison with the NHT samples. Hence, a direct relationship between crystallinity and mechanical properties (e.g., modulus and ultimate tensile strength) can be established for a standard sample but may not be true for non-standard samples such as woven fabrics. Heat treatment method enhanced the polymer chain mobility and provided enough time to recrystallize which improved polymer crystallinity. At the same time, it also provided an opportunity for reinfusing between the deposited layers and hence increased the bonding between the layers and rasters. As a result, an improvement in mechanical properties has been observed.
Conclusions
This study contributes to the research work related to wearable 3D printed fabrics. 2/1 twill fabric structures were designed, and 3D printed using FDM technology. As a post-processing method to improve the mechanical performance, heat treatment at different temperatures for 1 h was adopted. This research investigated the effects of heat treatment on mechanical properties and crystallinity for 3D printed samples. The following conclusions can be drawn from this work: • The tensile test results showed that the mechanical properties of 3D printed samples depend on heat treatment at various temperatures and the geometry of the structure. This method improved fabric stiffness in warp direction; however, the difference in ultimate tensile strength in warp direction is statistically insignificant. Unlike warp direction, both the strength and stiffness decreased in weft direction after heat treatment. However, the tensile strength and stiffness were improved for dog-bone samples 3D printed in both horizontal and vertical directions. • The crystallinity of all the studied samples increased when heated above the glass transition temperature. This might have happened due to increased polymeric chain mobility and sufficient time to recrystallize, which lacks during 3D printing. During 3D printing, there is significant difference in nozzle and bed temperature and less time to crystallize resulting in lower crystallinity. • Although the crystallinity increased for fabric samples, a significant improvement in mechanical properties was not noted. The interlacing nature of the fabrics may be the reason behind it, which develops stress concentration at cross-over points, causing breakage of deposited layers. This research shows that relationships between crystallinity and mechanical properties may not be established readily for non-standard 3D printed fabric samples. In case of dog-bone samples, the mechanical properties improved with increasing polymer crystallinity. This indicates that a direct relationship between crystallinity and mechanical properties can be established for an ASTM standard dog-bone samples.
This research presents results for 3D printing of 2/1 twill weave fabrics and dog-bone samples. 2/1 twill design is more complicated than the plain weave design which was the subject of our earlier work (Ref. 4). Other types of fabric designs such as basket, satin, and knitted structures will be studied in future work. Various other polymers and polymer composites can be used for 3D printing of fabrics to achieve improved fabric properties such as tear resistance, flexibility, smoothness, and mechanical strength. The effects of various heat treatment times will be the subject of future work.
Footnotes
Declaration of conflicting interests
The author(s) declared no potential conflicts of interest with respect to the research, authorship, and/ or publication of this article.
Funding
The author(s) disclosed receipt of the following financial support for the research, authorship, and/or publication of this article: This research was supported by the Mechanical Engineering Department at Auburn University.