
Abstract
The building industry is now evolving in a rapid pace due to the massive need to build and rebuild the cities. While designing the building, the owner appreciates the esthetic aspects, whereas the contractor is more interested in a performance-based approach for its construction. The current study investigates the integration of industrial textiles in buildings. For that, life spawn estimation of textile materials is crucial due to the different existing French regulations that set a minimum durability criterion. The paper presents a methodology for lifetime estimation and an application to two fabrics intended for use as facing materials for buildings. A series of aging tests were carried out and extrapolations were made to reach the research goal. The results of tests that were carried out indicate the feasibility of the textiles’ lifetime estimation methodology used.
Keywords
Introduction
Technical textiles are textile materials and products manufactured primarily for their technical and performance properties rather than their aesthetic or decorative characteristics [1]. With an annual growth rate of 5–7%, technical textile industry continues to expand, offering new opportunities and challenges to existing businesses and underpinning for innovation in many other fields [2].
Technical textiles fabrication appears less like a particular industry than an extension and a diversification of traditional textile sector. This diversification was born in the beginning of last century with the progress of science and the emergence of new generations of textile fibers; it has accelerated considerably in the second half of the 20th century. Technical Textiles are the result of various innovations in materials, manufactured processes and products [3].
As shown in Figure 1, the construction industry is the fourth sector that uses technical textiles after transport, industry and sport.
Global consumption of technical textiles by areas of applications [4].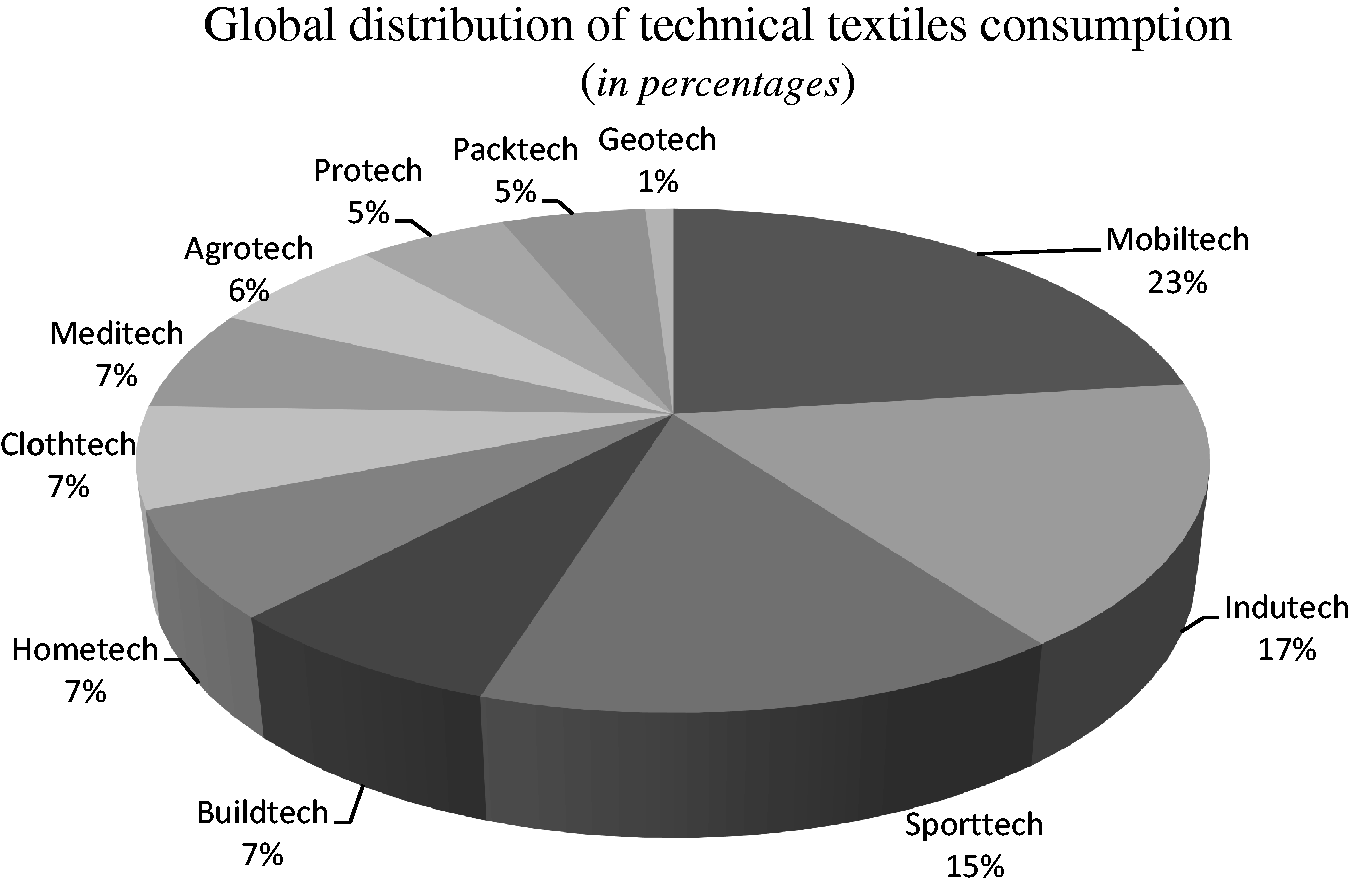
Massive use of technical textiles implies a need of measuring its lifetime. From an economic point of view, there is a need of lifetime guarantee. Indeed, in last decades there is a growing need for companies to reduce maintenance costs. For this reason, it is important to know the lifetime of products. In the context of this study, technical textiles are investigated in the building industry as a façade protection material. To assure competitiveness, the textile should provide a good performance of the façade cladding for a certain period of time. It is called the year guarantee. Therefore, it is compulsory to assess the textile’s lifetime.
The product footprint determination and its life cycle assessment are also important with the advent of new environmental requirements. This assessment implies knowing the lifespan. The latter is an unknown parameter in the design phase. In an attempt to have an approximate idea about its value, lifetime estimation process is conducted during this study.
Technical textiles concerned with this study are polymer-based materials. Polymer aging is a slow process. Therefore, it is necessary to perform an accelerated aging in laboratory conditions. An accelerated aging protocol was designed in a previous study [5]. The main result obtained from this study is that the studied textiles were more sensitive to basic medium than neutral or acidic mediums for a temperature of 70℃.
The objective of lifetime estimation process is to have a good accuracy for the extrapolated lifetime in the temperature of use. Arrhenius relation is widely used for lifetime extrapolation of polymer in aqueous environment [6–8]. Arrhenius method needs at least three values of aging temperatures. For the studied textiles, Arrhenius extrapolation is used to predict the value of a given functional parameter. The parameters concerned by this study are:
– Tensile strength – Young’s modulus – Resistance to nail tear and – Weight loss.
The previous study conducted [5] looked at the evolution of mechanical and physical properties (tensile strength, Young’s modulus, resistance to nail tear and weight loss) at 70℃ in a basic medium with a pH value of 13.5. This research completes the previous study by performing accelerated aging tests in two other temperatures 50℃ and 60℃ with the same pH value fixed at 13.5 in order to use Arrhenius extrapolation method for lifetime prediction. Weight loss, tensile strength, Young’s modulus and resistance to nail tear were monitored. Then, lifetime of textile samples immersed in basic medium was estimated for the temperature of use in real conditions. Finally, the validity of the approach is discussed.
Material and methods
Presentation of the studied materials
Two materials were tested during this study. Both have a common basic structure which is the Sunworker. The latter is a woven polyester fabric coated with polyvinyl chloride (PVC). In fact, the woven polyester was dipped into a PVC bath, which solidified around the polyester fibers.
– For the first studied fabric, mentioned as PTFE ‘P’, the Sunworker is protected with a thin film of polytetrafluoroethylene PTFE which will be later mentioned as “membrane”. – For the second studied fabric, mentioned as Opaque ‘O’, the Sunworker is covered with a second layer of PVC.
Aging protocol
Hydrolysis seems to be an efficient way to deteriorate polymeric materials. Hydrolysis in neutral–acid and in basic medium on geotextiles and fiber [5,9–11] reveals that PET is more sensitive to basic solutions.
Glass transition and melting temperatures for PVC–PET–PTFE.

Aging protocol (temperature – pH and time).

pH selection
Hydrolysis in a basic medium is a degrading reaction for PET materials. Literature [12,13,16] reveals that in a medium with pH more than 12, mechanical properties dropped within a very short period of time.
The same references do not recommend the use of PET geotextiles in highly basic medium (pH > 12). In the context of this study, the objective is to degrade materials as quickly as possible, thus the choice of a high level of pH = 13.5.
The basic solution used for aging is obtained from NaOH dissolution in water. This choice is based on bibliography [17,18]. Ca(OH)2 solution could be used, but Halse et al. [12,13] demonstrated that this solution leaves a deposit on materials that influences the results.
Hydrolysis kinetics, even in a basic medium, is considered to be low in the laboratory time scale. For this reason, the temperature is increased to catalyze the hydrolysis kinetics to have an obvious ageing.
Temperature selection
Daty et al. [19] affirmed that there is a discontinuity between properties in either side of glass transition temperature Tg (Table 1 summarizes the glass transition and melting temperatures for PVC-PET-PTFE). It is risky to use results obtained for high level of temperature especially when it exceeds the glass transition temperature. Previous studies [10,17,18] executed on geotextiles and PET fibers used aging temperature within the range of 45–80℃.
Aging conditions are summarized in Table 2. Samples are submerged in a basic solution with a pH of 13.5. The samples with the solution are put in a stove at three different temperatures 50℃, 60℃ and 70℃ for an aging period from 35 days to 60 days.
Indicators and experimental techniques
Measurable properties, representative of use functions, are identified. These indicators are used to monitor the ageing for the treatment period. The ageing process monitoring allows to have at the same time the degradation state and its evolution speed.
Studied textiles are planned to be used in traction for façade cladding to protect against the weather conditions. Mechanical analysis is suitable for these materials. This approach is simple and widespread [9,17–20].
Mechanical resistance
Mechanical properties are investigated through tensile strength and nail tear tests. For the tensile strength test, the applied breaking force and Young’s modulus were monitored. The maximal applied force to tear the sample was also monitored using the nail tear test.
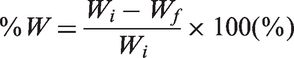
Result exploitation is based on the residual strength’s representation according to time. Residual strength expresses the force that samples can still provide. The residual strength is expressed by equation (1)

Fi is the initial strength; Ff is aged sample strength; and Rd is residual strength (
The experimental techniques used for this study are the following:
Tensile test
Textiles are tested according to the standard NF EN 12311-1 [21] with a MTS Insight 10 kN machine with a speed of 100 mm/min. Sample dimensions are 300 × 50 mm2. Samples are submerged in a basic solution for the ageing period. At the end of ageing, samples are removed from the solution and conditioned in the laboratory atmosphere (25 ± 5℃/RH between 30% and 70%). The aged samples are tested with the tensile machine until breaking. The values of strength and elongation are recorded and plotted.
Young’s modulus
Young Modulus is calculated using tensile test curves. Young’s modulus allows comparing the stiffness. For instance, if two materials are considered at the same load and E1 <E2, material 1 will be more deformed than 2 which means that 2 is stiffer than 1 (this is valid in the elastic zone). This parameter provides information about long-term resistance.
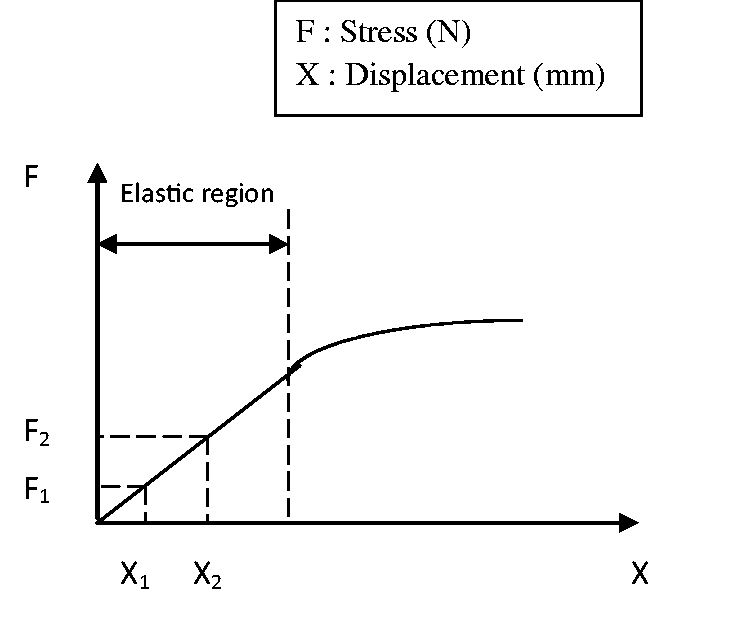
Young’s modulus was calculated for elongation in the first linear zone of tensile test curves. Figure 2 and equation (2) describe the method of Young’s modulus calculation.
Young's modulus calculation.
Resistance to nail tear
200 × 100 mm2 samples are aged in basic medium before being conditioned in the laboratory atmosphere. Aged samples are tested according to the standard NF EN 12310-1 [22]. This test estimates the necessary strength to tear a specimen held by a nail by applying a perpendicular tensile strength.
Physical properties using weight loss
To monitor weight loss, samples intended for mechanical tests were weighed before and after aging and conditioning. The weight is monitored in order to represent the degradation, not the uptaking of water. This is why samples were conditioned for 48 h in laboratory conditions. Specimens were removed from the basic solution and conditioned in laboratory conditions to dry. Then they were weighed at room temperature (25 ± 5℃ and RH between 30% and 70% on a balance with a precision of 10 mg. The percentage of weight loss is determined by equation (3)
Extrapolation method
Arrhenius law
To exploit experimental results, an Arrhenius law-based method was used. The latter is widely used to determine the lifetime of materials aged in hydrolysis conditions [6,8,17,23,24]. The method needs more than two temperatures input value to produce exploitable results. In bibliography, the number of inlet temperature is usually three. In a previous study [5], tests were conducted at 70℃. To use the extrapolation method, two temperatures are needed to complete the study. Regarding values of Glass transition temperature for our materials (Table 1), the aging temperature should not exceed 70℃. In this paper, the aging is executed at 50℃ and 60℃ and completed with results obtained at 70℃.
Hydrolysis is an Arrhenian character reaction. The use of this method allows lifetime estimation. The Arrhenius method has been used in a number of studies [7,8,12,17] on polymeric materials degradation. Nevertheless, the validity of this model in the case of technical textiles needs to be proved. If it can be shown to be valid, the Arrhenius extrapolation could be used to predict the value of a given functional parameter (strength–strain …) for lower temperatures and longer period of time.
The first step for lifetime estimation is to represent the evolution of material properties, designed in this paper as indicators, according to time. These representations should be realized for at least three temperatures. The second step is to determine the mechanical properties evolution speed. The determination of mechanical properties loss is based on the results obtained at aging temperatures; this allows getting a relation between the degradation speed and temperature. It was demonstrated that mechanical properties loss is correlated to the reaction rate [14,15,17]. This correlation constitutes the proof that the degradation speed follows an Arrhenius law. In this study, the degradation speed is determined for each aging temperature with the purpose of extrapolating the aging values to the temperature of use.
Considering that hydrolysis reaction obeys to Arrhenius law, the degradation speed of indicators is given by the following equation (4)
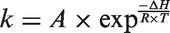
To facilitate the manipulation of this equation, degradation speed logarithm is plotted as a function of the inverse of temperature. It then becomes (5)

Results and discussion
The research steps could be summed up according to Figure 3:
Research inputs, output and phases.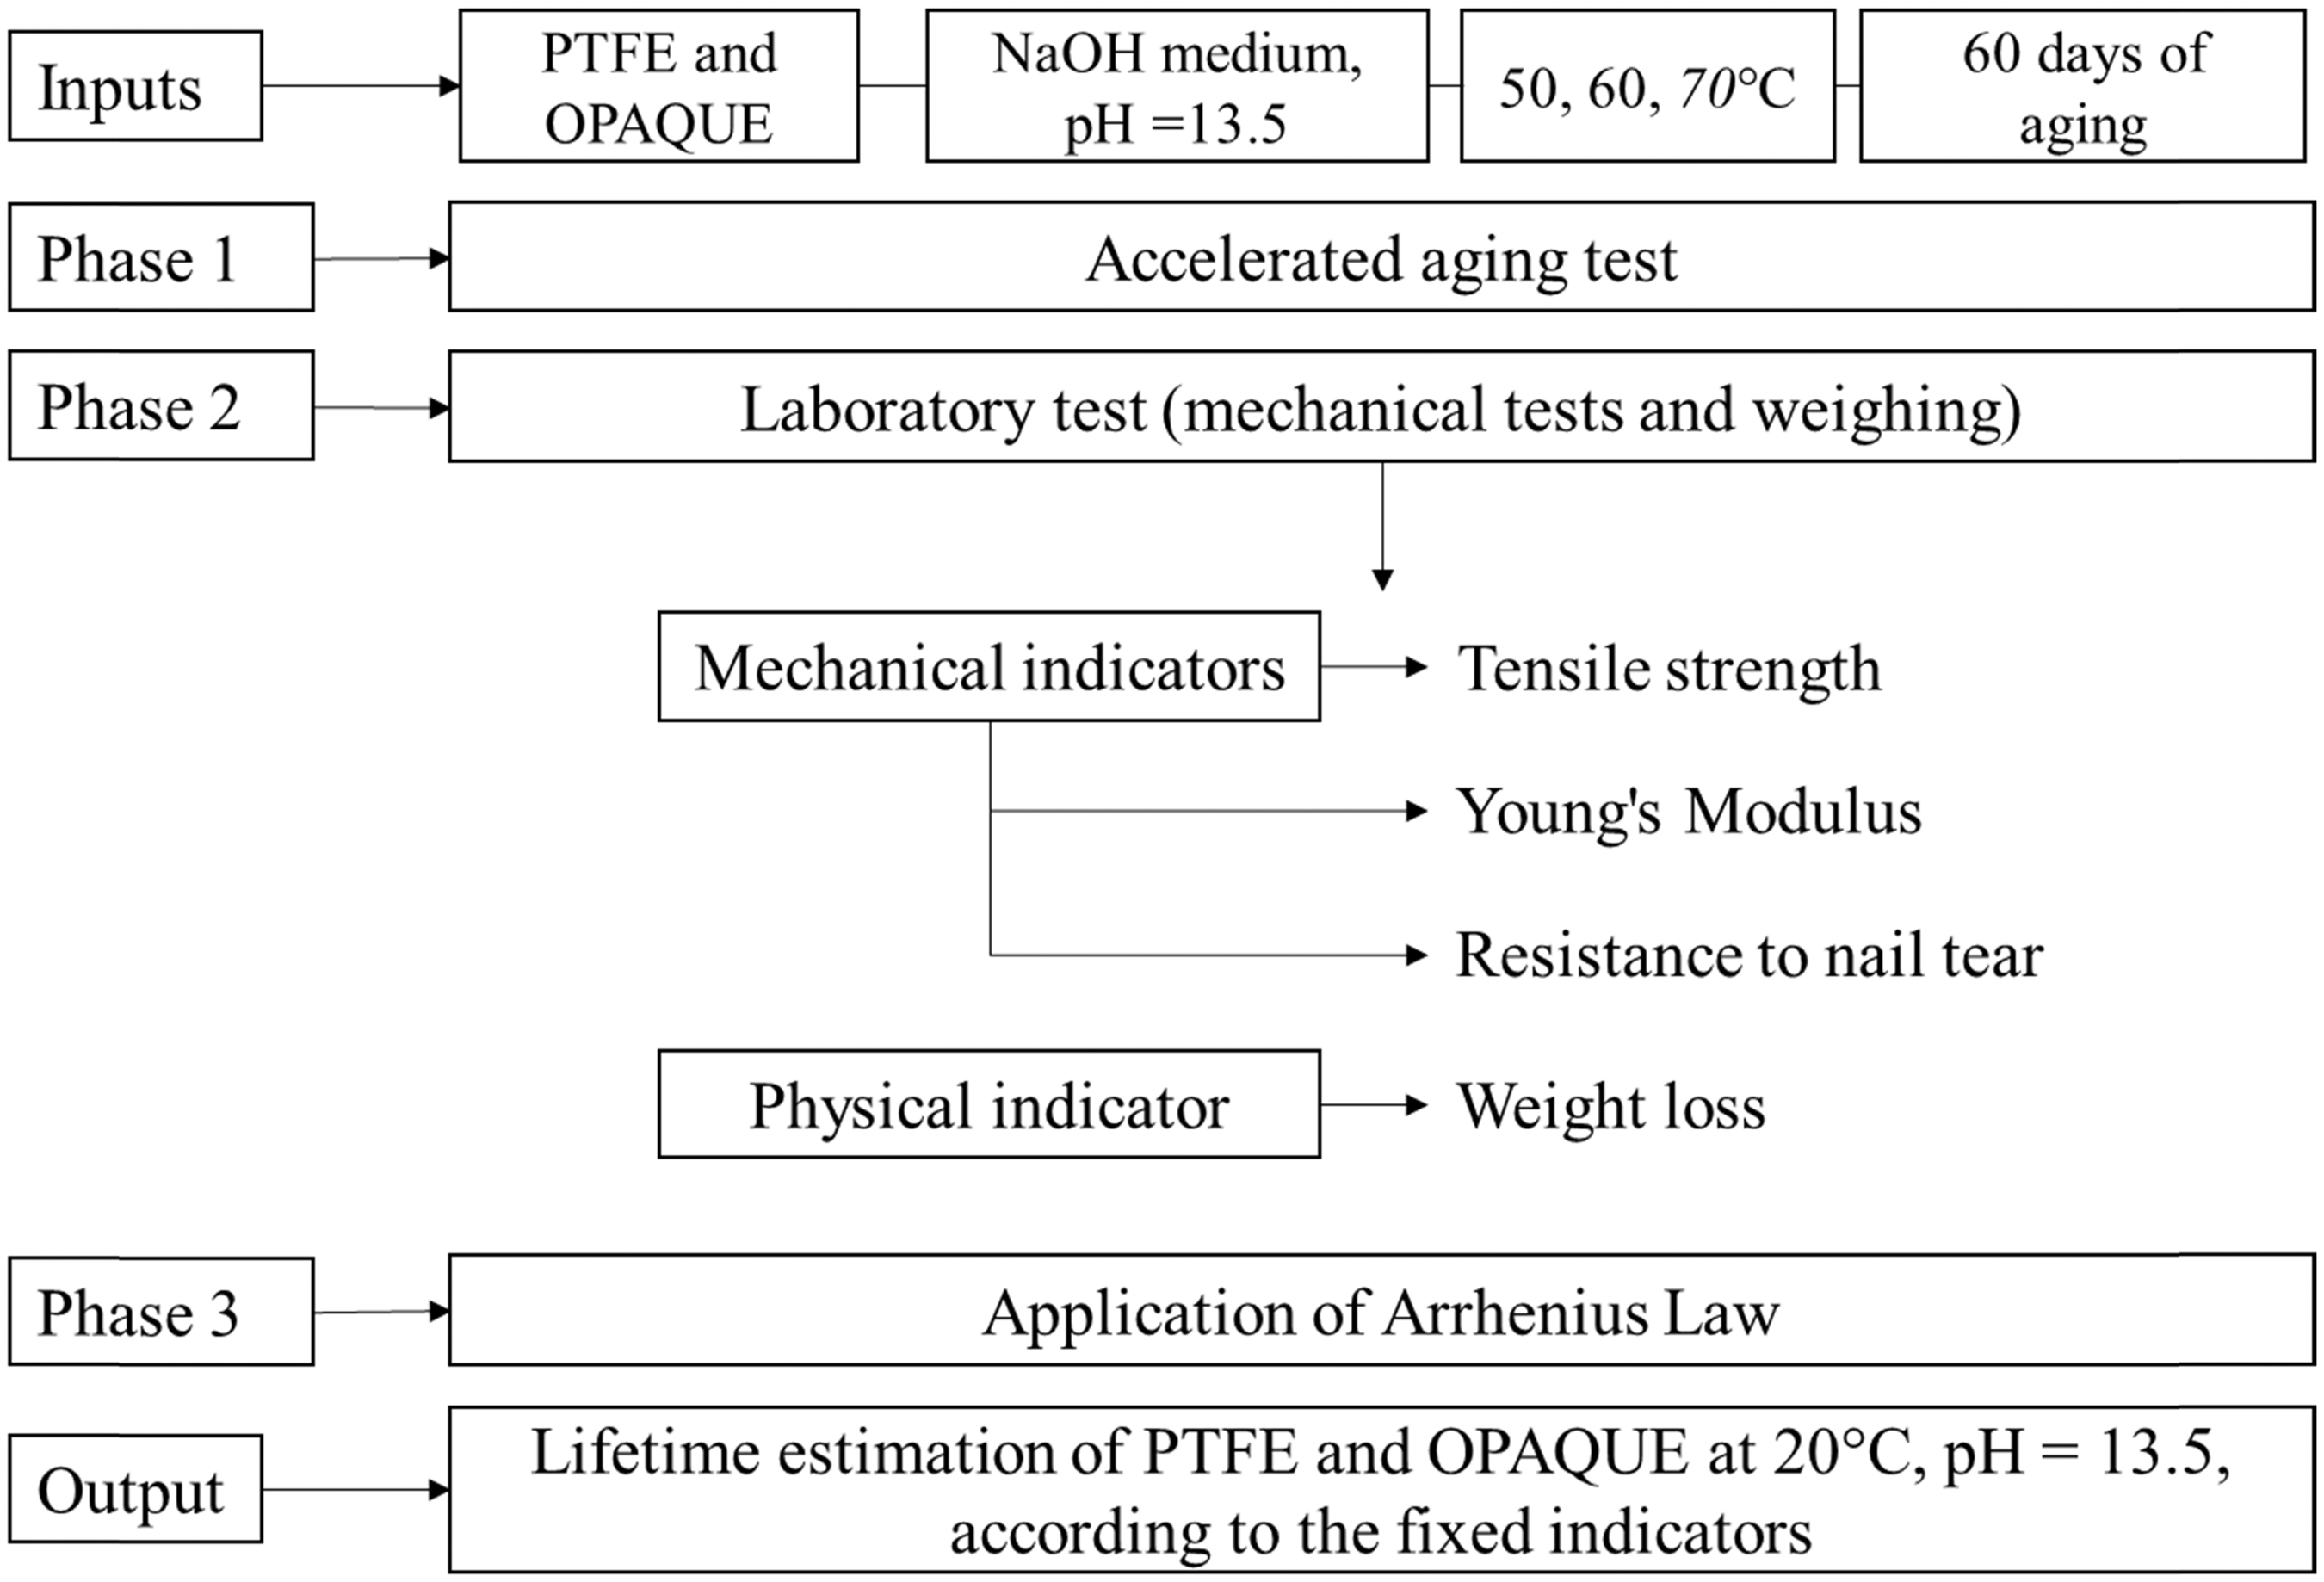
In order to compare the evolution of aging indicators and to facilitate the comparison of degradation rate, only residual values are represented in figures.
Mechanical indicators
Tensile test and Young’s modulus
For each aging period, three tensile samples were tested to have an average value of the breaking strength. Concerning Young’s modulus, the force–elongation curves for the same sample were similar in the elastic zone which allows extracting the Young’s modulus value.
Curves represented in Figures 4 and 5 express the evolution of the breaking load for, respectively, PTFE and Opaque. The remaining strength is represented instead of the breaking load and was used in other studies [17,18] to show the evolution of the concerned property. Figure 4 reveals that the residual strength decreases within time for PTFE, while the speed of loss increases with temperature. If the textile is considered after 30 days of aging, textiles in 50℃ still can afford strength of 80% (960 N) of their initial strength (1200 N), textiles in 60℃ can still afford 60% (720 N) while in 70℃ textiles lost 90% of their initial strength which means that they can only resist to an applied load of 120 N. In Figure 5, the evolution of breaking load of Opaque is represented. If the state of textile is considered after 30 days of ageing at 60℃, the residual strength is 60% (781 N) of its initial strength (1302 N) and at 70℃, the textile still can resist to 40% of its initial strength (520 N). At 50℃, the residual strength increases in percentages which means that the textile acquires more resistance. The comparison between Figures 4 and 5 shows that Opaque resists more to tensile load than PTFE with aging.
Residual tensile strength value PTFE. Residual tensile strength value OPAQUE.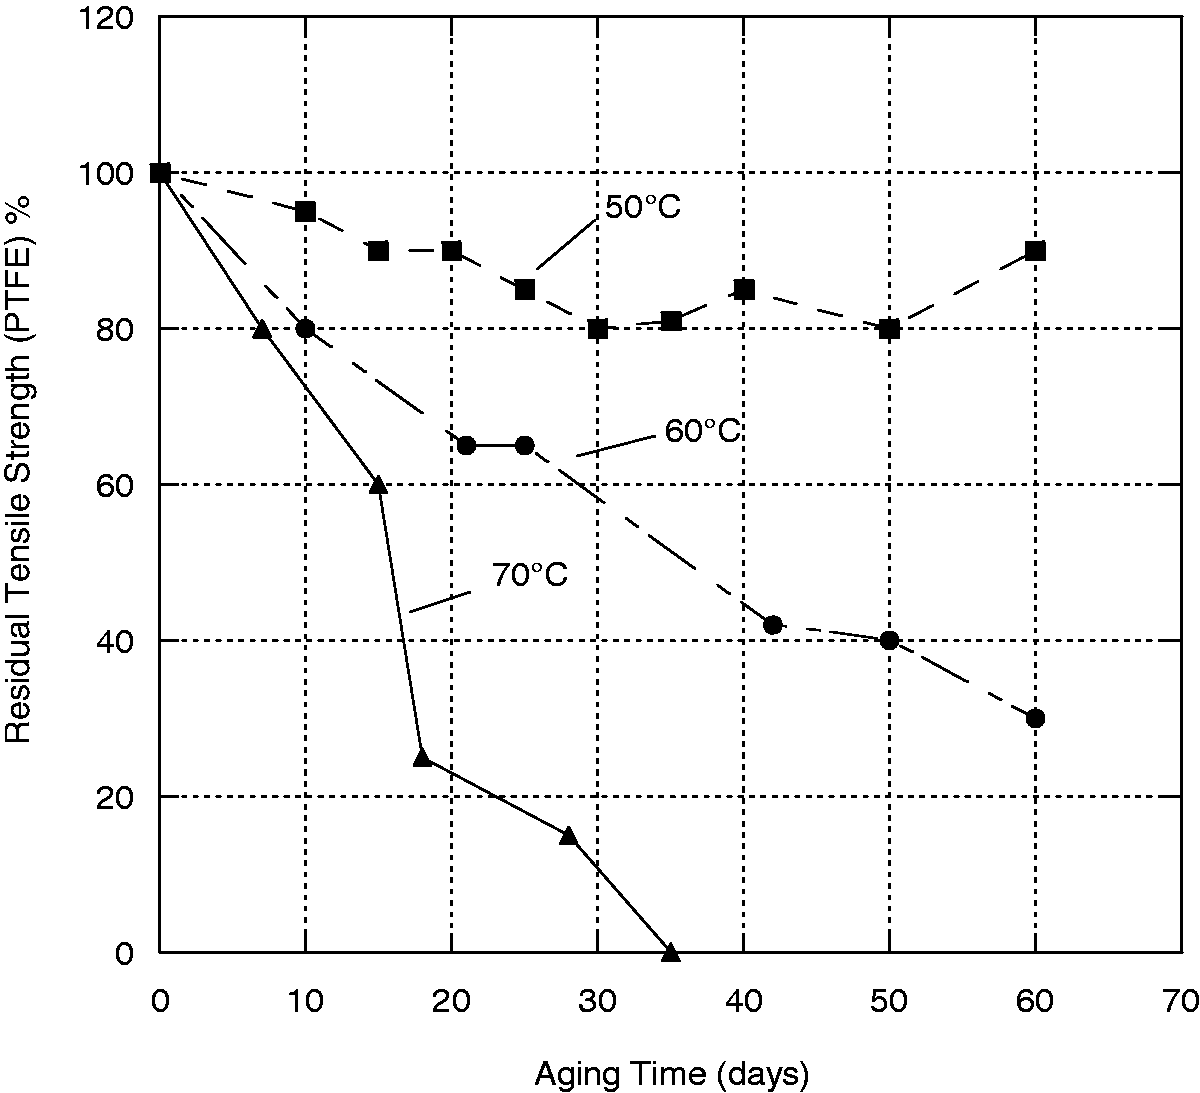

In Figures 6 and 7, the evolution of Young’s modulus residual value is plotted. The residual value of this parameter decreases with time until it reaches a certain level while the speed loss increases with temperature. The evolution of the residual value of Young’s modulus for samples aged in 50℃ tends to decrease very slowly in comparison with samples aged in 60℃ and 70℃. Figure 6 represents the evolution of Young’s modulus for PTFE. The value variation at 50℃ is stable within 30 first days and tends to increase after. For 60℃, the residual value decreases in the 20 first days and then stabilizes before decreasing. For samples in 70℃, the parameter value decreases within 30 days. Figure 7 presents the evolution of Young’s modulus for Opaque. At 50℃, the variation of the residual value is almost stable until 40 days then it starts to decrease. At 60℃, the residual value of Young’s modulus decreases during the first 35 days before starting to stabilize. Finally, the degradation at 70℃ is more obvious within the first 10 days of aging.
Young's modulus residual value PTFE. Young's modulus residual value OPAQUE.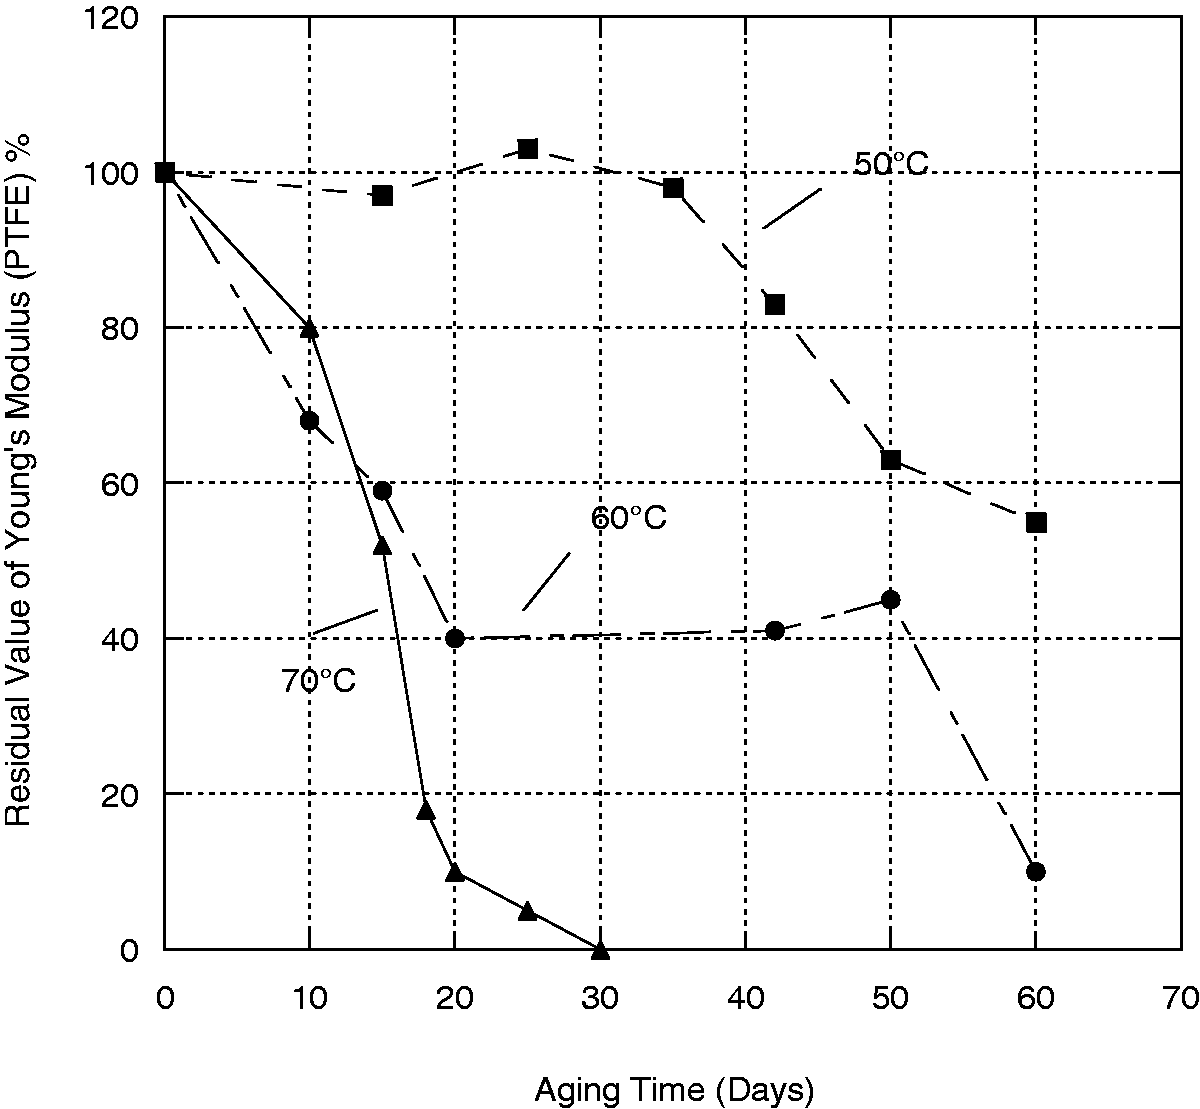

Resistance to nail tear
Figures 8 and 9 draw the evolution of the residual value of resistance to nail tear. The residual strength of all samples decreases with the same trend in the early state of aging. Figure 8 illustrates the evolution of resistance to nail tear for PTFE. If the textile is considered after 20 days of aging and at 50℃, it can still resist to 80% (716 N) of its initial value 896 N and for 60℃, this value decreases to only 20% (179 N). For 70℃ it is 10% (89 N). It is noticed that the residual value tends to stabilize. At 50℃, the stabilization starts after 50 days of ageing and the residual value of resistance is 134 N. At 60℃ and 70℃, this stabilization starts after 30 days of ageing at the residual value of 89 N for 60℃ and at 44 N for 70℃. Figure 9 presents the residual value for Opaque. After 20 days of aging, the textile can still resist to 90% (918 N) of its initial value 1021 N at 50℃, at 60℃ to 306 N and at 70℃ only to 173 N. The stabilization of residual value is noticed for temperatures 60℃ and 70℃. For 60℃, the stabilization starts after 30 days of ageing at a value of 153 N and for 70℃, and it starts after 15 days of ageing at a value of 173 N.
Resistance to nail tear residual value PTFE. Resistance to nail tear residual value OPAQUE.

Physical indicators
Sunworker PTFE loses its membrane in the early aging process which makes the monitoring of weight useless. This indicator was monitored only for Opaque. All samples used for tensile test and for nail tear test were weighted during aging.
Figure 10 illustrates the evolution of residual value of Opaque’s weight. The residual value of weight decreases with time and temperature. After 20 days of ageing, residual values of weight at 50℃, 60℃ and 70℃ are, respectively, 90%, 80% and 72% of their initial values.
Residual weight value OPAQUE.
Extrapolation method
Illustration of the method
The lifetime estimation for PTFE is based only on the evolution of mechanical properties. This is due to the loss of PTFE membrane which makes weight monitoring useless. For Opaque, both mechanical and physical properties were monitored.
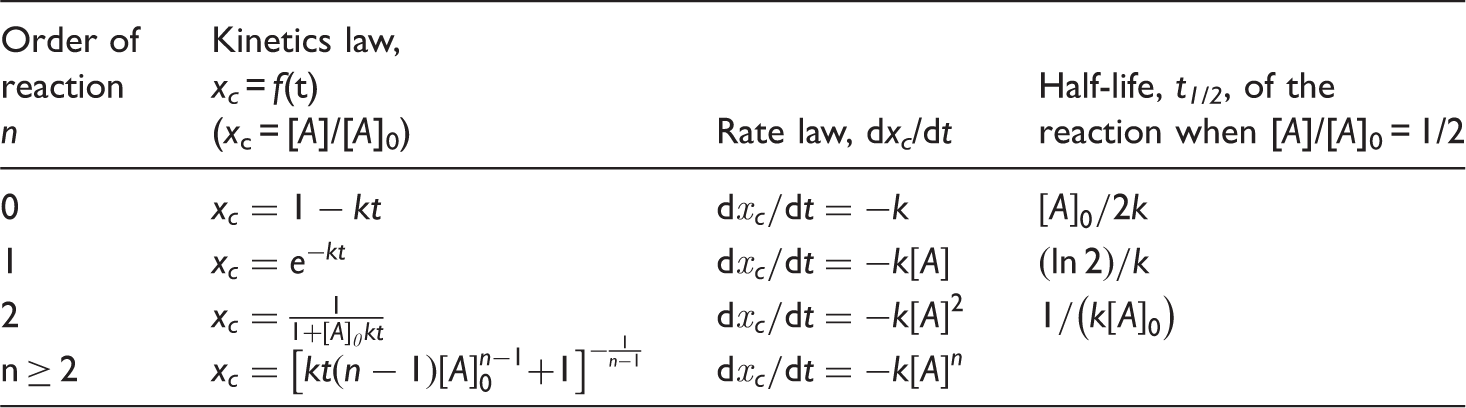
Kinetics law and reaction order Adamson 1973–Atkins 1986.
Reaction constants and correlation factors for PTFE.

Reaction constants and correlation factors for OPAQUE.
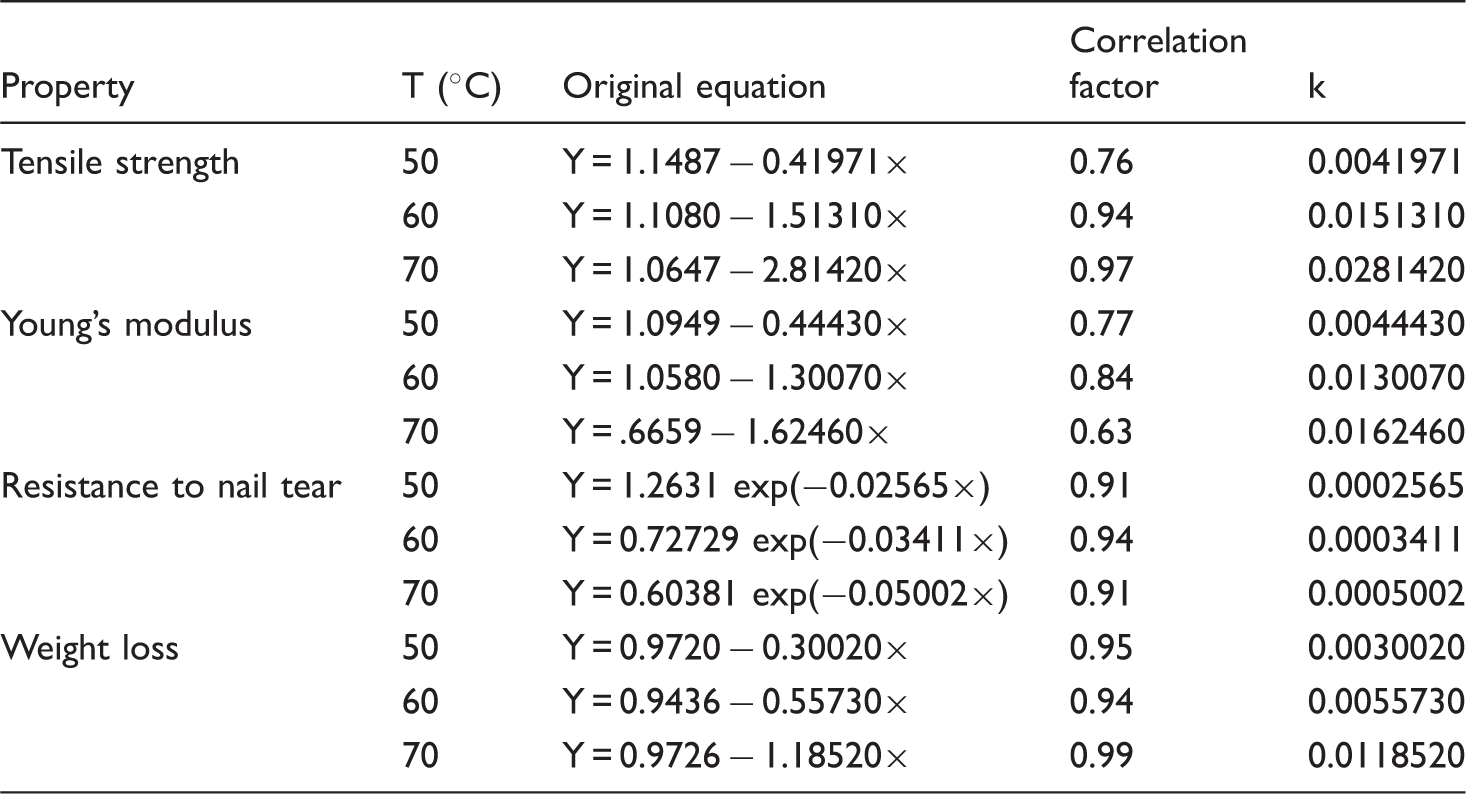
Correlation factors ranged between 0.60 and 0.99 for PTFE and Opaque. This result means that plotted trend curves are reliable for approximation. The calculated reaction constant loss increases with temperature. For PTFE (Table 4), this parameter is almost the same for tensile strength and Young’s modulus evolution but is much higher for resistance to nail tear. For Opaque samples (Table 5), the reaction constant of tensile strength and Young’s Modulus is almost the same except at 70℃. However, for resistance to nail tear, this parameter increases slowly according to temperature. For Opaque, it is noticed that the speed of weight loss tends to double with temperature.
Using reactions constants k to estimate the lifespans of the fabrics
Logarithm value of the degradation rate ‘K’ is plotted according to the inverse of temperature (in Kelvin) as shown in Figures 11 and 12 using the equations provided in Table 6.
Evolution of natural logarithm of degradation rate in function of the inverse of temperature (in Kelvin) for PTFE. Evolution of natural logarithm of degradation rate in function of the inverse of temperature (in Kelvin) for OPAQUE. Degradation rate K at 20℃ for PTFE and OPAQUE deducted from reaction constants k.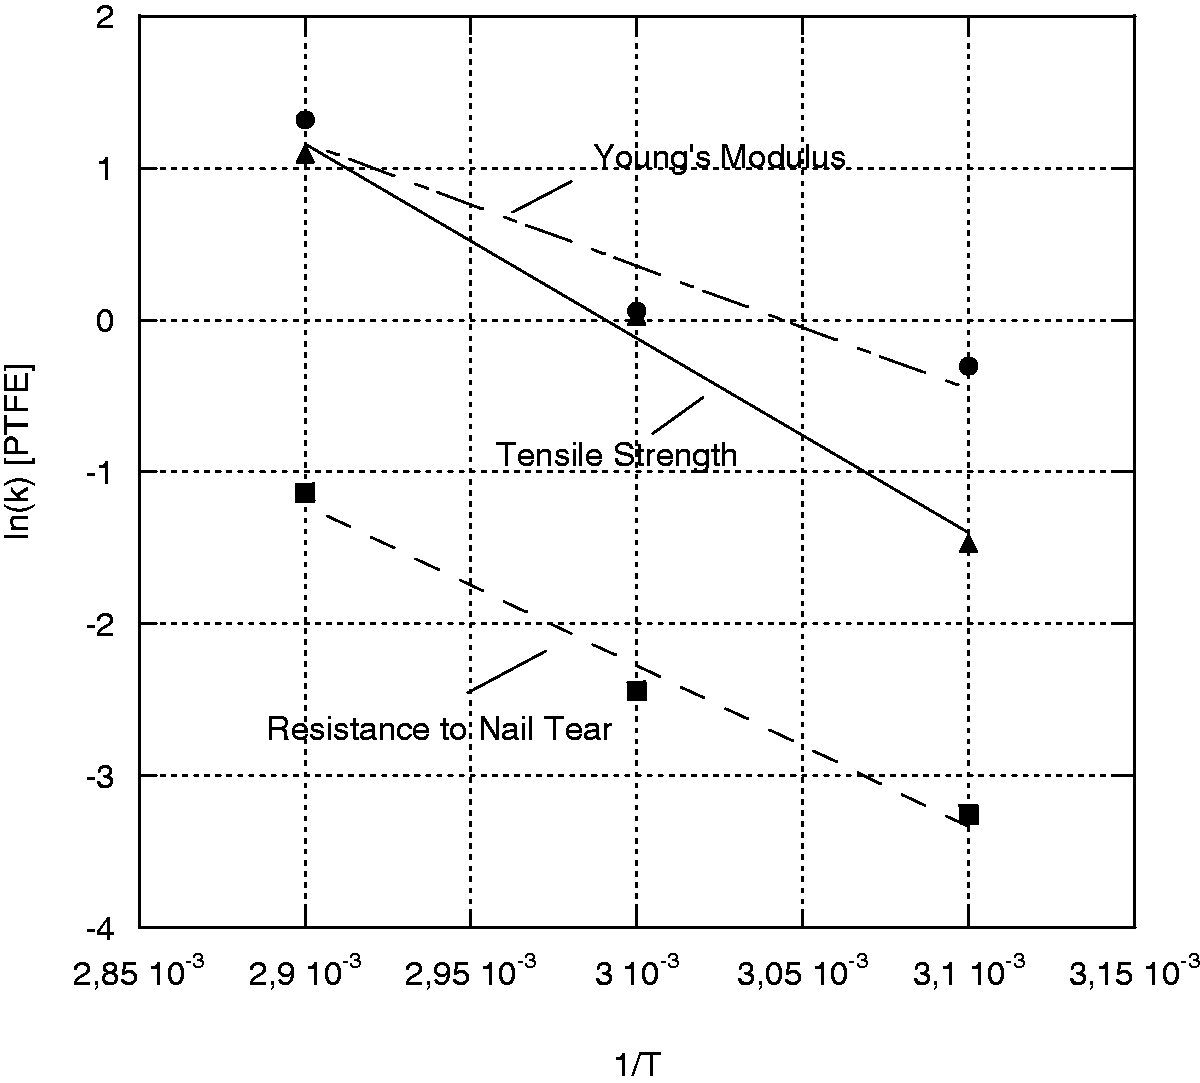


Table 6 describes the textiles’ degradation according to different indicators (properties).
For tensile strength, the equation that correlates ‘K’ parameter to temperature for PTFE and OPAQUE is presented. This equation estimates the speed of resistance loss in temperature of use. It is important to mention that the residual value is linear for tensile strength, Young’s modulus and weight loss while it is exponential for nail tear resistance (equations (6) and (7)).


K(T) is Degradation rate for T(K).
If the textile is used according to the indicators selected, at 20℃ and for one year, it loses 2% of its resistance for PTFE and 9% for Opaque. Concerning Young’s Modulus, PTFE loses 18% of its initial value and Opaque loses 25%. For nail tear resistance, PTFE loses 38% of its initial value and 96% for Opaque. Finally, considering weight loss, Opaque loses 12%.
Lifespan estimation for each indicator
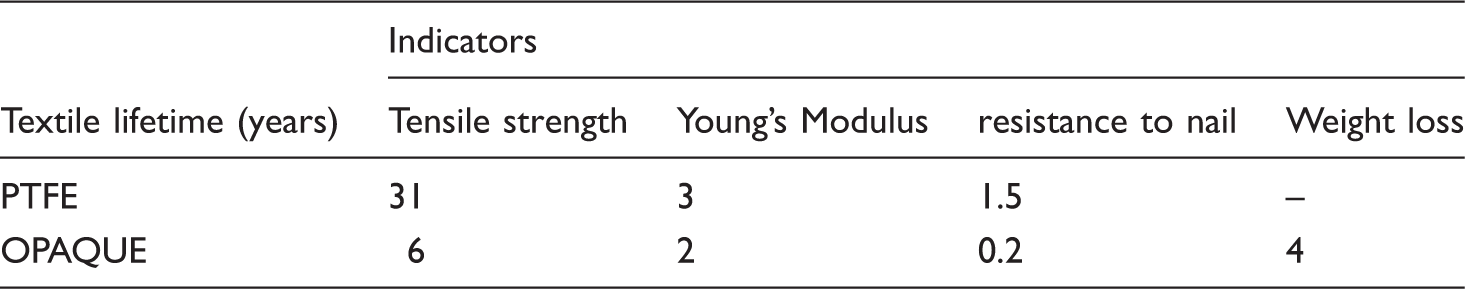
Lifetime estimation using “50% residual value” as an end-of-life criterion for PTFE and OPAQUE according to different indicators.
Global Lifespan estimation
The results obtained in this study need to be confirmed in real conditions within a long period of time. Because it is difficult to quantify this period of time while designing the product, it is necessary to define use conditions. For example, a textile that is used in an aggressive medium would never acts as a textile used in indoor conditions. To tackle this point, a performance-based approach should be defined.
In this study, mechanical indicators were defined to monitor aging. These indicators are: tensile strength, resistance to nail tear and weight loss. A performance-based approach could be established by weighting in percentages those indicators. For example, if the user specifies that the technical textile should keep an aesthetic aspect and the system will use nails, then the main indicators to be considered are weight loss and resistance to nail tear. As a consequence, high coefficients would be attributed to weight and resistance to nail tear indicators while low coefficient for the tensile strength indicator. To define these coefficients, it is necessary to conduct statistical studies based on onsite feedbacks.
Validity of the method
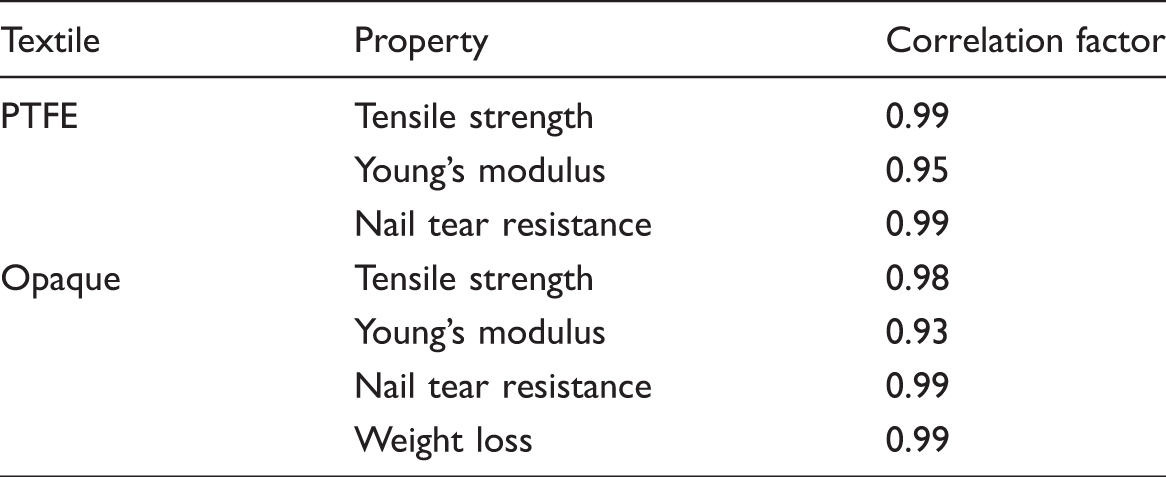
Correlation Factors ln(K) parameter and a linear Arrhenius trending curve.
Conclusion
The aim of this study is to estimate the lifetime of two technical textile materials with a Sunworker core. Along this work, an experimental aging protocol was designed. A previous study revealed that the studied materials are vulnerable to basic medium. This study completes the previous one by conducting accelerated aging at pH of 13.5 for two other temperatures (60℃–70℃) with the purpose of estimating the materials’ lifetime. Mechanical and physical properties degradation were monitored. Then, the results were manipulated using Arrhenius method to estimate the lifetime in laboratory conditions. The results obtained after data processing led to a linear trend for the Arrhenius method. Correlation factors were high for both mechanical and physical indicators. This result confirms the validity of Arrhenius lifetime estimation model for the two studied materials.
This study provides exploitable results. However, it should be noted that the obtained values are for 20℃ and pH of 13.5. Future studies should focus on determining a correction factor in order to calculate the lifetime in a different value of pH.
Footnotes
Acknowledgements
The authors kindly thank the enterprise Dickson for providing the samples as and the help in the analysis as well. The authors also thank the companies Bouygues Bâtiment Nord-Est PEG and CLUBTEX Association for their significant involvement.
Declaration of Conflicting Interests
The author(s) declared no potential conflicts of interest with respect to the research, authorship, and/or publication of this article.
Funding
The author(s) disclosed receipt of the following financial support for the research, authorship, and/or publication of this article: This study was partly funded by The ‘FEDER’.