
Abstract
Keywords
Introduction
Diabetes mellitus (DM) is a major global health challenge due to its high prevalence worldwide. In 2021, approximately 529 million people were living with DM globally, and the prevalence is projected to exceed 16% in the Middle East and North Africa by 2050. 1 DM is associated with various complications, particularly microvascular complications, which affect 57.6% of patients, with diabetic retinopathy (DR) being the most prevalent. 2 Additionally, diabetic neuropathy (DN) and diabetic kidney disease (DKD) have a prevalence of 16% and 15%, respectively. 3 Early management of these complications can lead to better clinical outcomes. 4 Therefore, the introduction of new, affordable, and easy-to-calculate markers could play an important role in the early detection of these complications.
Insulin resistance (IR) is significantly associated with an increased risk of diabetic microvascular complications. 5 This association is mediated by several mechanisms. Hyperglycemia induced by IR increases the formation of advanced glycation end products (AGEs) and oxidative stress, which damage vascular endothelial cells. 6 Moreover, insulin acts as a vasodilator by increasing nitric oxide (NO) production. 7 Consequently, IR can decrease NO synthesis, leading to abnormal angiogenesis and vascular complications. 7 Additionally, IR is associated with a low-grade inflammatory state due to the release of pro-inflammatory cytokines. 8 Elevated inflammatory markers significantly increase the risk of DM comorbidities, including both microvascular and macrovascular complications. 9 These mechanisms suggest that a marker of IR could be associated with the vascular complications of DM.
The hyperinsulinemic-euglycemic clamp (HEC) is the gold standard for measuring IR. 10 However, its clinical use is limited due to its cost, time requirements, and invasiveness. Consequently, new markers have been developed to assess IR. The estimated glucose disposal rate (eGDR) is a useful tool for predicting IR based on easily measurable parameters such as waist circumference (WC), body mass index (BMI), and glycated hemoglobin (HbA1c). 11 There is a significant relationship between IR and eGDR, with lower eGDR values indicating more severe IR.12,13 Furthermore, WC and hypertension (HTN), which are primary components of eGDR, are diagnostic criteria for metabolic syndrome (MetS). EGDR is also significantly associated with an increased risk of cardiovascular events in patients with DM, suggesting that it may serve as a marker of MetS.14–16 Recent studies have also demonstrated significant relationships between eGDR values and DM microvascular complications, showing that eGDR levels can significantly predict the risk and progression of these complications. For instance, Linn et al. reported an increased risk of DR and DKD in patients with an eGDR of less than 4. 17 Similarly, lower eGDR values can predict the progression of DKD. 18 These findings indicate the potential role of eGDR in predicting the risk of all-cause mortality and complications in patients with DM.
Recent studies have investigated the relationship between eGDR levels and both microvascular and macrovascular complications of diabetes. A recently published meta-analysis found that lower eGDR, as a marker of IR, was associated with an increased risk of cardiovascular disease and all-cause mortality. 16 However, the association between diabetic microvascular complications and this index has not yet been thoroughly investigated and a comprehensive systematic review is required to collect the data from these studies into a single result with a larger sample size, providing greater generalizability. Therefore, we performed this study to summarize all available data on the association between eGDR and diabetic microvascular complications in patients with type 1 DM (T1DM).
Methods
This systematic review has adhered to the Preferred Reporting Items for Systematic Reviews and Meta-Analysis (PRISMA) guidelines. 19 (PROSPERO registration: CRD42024590109).
Search strategy and study selection
We searched the online databases PubMed, Scopus, and Web of Science from inception to August 2024. The search strategy included keywords related to diabetic microvascular complications (“diabetic retinopathy,” “diabetic neuropathy,” and “diabetic nephropathy”) and (eGDR). The full search strategy is available in the Supplemental materials. There were no restrictions on language or publication period. Two independent investigators (D.Z. and P.S.) screened the included studies in two stages based on title, abstract, and full text. Disagreements were resolved by a third reviewer (H.R.). The included studies were imported into EndNote 21.2. Reference list of included studies was also assessed to avoid missing studies.
Eligibility criteria
We included studies that met the following inclusion criteria: (1) Population: individuals T1DM with no restrictions on age or gender; (2) Intervention (exposure): studies reporting eGDR values for patients with T1DM; (3) Comparison and outcome: studies comparing eGDR values between patients with and without microvascular complications as continuous outcome OR assessing the association between eGDR and risk of DR, DKD, and DN as dichotomous outcome. We did not include the following studies: (1) studies assessing eGDR values in patients with T2DM; (2) non-English studies; (3) communications, conference abstracts, and in vitro studies.
Data collection
Two investigators (D.Z. and P.S.) extracted the following data using a standardized form: (1) study characteristics (first author name, year of publication, country, study design, and sample size); (2) participant characteristics (age, follow-up time, duration of DM, and BMI); (3) outcome characteristics (DR, DKD, and DN); (4) statistical data (mean, standard deviation (SD), number of patients with and without DR, DKD, and DN, hazard ratio (HR) or odds ratio (OR), and corresponding 95% confidence interval (CI)); (5) data for cofounders (systolic blood pressure (SPB), diastolic blood pressure (DPB), lipid profile, BMI, WC and HbA1c).
Quality assessment and risk of bias
The quality of the included studies was assessed using the Newcastle-Ottawa Scale (NOS) designed for observational studies. In this scale, 9 points can be awarded to each study: 4 points for selection of participants, 2 points for comparability, and 3 points for assessing outcomes and exposures. 20 Two investigators (D.Z. and P.S.) independently assessed the quality of each study, and any disagreements were resolved by discussion or by consulting a third reviewer (H.R.). Studies scoring 4 or fewer points were considered high risk, those scoring 5–6 points were considered moderate risk, and those scoring 7 or more points were considered low risk. We included low-risk studies (NOS > 6).
Exposures and outcomes definition
The exposure in the included studies was the calculation of eGDR. It was calculated using the following formulas: 1. eGDR = 24.31 − (12.22 × WH) − (3.29 × HTN) − (0.57 × HbA1c) 2. eGDR = 21.158 − (0.09 × WC) − (3.407 × HTN) − (0.551 × HbA1c) 3. eGDR = 19.02 − (0.22 × BMI) − (3.26 × HTN) − (0.61 × HbA1c)
In these equations, WC is waist circumference, WH is waist-to-hip ratio and HTN indicates a current or past history of hypertension (no = 0, yes = 1). HTN was defined as an arterial pressure higher than 140/90 mmHg or the use of antihypertensive medications. The primary and secondary outcomes of this study were to evaluate the association between eGDR and the risk of diabetic microvascular complications OR to compare the eGDR mean values in patients with and without microvascular complications.
Statistical analysis
We used standardized mean differences (SMD) to compare the mean and SD of eGDR values in patients with and without diabetic microvascular complications, as eGDR measurements were on a different scale. Additionally, different effect sizes and methods were reported for the risk of DKD per one-unit increase of eGDR. Two studies reported HR calculated by Cox proportional hazard regression and 2 studies performed logistic regression. Given the limited and heterogeneous number of included studies, a combined meta-analysis of these effect sizes was conducted. Oppositely, studies reported the same effect sizes for the risk of DR per one-unit increase of eGDR. Indeed, all studies reported OR calculated through a logistic regression model. For each effect size, we calculated the natural logarithm (ln) of the effect sizes (OR and HR) and their 95% CIs per 1 unit increase of eGDR to stabilize the variances and normalize the distribution of the effect sizes. We performed an inverse-variance weighted method to calculate the summary effect size and 95% CI and to combine the transformed effect sizes. The exponentiated effect size and 95% CIs were reported as the final effect size. We pooled cross-sectional and case-control studies separately in each analysis to decrease the heterogeneity between studies. An I2 value greater than 50% in our analysis indicated substantial heterogeneity. We used a random-effect model for the meta-analyses, which accounts for both within-study and between-study variability. We also indicated that the P-value calculated from Cochrane’s Q-test for the risk of DKD per one-unit increase of eGDR was greater than 0.05. This reveals that studies with different effect sizes were relatively homogeneous in this analysis. Furthermore, a sensitivity analysis was conducted to evaluate the robustness of the pooled results.
We performed subgroup analysis and sensitivity analysis to identify the source of heterogeneity between studies. Subgroup analysis was performed according to mean values of BMI, HbA1c, and duration of DM in patients with microvascular complications. In the sensitivity analysis, each study was excluded to examine its influence on the overall estimate. Publication bias was assessed using Egger’s test. The meta-analysis was carried out using STATA, version 17.0 (StataCorp). A P-value < 0.05 was considered significant.
Results
Search result
A total of 5,273 studies were identified in the initial search. These studies were sourced from PubMed (n = 1095), Web of Science (n = 2350), and Scopus (n = 1828). No new results were identified in Google Scholar. A total of 1112 duplicate studies were excluded. Subsequently, we screened the remaining records based on the title and abstract. Keywords related to eGDR and diabetic microvascular complications were used in the initial screening. A total of 4113 results did not meet the inclusion criteria. The remaining studies (n = 48) were evaluated based on full-text review. Finally, 22 studies met the inclusion criteria. Two investigators performed the screening (D.Z. and (P.S.) and disagreements were resolved by a third reviewer (H.R.). Figure 1 illustrates the selection process of the included studies. Process of study selection.
Baseline characteristics of included studies
Baseline characteristics of included studies.

NOS: Newcastle-Ottawa scale; DM: diabetes mellitus; DR: diabetic retinopathy; DKD: diabetic kidney disease; DN: diabetic neuropathy; eGDR: estimated glucose disposal rate.
aDuta et al. reported the association between eGDR and DKD and DR in two separate studies.
Findings from meta-analysis
DKD and eGDR
Seven studies provided sufficient data for analyzing eGDR values in patients with and without DKD. Based on the analysis of cross-sectional studies, the eGDR values in patients with DKD were 1.04 SD lower than those without DKD (SMD: −1.04, 95% CI: −1.55 to −0.53, p < 0.01; Figure 2). The analysis of case-control studies yielded similar findings (SMD: −1.38, 95% CI: −2.69 to −0.07, p = 0.04; Figure 3). Subgroup analysis identified no significant heterogeneity factors (Table 2). Leave-one-out analysis confirmed that all included studies produced consistent findings (Supplemental Figure 1). Egger’s test indicated no publication bias among the studies (p = 0.08). Forest plot comparing eGDR values in DKD patients compared to patients without DKD in cross-sectional studies. Forest plot comparing eGDR values in DKD patients compared to patients without DKD in case-control studies. Subgroup analysis. aPercentage of variation across studies due to heterogeneity. bHeterogeneity between groups.


Moreover, four studies assessed the risk of DKD per one-unit increase in eGDR. The analysis showed that a one-unit increase in eGDR reduced the risk of DKD by 18% (ES: 0.82, 95% CI: 0.74–0.92, p < 0.01; Figure 4). No significant heterogeneity was observed among the studies (I2 = 52.07%, p = 0.10). Sensitivity analysis confirmed that the findings of each study were robust (Supplemental Figure 2) and Egger’s test indicated no publication bias in these studies (p = 0.308). Forest plot for the overall risk of DKD with a one-unit increase of eGDR in patients with diabetes mellitus.
DR and eGDR
Only four cross-sectional studies provided sufficient data for analyzing eGDR values in patients with and without DR. The analysis demonstrated significantly lower eGDR values in patients with DR than those without DR (SMD: −0.65, 95% CI: −0.96 to −0.35, p < 0.01; Figure 5). Subgroup analysis indicated no source of heterogeneity (Table 2). Sensitivity analysis indicated that omitting any single study did not significantly affect the findings (Supplemental Figure 3). Egger’s test showed no evidence of publication bias (p = 0.734). Forest plot comparing eGDR values in DR patients compared to patients without DR in cross-sectional studies.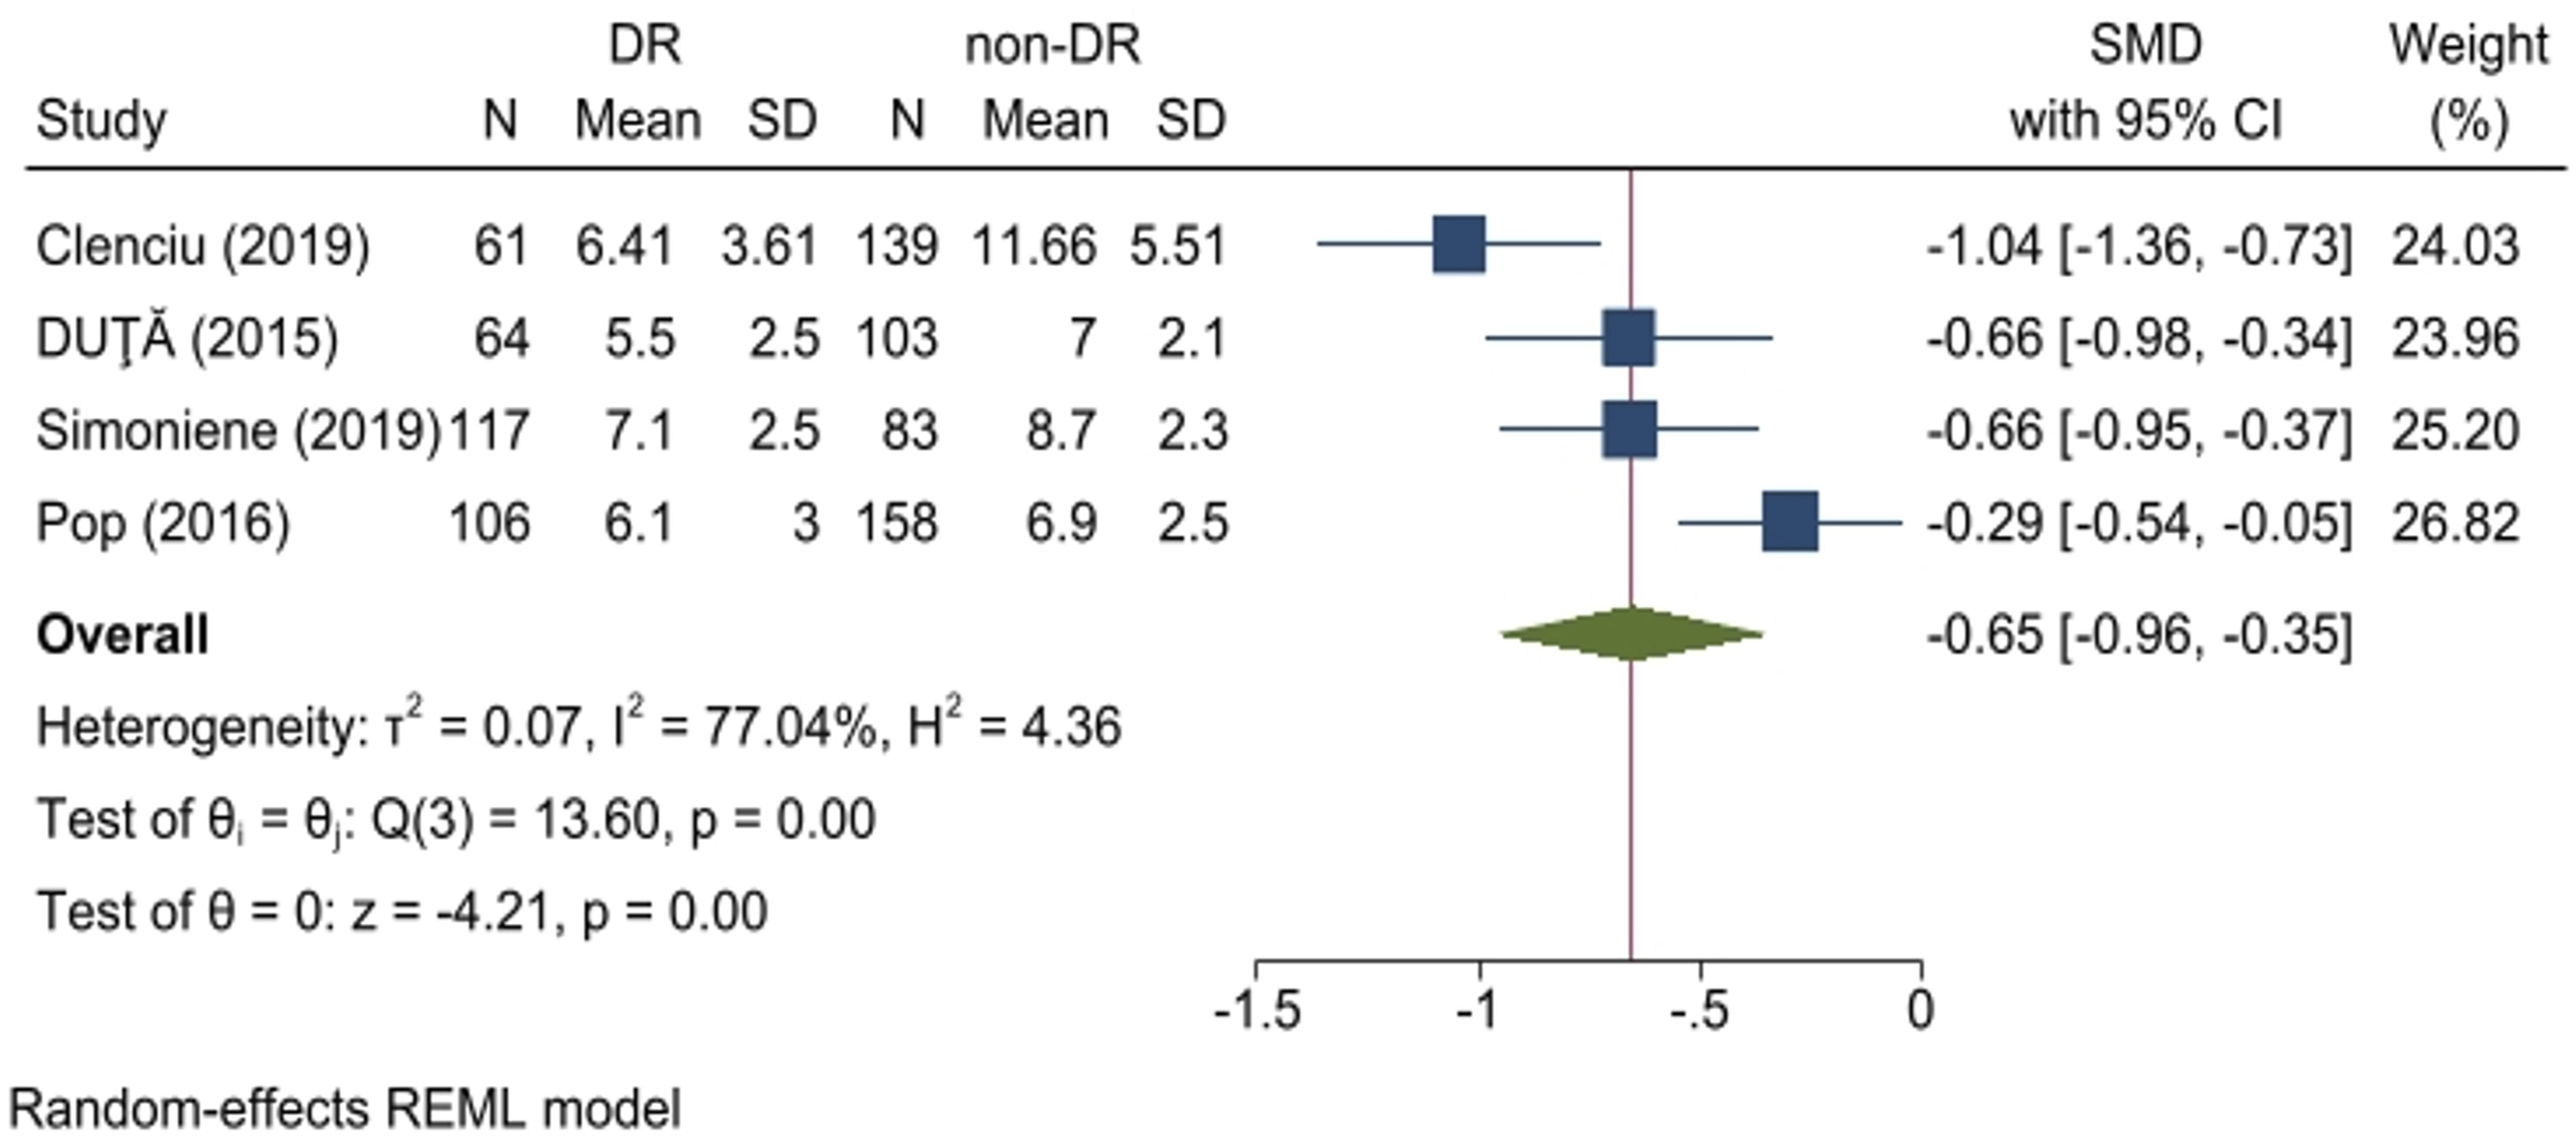
Additionally, a one-unit increase in eGDR was associated with a 21% reduction in the risk of DR (OR: 0.79, 95% CI: 0.73–0.85, p < 0.001; Figure 6). No publication bias was detected (p = 0.454), and sensitivity analysis confirmed the robustness of the included studies (Supplemental Figure 4). Furthermore, the analysis revealed a strong discriminatory value of eGDR for DR (AUC = 0.687, 95% CI: 0.542–0.832). Forest plot for the overall risk of DR with a one-unit increase of eGDR in patients with diabetes mellitus.
eGDR and DN
Only four cross-sectional studies provided the necessary data for inclusion in the analysis comparing eGDR values in patients with and without DN. The analysis revealed significantly lower eGDR values in patients with DN than those without DN (SMD: −0.66, 95% CI: −0.94 to −0.39, p < 0.01; Figure 7). Subgroup analysis demonstrated the duration of DM as a heterogeneous factor among studies (Table 2). Sensitivity analysis indicated that the omission of any single study did not affect the overall findings (Supplemental Figure 5). Furthermore, no evidence of publication bias was detected (p = 0.963). Forest plot comparing eGDR values in DN patients compared to patients without DN in cross-sectional studies.
Findings from the systematic review
In addition, eight studies evaluated the association between eGDR and DKD; however, they did not provide sufficient information for inclusion in the analysis. Consistent with previous findings, a significantly higher risk of DKD was observed in patients with the lowest eGDR levels compared to individuals in the highest eGDR category, used as the reference group.17,21,22 Bicu et al. reported a significantly higher prevalence of DKD among patients in the lowest quartile of eGDR. 23 Furthermore, several studies demonstrated significantly lower eGDR values in patients with DKD compared to those without DKD (p < 0.001).12,23–26 eGDR values were also found to be negatively correlated with urinary albumin excretion (UAE) and serum creatinine (r = −0.13 and −0.17, p < 0.05).24,27 Additionally, eGDR exhibited a strong discriminatory value for the diagnosis of DKD, with an AUC ranging from 0.643 to 0.897.25,28 These findings highlight the potential utility of eGDR as a predictive marker for the occurrence of DKD in patients with T1DM.
Six additional studies examined the association between eGDR and DR, but these were not included in the analysis due to insufficient data.12,17,22,23,26,27 Nonetheless, significantly lower eGDR values were observed in patients with DR compared to those without DR.12,23,26,27 Moreover, the highest prevalence of DR was reported among patients in the lowest quartile of eGDR.23,27 The risk of DR was also highest in individuals within the lowest quartile or tertiles of eGDR.5,17,21
Four studies highlighted significantly lower eGDR levels in patients with DN compared to those without DN; however, these were excluded from the analysis due to inadequate data.12,23,25,26 DN was also more prevalent among patients with eGDR values below 6.4 5. Furthermore, one study reported that each one-unit increase in eGDR significantly reduced the risk of DN by 18%. 28 Additional evidence suggested that a one-unit reduction in eGDR increased the risk of developing at least one microvascular complication by 40% to 90%.21,26 Patients in the lowest eGDR category exhibited a significantly higher risk of complications compared to those in the higher reference group. Overall, these findings strongly associate lower eGDR values with an increased risk of microvascular complications.
Quality assessment
The results of the quality assessment revealed a range of quality across the studies, with total scores ranging from 6 to 9. The majority of studies scored 6 or 7, suggesting moderate quality. However, several studies achieved higher scores of 8 or 9, indicating a higher level of methodological rigor. Overall, included studies were considered as moderate risk. Supplemental Table 1 shows a detailed assessment of studies quality.
Discussion
Our meta-analysis revealed that eGDR values are significantly lower in patients with DKD, DR, and DN than those without these complications. Specifically, eGDR values were 1.04 SD lower in DKD patients, 0.65 SD lower in DR patients, and 0.66 SD lower in DN patients. Additionally, a one-unit increase in eGDR was associated with an 18% and 21% reduced risk of DKD and DR, respectively, indicating IR significantly contributes to the occurrence of these complications in patients with T1DM. Furthermore, eGDR demonstrated strong discriminatory power for detecting DKD, DR, and DN.
IR can be assessed through various methods, including dynamic tests such as the HEC, which requires multiple blood samples to measure glucose levels repeatedly.29,30 However, these tests require expert personnel and are 20–30 times more costly than routine indices, 30 making them impractical for large-scale clinical and epidemiological applications. Simpler indices, such as the homeostatic model assessment of insulin resistance (HOMA-IR) and the quantitative insulin sensitivity check index (QUICKI), are non-invasive, cost-effective, and easy to calculate. However, these indices primarily reflect hepatic, rather than peripheral IR. 31 Thus, the need for an index that balances dynamic testing accuracy with practicality led to the development of eGDR. 32
Recent studies have increasingly highlighted the rising prevalence of IR in patients with T1DM, a condition traditionally characterized by insulin deficiency. 33 Patients with T1DM and IR face a significantly higher risk of cardiovascular disease and microvascular complications. 5 Moreover, the duration of T1DM positively correlates with the development of IR. 5 Thus, eGDR has been introduced as a reliable marker for assessing IR in patients with T1DM to detect and manage complications associated with IR in these patients. Atance et al. reported significantly lower eGDR values in obese and overweight patients with T1DM compared to those with normal weight. 34 Higher insulin doses were also observed in obese patients, indicating that a lower eGDR, calculated using HbA1c, HTN, and WHR, is a marker of IR. 34 The components of eGDR are strongly associated with MetS.35,36 An increased WHR (>0.89) is also linked to MetS. 37 These findings suggest that IR plays a critical role in the development of diabetic complications and eGDR, as a validated marker of IR, can facilitate early detection and management of these complications, particularly microvascular T1DM patients. 38
Hyperglycemia, a key feature of IR, induces the formation of AGEs that bind to their receptors (RAGEs) and activate nuclear factor-kappa B (NF-κB) and vascular endothelial growth factor (VEGF). These pathways promote pericyte apoptosis and vascular leakage, contributing to DR.39–41 Additionally, hyperglycemia activates the polyol pathway, converting glucose to sorbitol, depleting nicotinamide adenine dinucleotide phosphate (NADPH), and reducing glutathione (GSH) levels, leading to oxidative stress and vascular damage.42,43 Similarly, in DKD, IR impairs insulin signaling required for NO synthesis, resulting in vasoconstriction and decreased glomerular filtration rate (GFR). IR also enhances oxidative stress and chronic inflammation through reactive oxygen species (ROS) and renin-angiotensin-aldosterone system (RAAS) activation, exacerbating renal damage.42,44–47 In DN, reduced nerve growth factor (NGF) levels and impaired glucose metabolism are implicated, although data linking eGDR and DN remain limited.48–50 These mechanisms highlight IR’s role in microvascular complications and support eGDR as a predictive marker for their progression.
In addition to eGDR, several other markers of IR have been associated with diabetic complications. For instance, significantly higher TyG index values have been observed in individuals with diabetes with DKD, DR, and DN.51,52 Additionally, the TyG index has shown good discriminatory value for DKD. 53 Similarly, the visceral adiposity index (VAI) has been significantly associated with microvascular complications in T2DM patients,54,55 and it demonstrated the highest area under the curve (AUC) compared to other markers. 54 However, it should be considered that most of IR markers including HOMA-IR and TyG index were originally developed to measure IR in patients with T2DM while eGDR is mainly tailored for T1DM. Since HOMA-IR and TyG calculations rely on fasting insulin levels, their application in T1D, characterized by insulin deficiency, is inappropriate. Thus, comparing the predictive performance of eGDR with indices meant for T2D lacks validity, and more research is needed to introduce novel markers associated with IR in T1DM.
Our findings demonstrate the significant benefits of eGDR for the early detection and management of diabetic microvascular complications in patients with T1DM. Lower eGDR values are strongly associated with increased risks of DKD, DR, and DN, making it a valuable marker for identifying high-risk patients. Regular monitoring of eGDR can facilitate timely interventions, personalized treatment plans, and effective preventive measures, ultimately improving patient outcomes. Additionally, eGDR is a cost-effective and non-invasive tool that can be easily integrated into routine clinical practice, providing a practical approach to improving diabetes care and reducing the burden of complications.
To our knowledge, this is the first systematic review assessing the association between diabetic microvascular complications and eGDR as a marker of IR in patients with T1DM. Previous studies have often focused on the role of eGDR in cardiovascular diseases. In a recently published systematic review, Sun et al. (2024) showed that a one-unit increase in eGDR decreased the risk of cardiovascular disease outcomes and all-cause mortality by 16% and 17%, respectively, in patients with T1DM. 16 In line with these results, we found similar associations for DKD, DR, and DN, particularly in patients with T1DM. These findings underscore the importance of eGDR and IR in the development of diabetic complications.
Several limitations of this study should be noted. First, the limited number of studies included prevented us from performing subgroup analyses on other heterogeneous factors. Additionally, some studies did not report the duration of DM. Second, we included 19 cross-sectional studies, which may introduce recall bias. Second, all studies in this review were observational, with most lacking follow-up data. Although we included only low-risk studies, the limitations of observational research should be considered when interpreting these results. Third, the small and heterogeneous sample sizes in the studies limit the generalizability of our findings. Finally, this study acknowledges the potential variability introduced using different eGDR equations. This variability may affect the comparability of results across studies and underscores the need for standardization in future research. We recommend future prospective cohort studies with larger sample sizes to address these limitations. In addition, more research is crucial on the association between DN and eGDR.
Conclusion
This meta-analysis highlights the significant association between eGDR and various diabetic microvascular complications, including DKD, DR, and DN in patients with T1DM. Our findings indicate that higher eGDR values are consistently linked to a reduced risk of these complications. Overall, our analysis underscores the importance of eGDR as a valuable marker for assessing the risk of diabetic microvascular complications. These findings suggest that interventions aimed at increasing eGDR could be beneficial in reducing the burden of these complications in individuals with diabetes.
Supplemental Material
Supplemental Material - Estimated glucose disposal rate and microvascular complications of diabetes mellitus type I: A systematic review and meta-analysis
Supplemental Material for Estimated glucose disposal rate and microvascular complications of diabetes mellitus type I: A systematic review and meta-analysis by Diar Zooravar, Hanieh Radkhah, Bahareh Shateri Amiri, and Pedram Soltani in Diabetes & Vascular Disease Research.
Footnotes
Author contributions
D.Z. and P.S. contributed to the systematic search and data extraction. D.Z. contributed to the statistical analyses and data interpretation. D.Z., H.R., and B.S.A. contribute to manuscript drafting and data interpretation. All authors approved the final manuscript for submission.
Declaration of conflicting interests
The author(s) declared no potential conflicts of interest with respect to the research, authorship, and/or publication of this article.
Funding
The author(s) received no financial support for the research, authorship, and/or publication of this article.
PROSPERO registration
CRD42024590109
Supplemental material
Supplemental material for this article is available online.
Appendix
References
Supplementary Material
Please find the following supplemental material available below.
For Open Access articles published under a Creative Commons License, all supplemental material carries the same license as the article it is associated with.
For non-Open Access articles published, all supplemental material carries a non-exclusive license, and permission requests for re-use of supplemental material or any part of supplemental material shall be sent directly to the copyright owner as specified in the copyright notice associated with the article.