
Abstract
Aims
To investigate temporal changes in glycaemic control and weight contributing to insulin resistance (IR), in Thai individuals with type 1 diabetes (T1D)
Methods
Longitudinal data of 69 individuals with T1D were retrospectively collected over a median follow-up of 7.2 years. The estimated glucose disposal rate (eGDR), a marker of IR, was calculated using an established formula. Individuals were assigned as insulin-sensitive T1D (the latest eGDR≥8 mg/kg/min), or insulin-resistant T1D/double diabetes (the latest eGDR<8 mg/kg/min). Generalised linear mixed model was employed to compare the temporal patterns of HbA1c, BMI, and eGDR between the two groups.
Results
26 insulin-resistant T1D had a gradual decline in eGDR, corresponding with increased weight and HbA1c. In contrast, 43 insulin-sensitive T1D had stable insulin sensitivity with an improvement in HbA1c over time, associated with a modest weight gain. Fluctuations of glucose levels were observed during the early diabetes course leading to unstable eGDR, thus limiting the use of eGDR to classify insulin-resistant T1D.
Conclusion
T1D individuals who eventually develop IR are likely to experience early increasing IR over time. In contrast, those who ultimately do not have IR, maintain their insulin sensitivity throughout their course at least in the medium term.
Keywords
Introduction
Intensive glycaemic management whereby both short- and long-term vascular complications can be reduced in people with type 1 diabetes (T1D) is now beyond doubt.1,2 However, the cardiovascular protective effect seems to be attenuated over time, 3 challenging the notion that glycaemia is the key factor contributing to increased risk of cardiovascular disease (CVD) in people with T1D. Indeed, the secondary analysis from the DCCT study has shown that factors such as high blood pressure and dyslipidaemia, all of which are features of insulin resistance, are important contributors to increased CVD events in T1D.4,5
The detrimental effect of insulin resistance (IR) in T1D has gained more attention recently, especially after the introduction of the estimated glucose disposal rate (eGDR), an IR marker in individuals with T1D.6,7 Importantly, eGDR has been demonstrated, in two prospective studies, to correlate with CVD risk and death in individuals with T1D.8,9 Moreover, a Swedish cohort, including over 17,000 individuals with T1D, displayed that those with eGDR
The exact factors contributing to the pathogenesis of DD are not entirely clear and the rate of IR progression in T1D remains unknown. Several factors, such as genetic predisposition, an obesogenic environment, and subcutaneous insulin treatment, are believed to play a role in the aetiology of DD. 10 However, the natural history of developing DD remains largely unknown and the prevalence in the South Asian population is yet to be documented. Therefore, the aim of this work was to establish the prevalence of DD in Thai individuals with T1D and understand temporal changes in glycaemic control and weight, which can contribute to IR in this population.
Method
Patients
This was a retrospective longitudinal study collecting over 20 years of out-patient data from the hospital electronic database - Prince of Songkla University Hospital Health Information System (PSU-HIS) from January 2001 – November 2022. Individuals with T1D were identified using ICD-10 codes: E10.0–E10.9. Inclusion criteria were those who had: i) age >18 to 50 years, ii) on treatment with multiple daily dose insulin (MDI) >12 months, iii) follow-up duration at the hospital of at least 3 years, and iv) no established cardiovascular disease at baseline. Given that C-peptide or autoantibody testing was unavailable when the data were collected, the diagnosis of T1D was clinically confirmed if one of the following criteria was met
11
: i) age of onset <35 years old with classical symptoms of T1D including a short history of osmotic symptoms, weight loss and/or diabetes ketoacidosis (n = 51), ii) BMI at onset <25 kg/m2 plus plasma glucose at diagnosis
The study was approved by the Human Research Ethics Committee, Faculty of Medicine, Prince of Songkla University (REC: 64-509-14-1).
Data collection
Clinical characteristics, including age, sex, BMI, blood pressure, HbA1c, and total daily insulin requirement, were collected at baseline and quarterly until the most recent clinic visit. eGDR was calculated using the following formula: eGDR = 19.02 – (0.22 X BMI [kg/m 2 ]) – (3.26 X HTN) – (0.61 X HbA1c [%]), whereby HTN is hypertension (1 = yes, 0 = no). 10 Overweight was denoted as BMI >23.0 kg/m2 for the Thai population. 13 Quarterly variables (including BMI, blood pressure, HbA1c, total daily insulin dose, and eGDR) were averaged to represent the average yearly values. Data of other medications (oral hyperglycaemic agents, antihypertensives, and statins) and biochemistry including creatinine, lipid profile, alanine aminotransferase (ALT), and urine albumin-creatinine ratio (UACR) were collected yearly.
Outcome definitions
Time at baseline refers to the time when an individual is on stable insulin treatment for 12 months. Given that developing IR in the context of T1D is likely to be time-dependent, we defined DD using the latest value. Individuals were divided into those with T1D and normal insulin sensitivity (T1D without IR) if they had eGDR ≥8 mg/kg/min and as insulin resistant (i.e. having DD) if eGDR was <8 mg/kg/min at the end of the follow-up period. 10 Retinopathy was graded according to the Early Treatment of Diabetic Retinopathy Study (ETDRS) classification and the presence of retinopathy was defined when observed abnormalities were at least mild non-proliferative retinopathy. 14 Nephropathy was defined as the estimated glomerular filtration rate (eGFR) <60 mL/min/1.73 m2 or a history of persistent albuminuria. Persistent albuminuria was defined as UACR >30.0 mg/g on at least two occasions.
Statistical analysis
Descriptive data were presented as mean ± SD, median [25th −75th percentile], or number (%). Changes between baseline and updated values were compared using the paired T-test. The student T-test (or Mann-Whitney U test) and Chi-square test were used to compare continuous and categorical parameters between two groups. Owing to heterogeneities in duration and frequency of follow-ups of each individual, generalised linear mixed model with repeated measures (GLMM) was employed to predict temporal changes of the estinated mean of variables including eGDR, BMI, HbA1c, and blood pressure. Years of follow-up, diagnosis group, and the interaction between the two were designated as fixed effect. A random intercept was used in the model to compare the magnitude (slope) of changes in variables between groups when their starting points (intercepts) were unbalanced. All analyses were carried out using SPSS version 25 (IBM SPSS Statistics 25, IBM Corporation, USA). Statistical significance was set at p < .05 for all analyses.
Results
Baseline characteristics
Clinical characteristics of individuals with DD and T1D without IR (n = 69).
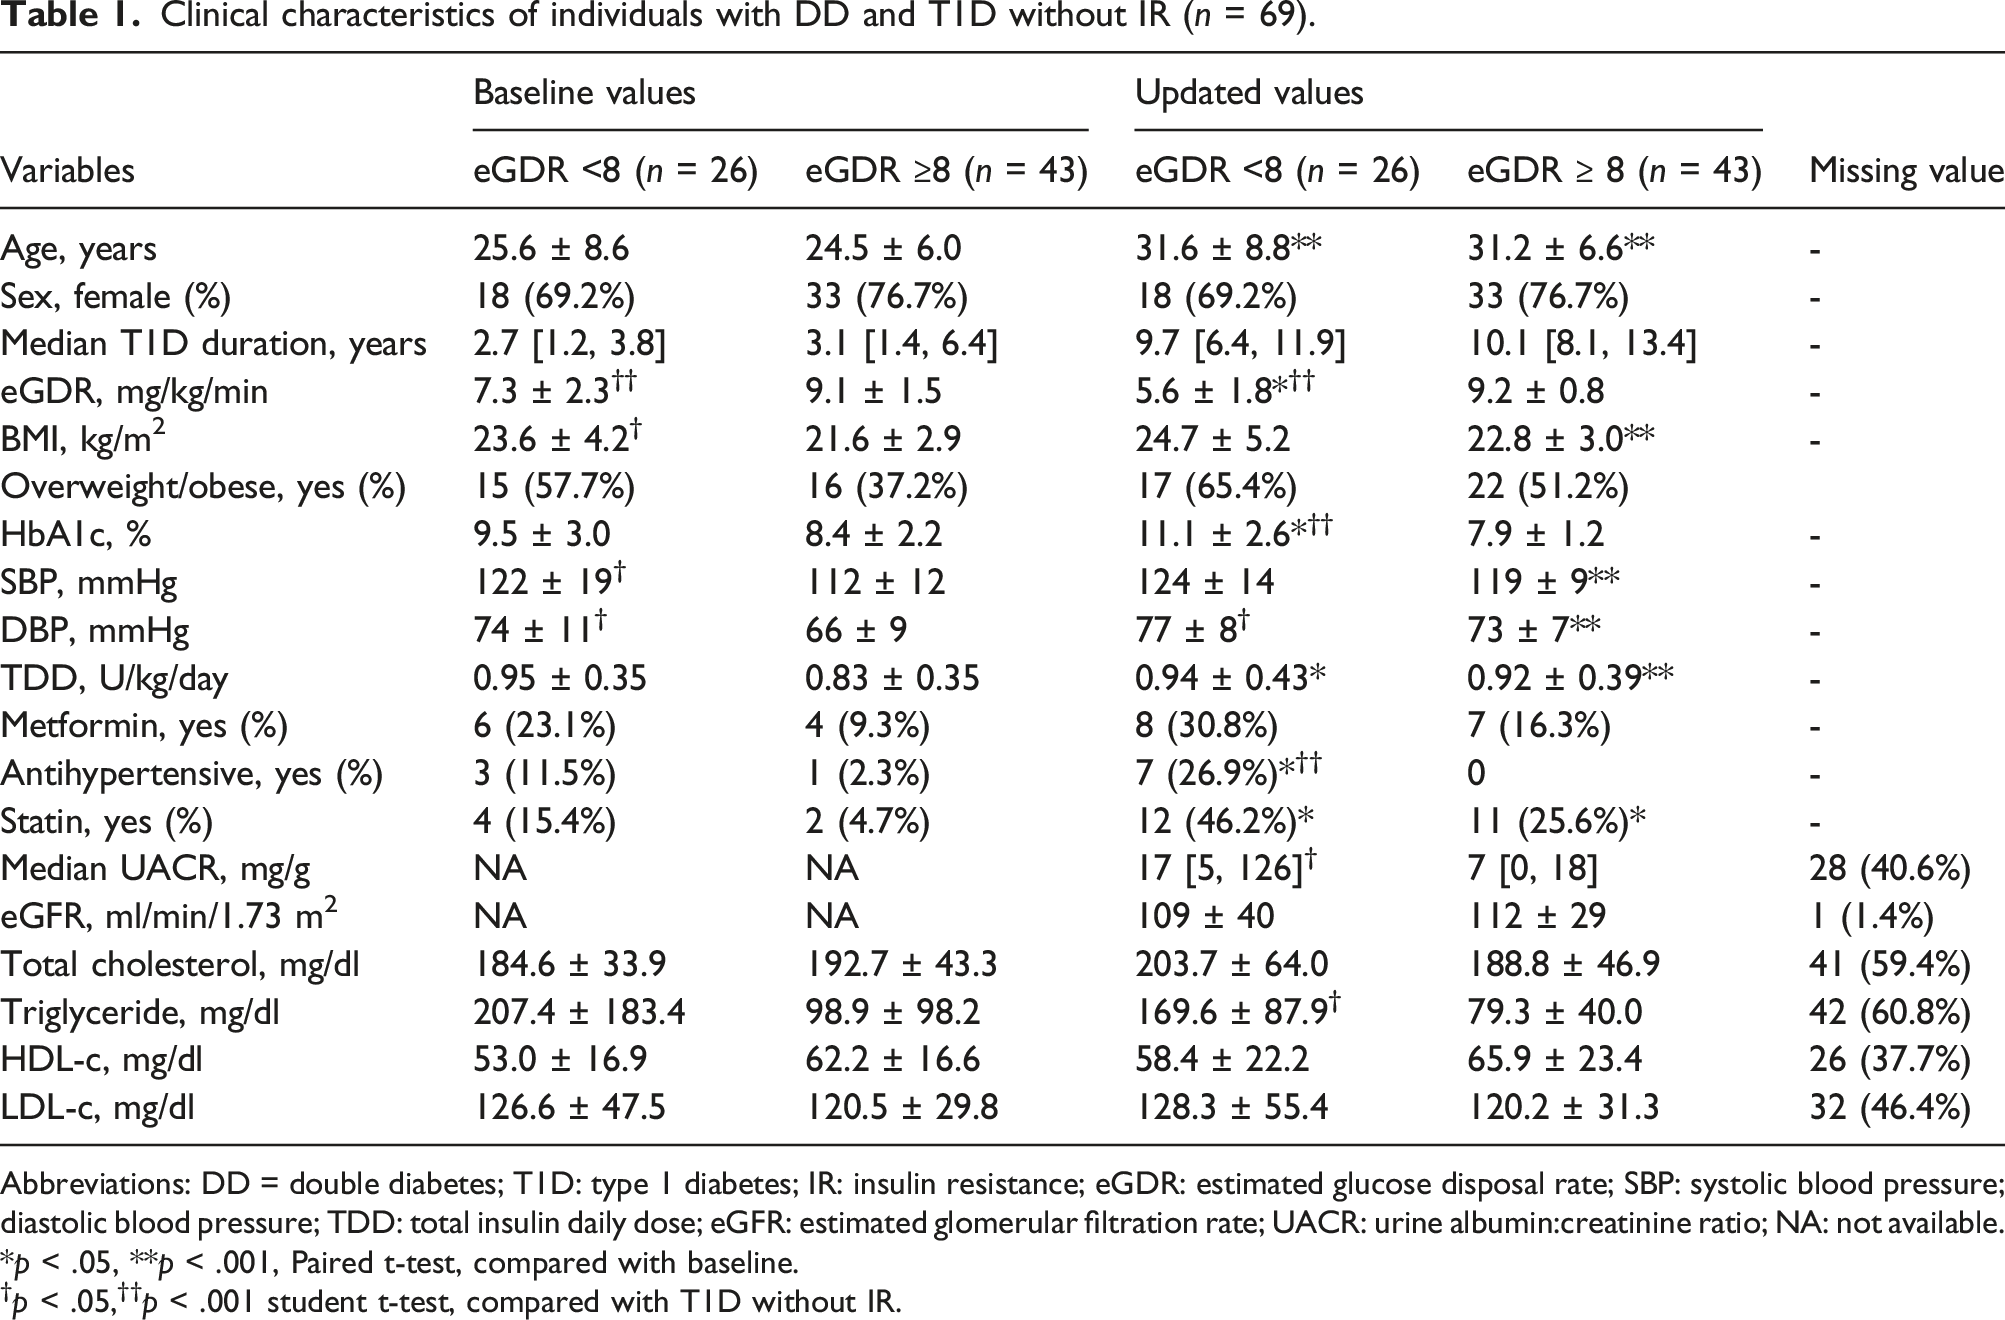
Abbreviations: DD = double diabetes; T1D: type 1 diabetes; IR: insulin resistance; eGDR: estimated glucose disposal rate; SBP: systolic blood pressure; diastolic blood pressure; TDD: total insulin daily dose; eGFR: estimated glomerular filtration rate; UACR: urine albumin:creatinine ratio; NA: not available.
*p < .05, **p < .001, Paired t-test, compared with baseline.
†p < .05,††p < .001 student t-test, compared with T1D without IR.
Temporal patterns of eGDR, BMI, A1c, and blood pressure in individuals with DD or T1D without IR
Individuals with DD had a gradual decline in eGDR with a significant change observed after 3 years of follow-up. The decrease in eGDR corresponded to substantial increases in BMI and HbA1c (Figure 1(a), 1(b), and 1(d)). Although individuals in both groups were gaining weight across follow-up periods, the magnitude of weight gain in DD group was greater than T1D (Figure 1(b)). Likewise, the temporal pattern of HbA1c in DD group showed an upward trajectory in contrast to those with T1D and normal insulin sensitivity (Figure 1(d)). The temporal trends in systolic and diastolic blood pressures were similarly increasing over time in both groups. However, only T1D group had a significant change in blood pressure (Figure 1(c) and 1(e)). Taken together, individuals with DD demonstrated an increase in weight with worsening glucose control, whereas T1D without IR were likely to show an improvement in HbA1c over time, associated with a modest weight gain. Temporal patterns of estimated mean variables in 69 individuals with DD or T1D without IR (n = records). (a) estimated mean eGDR (n = 503), (b) estimated mean BMI (n = 535), (d) estimated mean HbA1c (n = 517), (c) and (e) estimated mean systolic and diastolic blood pressure (n = 524). Generalised linear mixed model with random intercept: *p < .05, **p < .001 compared magnitudes of changes from baseline within group; †p < .05, ††p < .001 compared magnitudes of changes from baseline between groups at the same time point.
Timing to DD diagnosis
In this study, 11/46 (23.9%) individuals initially diagnosed with T1D without IR became insulin resistant. In contrast, 8/23 (34.8%) of those initially diagnosed as DD would revert to normal insulin sensitivity during the follow-up period. These transitions occurred usually within the first 3 years from baseline in which the fluctuation of HbA1c levels led to unstable eGDR (Figure 2). Temporal patterns of estimated mean variables in 69 T1D individuals with or without transition of insulin resistant status (n = records). (a) mean eGDR (n = 503), (b) baseline and updated insulin resistant status, (c) mean BMI (n = 535), (d) mean HbA1c (n = 517). T1D/T1D = eGDR ≥8 at baseline and updated status, DD/T1D = eGDR <8 at baseline but reverted to ≥8 at update status, T1D/DD = eGDR ≥8 at baseline but converted to ≤8 at updated status, DD/DD = eGDR ≤8 at baseline and updated status.
Discussion
This study is the first to demonstrate the temporal patterns of BMI and HbA1c in Thai individuals with T1D in the presence and absence of IR, assessed using eGDR. Among individuals who were insulin resistant at the most recent follow-up, it is likely that they already had progressive IR early after the diagnosis. In contrast, individuals who remained insulin sensitive, appeared to have good insulin sensitivity throughout their course. Moreover, individuals with DD tended to display additional weight gain with worsening glucose control whereas T1D without IR were more likely to improve their glycaemic control, although they did mildly gain weight, thus maintaining normal insulin sensitivity. Additionally, our data suggest that the diagnosis of DD using eGDR should be awaited until the HbA1c level is relatively stable. The honeymoon period or early response to insulin treatment may cause HbA1c levels to fluctuate creating unstable eGDR, thus affecting the utility of eGDR as a diagnostic marker.
The pathogenesis of DD is thought to be secondary to the interaction between genetic predisposition and environmental factors.10,15,16 In this study, individuals identified as DD had higher BMI and blood pressure at baseline than T1D without IR, despite similar diabetes duration, suggesting that the interaction between genetic predisposition and exposure to an obesogenic environment may play a role in developing early IR in T1D. Later, exposure to an obesogenic environment such as high-caloric, high-fat intake17,18 or sedentary lifestyle19,20 can further increase the prevalence of obesity and IR in this population. In this study, the gradual increase in HbA1c coupled with weight gain in DD group, as opposed to the modest improvement in HbA1c level and minimal weight gain in T1D without IR, implies that DD phenotype per se is prone to more weight and worsening diabetes control. Genomic studies in the DD subgroup are of high interest if we are to better understand the interaction between genetics and environment on the transition to insulin resistance in T1D population.
Given that IR increases cardiovascular risk, independent of glycaemia in T1D, IR has been proposed as a potential target for adjunctive therapies to insulin. 7 Given that subcutaneous insulin administration can induce peripheral IR and weight gain,21,22 non-insulin therapy offering an insulin-sparing effect with weight reduction (such as SGLT2 inhibitors or GLP-1 analogues) would be an attractive add-on treatment. 23 In our study, the percentage of individuals with DD taking metformin was higher than those without IR. Nonetheless, metformin has been acknowledged as ineffective adjunctive therapy in terms of weight management in T1D. 24 Future studies investigating pharmaceutical interventions on obesity/IR reduction in our T1D population are, therefore, awaited with interest.
The current study demonstrates that more research is needed, studying the progression of DD in different ethnic groups, to optimise management in T1D. In our study, young adults with T1D had lower BMI and higher HbA1c than patients from a Western population. One systematic review comparing individuals of Asian versus non-Asian origin showed lower BMI but higher HbA1c in the former group. 25 This is likely related to various genetic and environmental factors, including dietary patterns, socioeconomic levels, and access to advanced technologies. A well-developed study comparing IR in Caucasian versus Thai patients with T1D might also generate interesting results.
The relatively long follow-up of the patients in this study and the consistency of the data are clear strengths. However, there are some limitations to be acknowledged. First, this was a retrospective, single-centre study with relatively small numbers and therefore data can only be regarded as preliminary, and larger multicentre studies are required to confirm these findings. However, application of repeated measures analyses and accounting for the number of follow-ups, the sample size reaches 535 records, greatly enhancing the analytical power. Second, there are some missing data at each study time point as a result of different follow-up frequencies, which is the inherent weakness of observational studies. However, GLMM can minimise this disadvantage by using predicted values from the training dataset rather than actual values, allowing the analysis of a dataset with missing values. Third, the lack of C-peptide or autoantibody testing raises the possibility that some of these individuals had other than T1D, but this is unlikely given the classical clinical presentation. Finally, the eGDR cut-off <8 mg/kg/min has been proposed as a diagnostic criterion and adopted from the Swedish population; it remains unclear whether this cut-off is valid for the Thai population.
Conclusion
This is the first study to show that T1D individuals who developed IR at the most recent follow-up are likely to experience an early increase in IR over time due to ongoing weight gain and uncontrolled blood glucose levels. In contrast, those without IR tend to maintain good insulin sensitivity at least in the medium term. Our data suggest that we should await until HbA1c levels are relatively stable before labelling patients as having IR, at least in the Thai population. Future studies are required to understand the role of worsening IR on the development of diabetes complications, while interventional studies aiming to improve insulin sensitivity are essential to uncover whether this can modulate the risk of micro- and macrovascular disease.
Supplemental Material
Supplemental Material - Progression of insulin resistance in individuals with type 1 diabetes: A retrospective longitudinal study on individuals from Thailand
Supplemental Material for Progression of insulin resistance in individuals with type 1 diabetes: A retrospective longitudinal study on individuals from Thailand by Thanes Jirawatwarakul, Thakorn Pruktanakul, Chaitong Churuangsuk, Warut Aunjitsakul, Wantanee D. Tsutsumi, Rattana Leelawattana, Supamai Soonthornpun, Ramzi A. Ajjan and Noppadol Kietsiriroje in Diabetes & Vascular Disease Research
Footnotes
Author contributions
Conceptualisation:
Declaration of conflicting interests
The author(s) declared no potential conflicts of interest with respect to the research, authorship, and/or publication of this article.
Funding
The author(s) received no financial support for the research, authorship, and/or publication of this article.
Data availability statement
The datasets generated during and/or analysed during the current study are available from the corresponding author on reasonable request.
Supplemental Material
Supplemental material for this article is available online.
Appendix
References
Supplementary Material
Please find the following supplemental material available below.
For Open Access articles published under a Creative Commons License, all supplemental material carries the same license as the article it is associated with.
For non-Open Access articles published, all supplemental material carries a non-exclusive license, and permission requests for re-use of supplemental material or any part of supplemental material shall be sent directly to the copyright owner as specified in the copyright notice associated with the article.