
Abstract
Insulin receptors are internalized by endothelial cells to facilitate their physiological processes; however, the impact of hyperinsulinemia in brain endothelial cells is not known. Thus, the aim of this study was to elucidate the impact hyperinsulinemia plays on insulin receptor internalization through changes in phosphorylation, as well as the potential impact of protein tyrosine phosphatase 1B (PTP1B). Hippocampal microvessels were isolated from high-fat diet fed mice and assessed for insulin signaling activation, a process known to be involved with receptor internalization. Surface insulin receptors in brain microvascular endothelial cells were labelled to assess the role hyperinsulinemia plays on receptor internalization in response to stimulation, with and without the PTP1B antagonist, Claramine. Our results indicated that insulin receptor levels increased in tandem with decreased receptor signaling in the high-fat diet mouse microvessels. Insulin receptors of cells subjected to hyperinsulinemic treatment demonstrate splice variation towards decreased IR-A mRNA expression and demonstrate a higher membrane-localized proportion. This corresponded with decreased autophosphorylation at sites critical for receptor internalization and signaling. Claramine restored signaling and receptor internalization in cells treated with hyperinsulinemia. In conclusion, hyperinsulinemia impacts brain microvascular endothelial cell insulin receptor signaling and internalization, likely via alternative splicing and increased negative feedback from PTP1B.
Introduction
Obesity impacts over 93 million adults in the United States and over 1 billion adults worldwide 1 and leads to various metabolic complications including hyperglycemia, dyslipidemia, hypertension, and insulin resistance. 2 Obesity is also linked with an increased risk for developing cognitive impairment, neurodegenerative diseases, and brain atrophy,3–5 although the connection between this peripheral phenomenon and central nervous system functional decline is still an active area of investigation. An accumulating body of knowledge supports the role of sedentary lifestyle and the consumption of a diet with a high fat content in this pathogenesis,6,7 and a high-fat diet (HFD) has been demonstrated to lead to impaired learning and memory performance in animal models.8–11 Given the role obesity seems to be playing in memory impairment, this makes understanding the connecting mechanisms an important focus of research.
There are likely several factors which lead to obesity-induced cognitive impairment, and recent focus has centered on endothelial dysfunction. 5 It is known that HFD leads to insulin resistance and hyperinsulinemia, a state of high circulating insulin within the plasma. 12 Insulin is a hormone released following feeding and its dysregulation is thought to contribute to the pathogenesis of diseases such as diabetes and Alzheimer’s disease. 13 Insulin binds its receptor in the capillaries of the cerebral vasculature, 14 which is a selectively permeable, non-fenestrated endothelial layer.15,16 Some studies point to the fact that hippocampal microvessels exhibit high concentrations of insulin receptors,17–19 coupled with the impact of insulin receptor signaling on cerebral blood flow, barrier integrity, and insulin transcytosis5,20,21 as a potential underlying mechanism connecting obesity and memory decline. Much about the impact of obesity on the insulin receptor functioning at this unique barrier is still unknown.
Insulin binding to the insulin receptor leads to a conformational change, which allows for autophosphorylation of the receptor at specific tyrosine residues. This leads to the tyrosine phosphorylation of adaptor proteins such as the insulin receptor substrate (IRS)1, which in turn triggers signaling cascades such as the phosphatidylinositol 3-kinase (PI3K) /protein kinase b (AKT) pathway.22,23 Alternatively, chronic serine phosphorylation of IRS1 and reduced autophosphorylation of the insulin receptor results in reduced phospho-activated AKT, which has been demonstrated during insulin resistance.9,24 This lack of insulin receptor autophosphorylation not only negatively impacts downstream insulin signaling, but also the internalization of the insulin/insulin receptor from the plasma membrane via endocytic vesicles.25–29 This internalization plays a key role in regulating and sustaining insulin receptor signaling. Furthermore, some studies support the idea that internalization of insulin /insulin receptor is a necessary step in the transport of insulin into the brain via the brain microvascular endothelial cells. 20 There is a lack of information on how hyperinsulinemia specifically impacts the internalization of the insulin receptor at this microvascular barrier.
Insulin receptor kinase activity and regulatory phosphatase crosstalk is essential for directing insulin receptor internalization and signaling. 30 Increased tyrosine phosphatase activity, particularly protein tyrosine phosphatase 1B (PTP1B), is linked with decreased insulin receptor signaling activation and may contribute to pathological serine kinase activity associated with obesity.24,31,32 In fact, PTP1B is one of the major tyrosine phosphatases regulating insulin signaling in endothelial cells. 30 This prompted us to explore whether PTP1B leads to insulin receptor impairments during HFD-induced hyperinsulinemia in microvascular endothelial cells.
In the present set of studies, we assessed insulin receptor signaling in isolated hippocampal microvessels, which represent the blood-brain barrier microenvironment including endothelial cells, from HFD mice. To address mechanisms which culminate in insulin receptor internalization, we utilized both mouse primary microvascular endothelial and human immortalized microvascular endothelial cells. Using molecular techniques, we assessed the internalization and phosphorylation state of the insulin receptor following experimental hyperinsulinemia and evaluated the potential impact of PTP1B on insulin receptor internalization.
Materials and methods
Animal model
Three separate cohorts of five male C57BL/6 mice, purchased from the Jackson Laboratory (Bar Harbor, Maine), were randomly assigned to either a standard diet consisting of 10% kcal from fat (STD; Research Diets Inc.; #D12450B, New Brunswick, NJ) or a high-fat diet with 54% kcal from fat (HFD; Research Diets Inc.; D05090701) ad libitum at approximately 5 weeks of age for 6 weeks. The HFD mouse model has been demonstrated to induce elevated circulating insulin and glucose intolerance as little as 5 days after diet induction 33 and beyond.34,35
Mice were housed in a pathogen-free environment. All protocols/procedures were approved by the Medical University of South Carolina Institutional Animal Care and Use Committee, and were conducted in accordance with the university guidelines, state and federal regulations, and the standards of the “Guide for the Care and Use of Laboratory Animals.” Animal Welfare Assurance Number on file with the NIH Office of Laboratory Animal Welfare (OLAW) is A3428–01 (Medical University of South Carolina). The Medical University of South Carolina is accredited by the Association for the Assessment and Accreditation of Laboratory Animal Care International (AAALAC, Intl.).
Pooled hippocampal microvessel isolation
Microvessels were isolated per previous protocols36,37 with minor modifications. Briefly, after 4 hours of fasting, mice on either a STD or HFD were euthanized via cervical dislocation. Pooled hippocampal samples from five mice were transferred to a 50 mL Falcon tube filled with 2.5–5 ml of 1x PBS containing protease inhibitor (Roche, Branchburg, NJ). The tissues were minced with a 18, 23, and finally 25-gauge needle/syringe until the media became milky. Cells were then centrifuged at 4000 × g, 4°C for 10 minutes, and the supernatant was removed. Pellets were re-suspended in 30% Dextran (31,390, Sigma-Aldrich Burlington, MA) approximately 25 times at 1:3 pellet:Dextran ratio, and re-centrifuged at 10,000 × g, 4°C for 10 minutes. The myelin layer and supernatant were discarded, and the pellet was re-suspended in 50 µl 1x PBS. Microvessels were then passed through a cell strainer (40 µm, Greiner Bio-one, Monroe, North Carolina) with 500 µl 1x PBS and treated with 20 nM insulin or saline for 15 minutes diluted in the 1x PBS, centrifuged at 10,000 × g, 4°C for 5 minutes. The supernate was discarded and the pellet was re-suspended in 300 µl T-PER with protease inhibitor for analysis. The samples were stored at −80°C until use for western immunoblotting as described below.
Microvascular endothelial cell culture
Primary C57BL/6 mouse brain microvascular endothelial cells (MBECs; C57-6023, Cell Biologics, Chicago, IL) were seeded in 12-well plates coated with Gelatin-Based Coating Solution (6950, Cell Biologics) for cell assays and allowed to grow to 80–90% confluency before treatment. Cells were grown in Complete Mouse Endothelial Cell Medium with supplemental kit (M1168 + kit, Cell Biologics), at 37°C in 5% CO2. All experiments were completed on cell passage 5.
Human cerebral microvascular endothelial cells were isolated from post-mortem brains of donors and transfected with plasmid containing SV40 large T antigen (HBEC-5i; CRL-3245TM, ATCC®, Manassas, VA). Cells were grown in F12: DMEM plus 10% FBS and Endothelial Cell Growth Supplement (356,006, Corning) on 0.1% Gelatin (PCS-999–027, ATCC®). To exclude the effect of growth factors, culture medium was changed to F12:DMEM without serum 4 hours prior to treatment. All experiments were completed on cell passage 4.
All insulin stimulation and inhibitor treatments were performed at 37°C. Hyperinsulinemic conditioning was induced in MBECs by incubating cells for 12 hours in 20 nM human recombinant insulin (I9278, Sigma, St. Louis, MO), and HBEC-5is in 5 nM human recombinant insulin for 12 hours. Time and concentrations for hyperinsulinemic conditioning were determined in pilot studies, data not presented here.
Cell assays and analysis preparation
Human recombinant insulin and 10 µM of Claramine trifluoroacetate (SML1545, Sigma-Aldrich) were diluted directly into culture media. Prior to treatment, cells were washed with warm 1x PBS solution (Corning™ Mediatech™, Tewksbury, MA) and replaced with fresh media for at least 30 minutes. After treatment, media was removed and supplanted with T-PER (Thermo Scientific™, Waltham, MA) + protease inhibitor (Roche), scraped, and stored at −80°C until analysis.
Cell surface receptor biotinylation
Cell surface receptor biotinylation was performed as previously described.38,39 Briefly, following hyperinsulinemic conditioning, cells were washed with cold 1xPBS, and incubated in 0.5 mg/mL EZ-Link™ Sulfo-NHS-SS-Biotin (21,331, ThermoFisher Scientific, Waltham, MA) for 30 minutes at 4°C. Cells were immediately quenched with glycine-HCl, aspirated, and supplanted with 250 µL of T-PER + protease inhibitor and collected. Lysates were incubated at room temperature for 1 hour in Streptavidin Plus UltraLink™ Resin (Pierce™, Waltham, MA), followed by centrifugation at 400 × g for 10 minutes. Supernates, which contain the non-biotinylated (i.e. internalized) receptor pool, were collected. To remove the biotinylation, the pellet was treated in glycine-HCl and vortexed for 10 seconds, followed by 10 minutes of incubation at room temperature. Cells were centrifuged at 4000 × g for 10 minutes, and supernates were collected for analysis.
Stimulation induced biotinylated receptor internalization
Biotinylated receptor internalization analysis was performed as previously described.38,39 Briefly, following hyperinsulinemic conditioning, cells were washed with cold 1xPBS, and incubated in 1 mg/mL EZ-Link™ Sulfo-NHS-SS-Biotin for 15 minutes at 4°C. Cells were immediately washed in cold 1xPBS, and incubated in complete medium containing 20 nM recombinant human insulin for the 5, 15, or 30 minutes. Cells were immediately washed in cold 1xPBS. Cells were then incubated in a glutathione buffer for 10 minutes followed by a rinse in cold 1xPBS. This buffer wash was repeated 3 times in order to cleave extracellular biotin. Finally, cells were supplanted with 200 µL of T-PER + protease inhibitor and collected. A portion of the sample was saved for total protein analysis and western immunoblotting. The rest of the lysates were incubated at room temperature for 1 hour in Streptavidin Plus UltraLink™ Resin, followed by centrifugation at 400 × g for 10 minutes and removal of the supernates. The pellet was resuspended in 1x PBS + protease inhibitors, ready to be processed for protein analysis.
Protein analysis
Lysate preparation
Hippocampal microvessel samples were analyzed for protein concentration utilizing the Pierce Protein Assay in order to ensure equal sample concentration for gel loading. Samples were subjected to sodium dodecyl sulfate (SDS) to make lysates for polyacrylamide electrophoresis and western immunoblotting analysis.
Western immunoblotting
Western immunoblotting was performed per our previously published protocol. 40 Briefly, lysates were separated by SDS-PAGE and transferred to a nitrocellulose membrane. TBS with Tween-20 supplemented with either 5% Milk or 5% BSA was used to block the membranes and to dilute the antibodies. Polyclonal antibodies against protein kinase B (AKT), phosphorylated AKT at serine residue 473 (pAKTS473; Cell Signaling Technology, Danvers, MA), and PTP1B (Abcam, Cambridge, MA), were used at a 1:1000 dilution. Insulin receptor substrate (IRS)1, IRS1 phosphorylated at the serine residue 307 (pIRS1S307; equivalent to human pIRS1S312), insulin receptor (InsR-β), phosphorylated insulin receptor at tyrosine residues 1150/1151 (pInsRY1150/1151; all from Cell Signaling Technology), were used at a 1:750 dilution. The appropriate horseradish peroxidase-conjugated secondary antibodies (Cell Signaling Technology) were used at a 1:2000 dilution. Protein signal quantification was visualized using Clarity Western ECL Substrate (Bio-Rad Laboratory, Hercules, CA), with images captured using ChemiDocTM Imaging System, analyzed by Image Lab software (Bio-Rad Laboratory), and normalized to total lane protein concentrations.
Receptor splice variant analysis
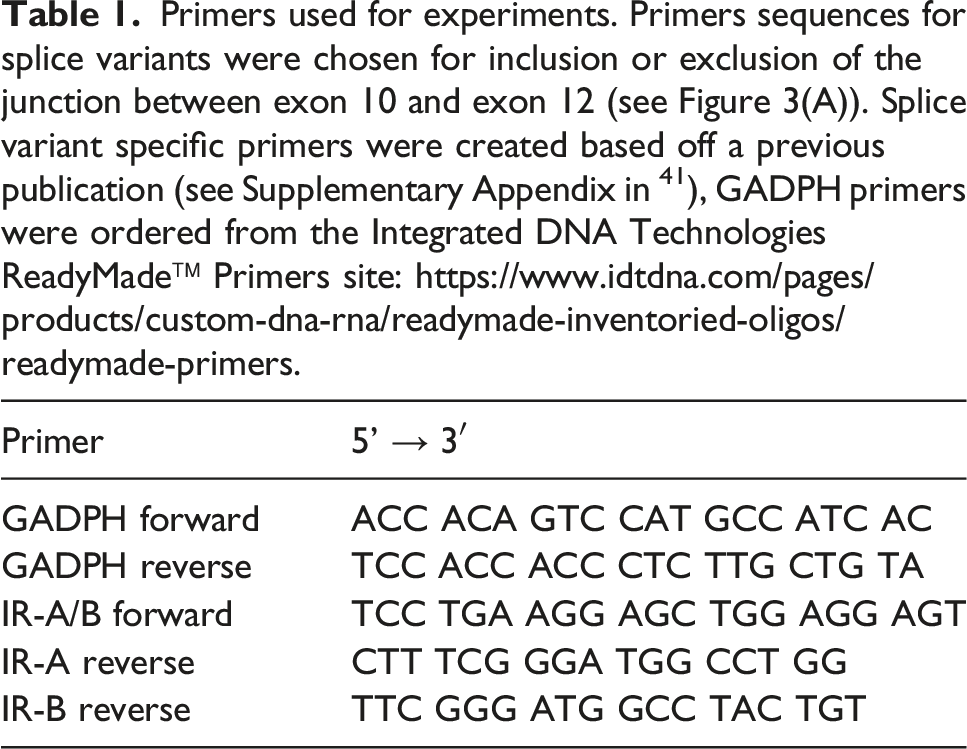
Primers used for experiments. Primers sequences for splice variants were chosen for inclusion or exclusion of the junction between exon 10 and exon 12 (see Figure 3(A)). Splice variant specific primers were created based off a previous publication (see Supplementary Appendix in 41 ), GADPH primers were ordered from the Integrated DNA Technologies ReadyMade™ Primers site: https://www.idtdna.com/pages/products/custom-dna-rna/readymade-inventoried-oligos/readymade-primers.
Statistical analysis
Data analyses were performed using Prism v9 (GraphPad Software, Inc., San Diego, CA). Data was quality checked for outliers using the ROUT outlier analysis (Q = 1%) prior to performing statistical analyses. All data was analyzed via two-tailed t-test except in the following cases. First, the MBEC InsR-β internalization after 15 minutes of stimulation experiment was analyzed using a one-way analysis of variance (ANOVA) with Tukey’s multiple comparisons test. Finally, a one-tailed t-test was performed to detect statistical significance in each insulin receptor internalization group from baseline. All data is represented as mean ± standard error of the mean, and significance was determined using an alpha-level of 0.05. Cell culture sample sizes represent the number of total biological replicates (n) over the number of independent experiments (N).
Results
Total insulin receptor levels are elevated but do not initiate protein kinase b signaling in hippocampal microvessels from high-fat diet mice following stimulation
High-fat diet leads to increased circulating insulin.33,35 We sought to assess the impact of diet on insulin receptor levels and function in the hippocampal microvessels from STD and HFD mice (n = 3 sets of 5 pooled mice/dietary group). Microvessels from HFD mice demonstrate an increase of 117% ± 37% in total insulin receptor levels (Figures 1(A) and (B)) compared to microvessels from STD mice (t (4)= 3.187, p = .0333). Following ex vivo stimulation with 20 nM insulin for 15 minutes, microvessels from HFD mice demonstrate a decrease of 132% ± 34% in pAKTS473/AKT levels compared to stimulated microvessels of STD mice (t (4) = 3.896, p = .0176; Figures 1(C) and (D)). Hippocampal microvessels isolated from high-fat diet mice display increased total insulin receptor levels, which display diminished signaling post-stimulation . (A) Immunoblot and (B) densitometry analysis of insulin receptor (InsR-β) in hippocampal microvessels isolated from mice after 6 weeks of either a standard diet (STD) or a high-fat diet (HFD). (C) Immunoblot and (D) densitometry analysis of protein kinase B (AKT) phosphorylated at serine 473 (pAKTS473), and total AKT following ex vivo stimulation with 20 nM insulin for 15 minutes in microvessels isolated from STD and HFD mice. The dotted line represents baseline values for respective, non-insulin stimulated groups. Data was analyzed via two-tailed t-test, with 5 pooled mouse hippocampi per experiment, n = 3, ✱p < .05, ✱✱p < .01. All images were normalized to total gel protein concentrations shown as “Stain free gel”, calculated in Image Lab software per the manufacturer’s instructions. Line down center of immunoblot indicates a break in the blot; images are from the same immunoblot for each figure and received identical formatting.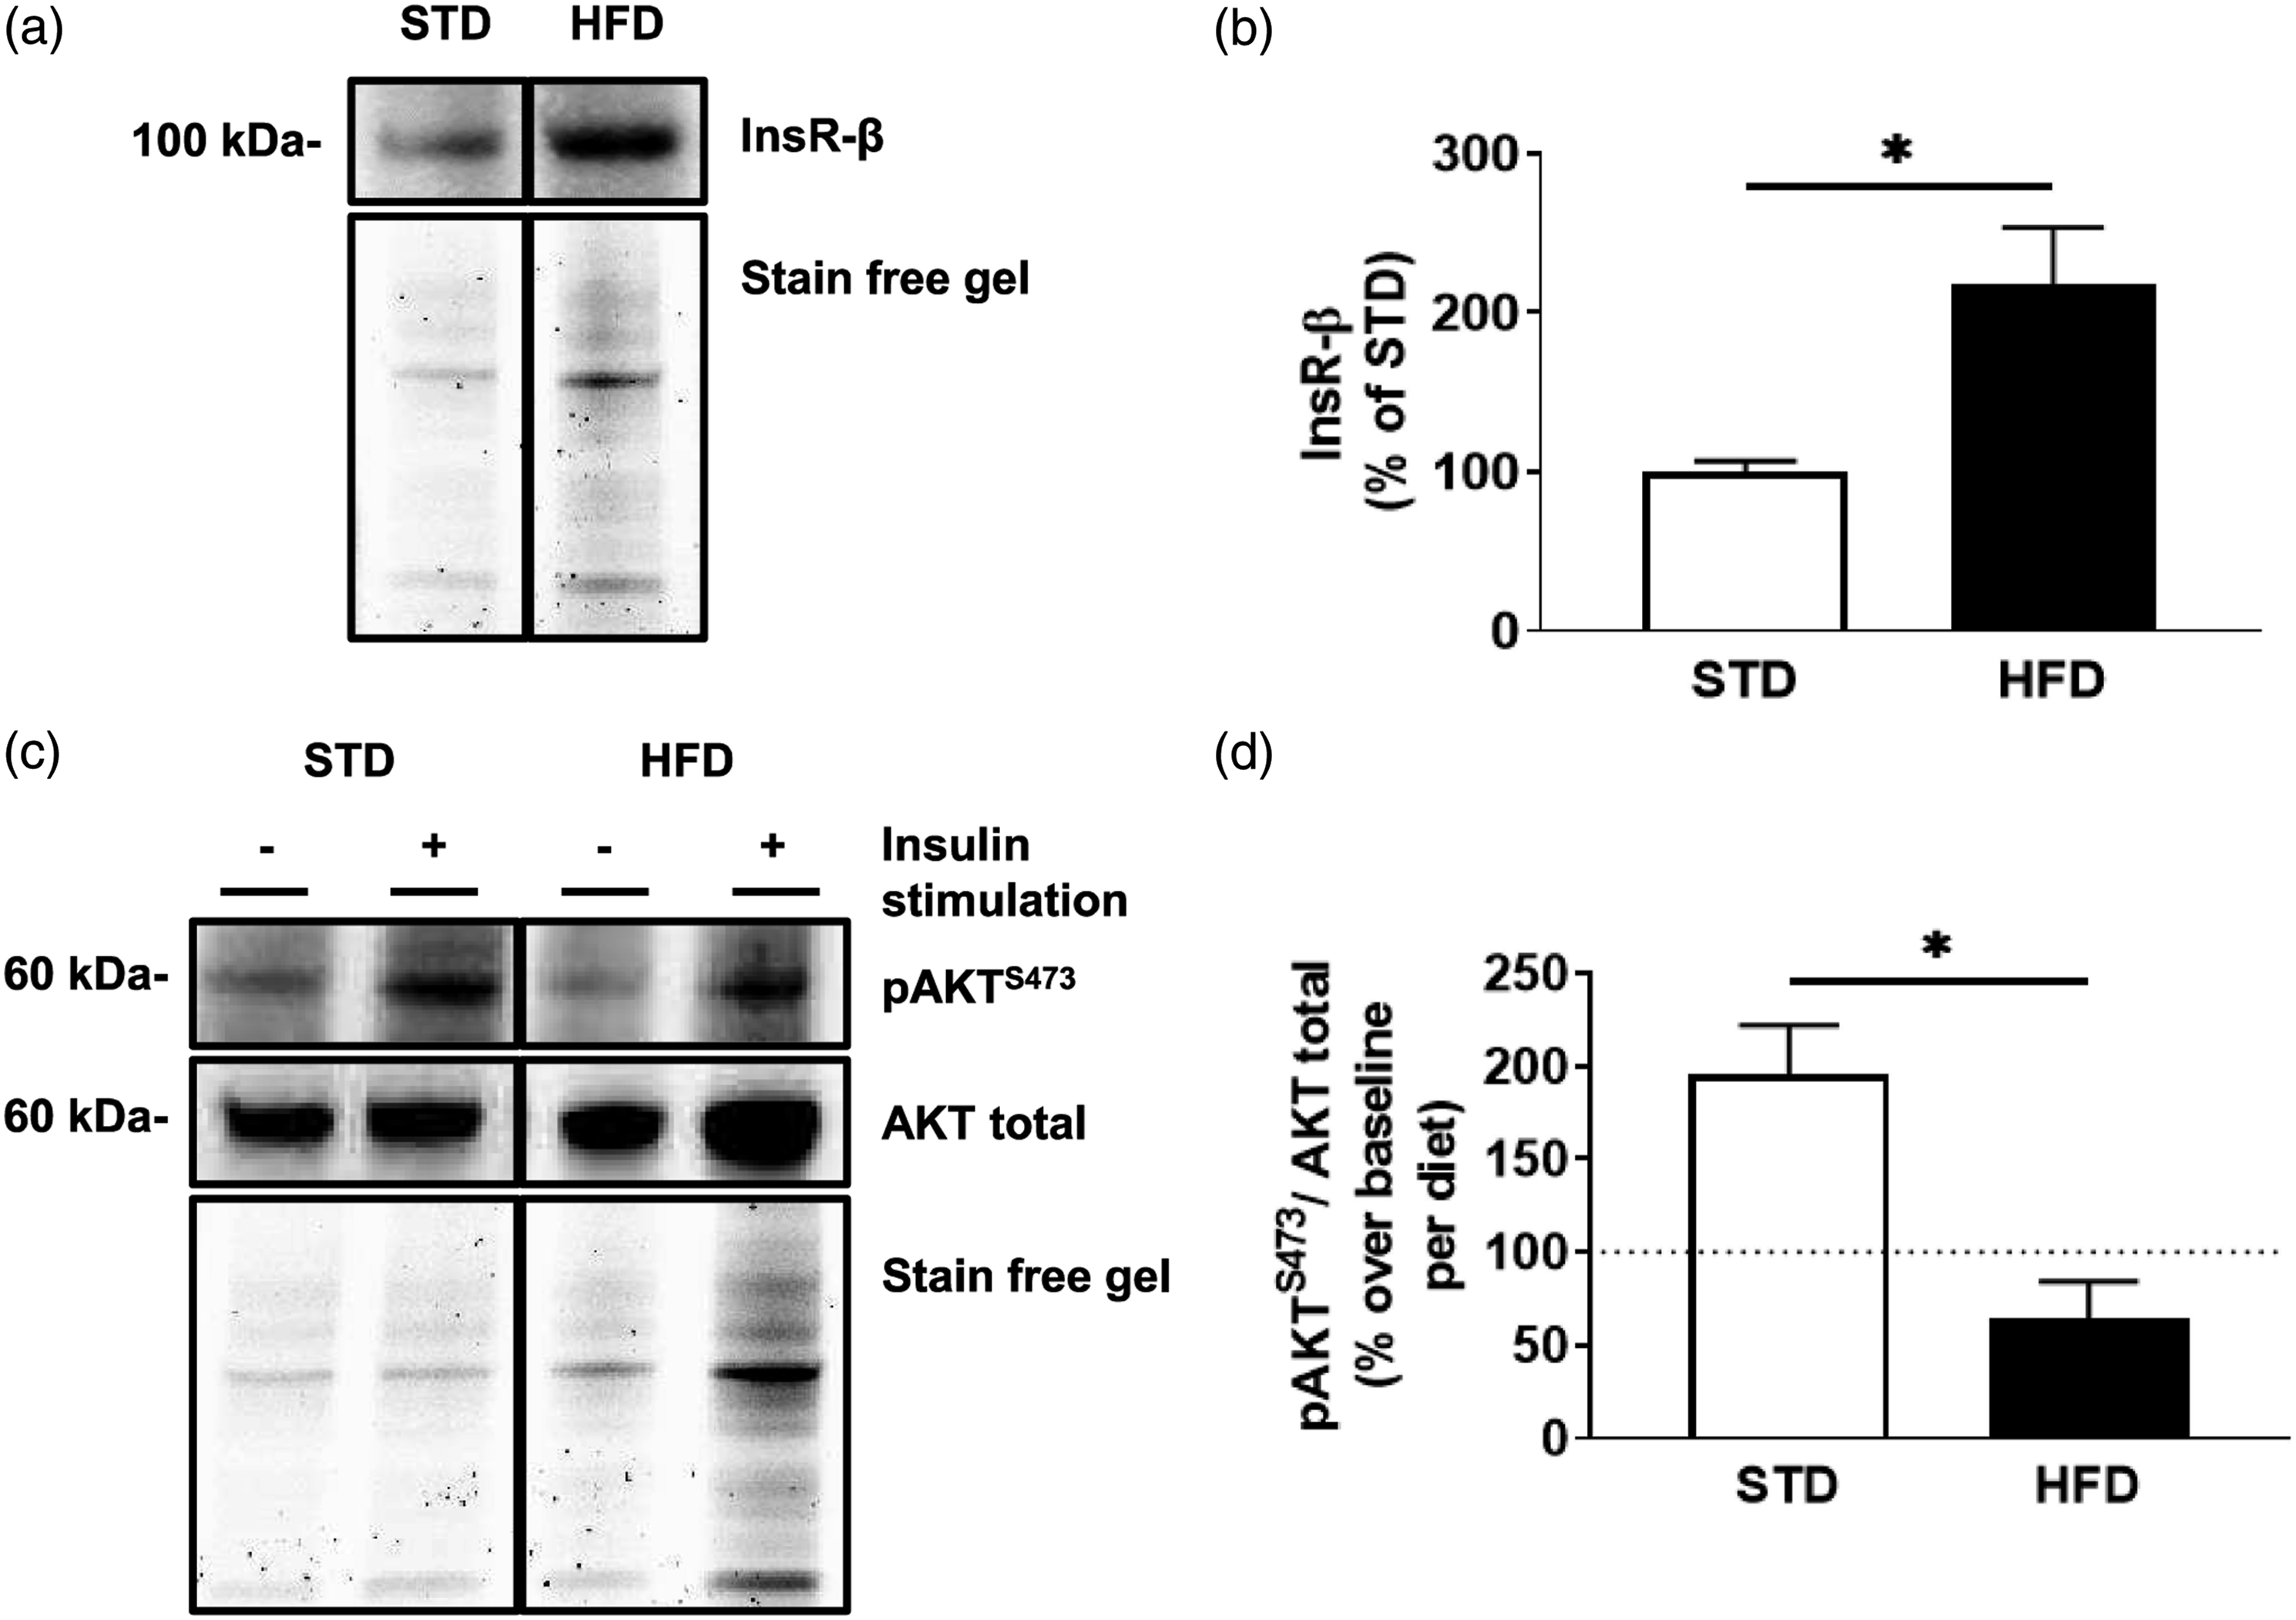
Insulin receptor levels are elevated and exhibit reduced insulin signaling in brain endothelial cells following experimental hyperinsulinemia
Given that microvessels contain multiple cell types, we assessed the impact of hyperinsulinemia on insulin receptor levels and function in primary mouse brain endothelial cells (MBECs; n = 9–12/group, N = 4). Indeed, MBECs treated with experimental hyperinsulinemia demonstrate a significant increase of 263% ± 78% in total insulin receptors compared to untreated MBECs (t (21)= 3.384, p = .0028; Figures 2(A) and (B)). Further, analysis of the IRS1 protein demonstrates that hyperinsulinemic treatment of MBECs exhibit a significant increase in serine phosphorylation by 281% ± 92% compared to untreated MBECs (t (19)= 3.043, p = .0067; Figure 2(A) and (C). Experimentally hyperinsulinemic microvascular brain endothelial cells exhibit increased insulin receptors and serine phosphorylated IRS1. (A) Immunoblots and densitometry analysis for (B) total insulin receptor (InsR-β), and (C) insulin receptor substrate 1 (IRS)1 phosphorylated at the 307 residue (pIRS1S307)/IRS1 total, in mouse brain microvascular endothelial cells (MBECs) that are untreated (non-HI) or treated in hyperinsulinemic conditions for 12 h (HI). (D) Immunoblots and densitometry analysis for (E) total InsR-β, and (F) IRS1 phosphorylated at the 312 residue (pIRS1S312; the human equivalent of mouse S307)/IRS1 total, in non-HI or HI human immortalized brain microvascular endothelial cells (HBEC-5is). Data was analyzed via two-tailed t-test, n = 9–12/group, N = 4 (MBECs) and n = 7–10, N = 4 (HBEC-5is), ✱p < .05, ✱✱p < .01. All images were normalized to total gel protein concentrations shown as “Stain free gel”, calculated in Image Lab software per the manufacturer’s instructions. Line down center of immunoblot indicates a break in the blot; images are from the same immunoblot for each figure and received identical formatting.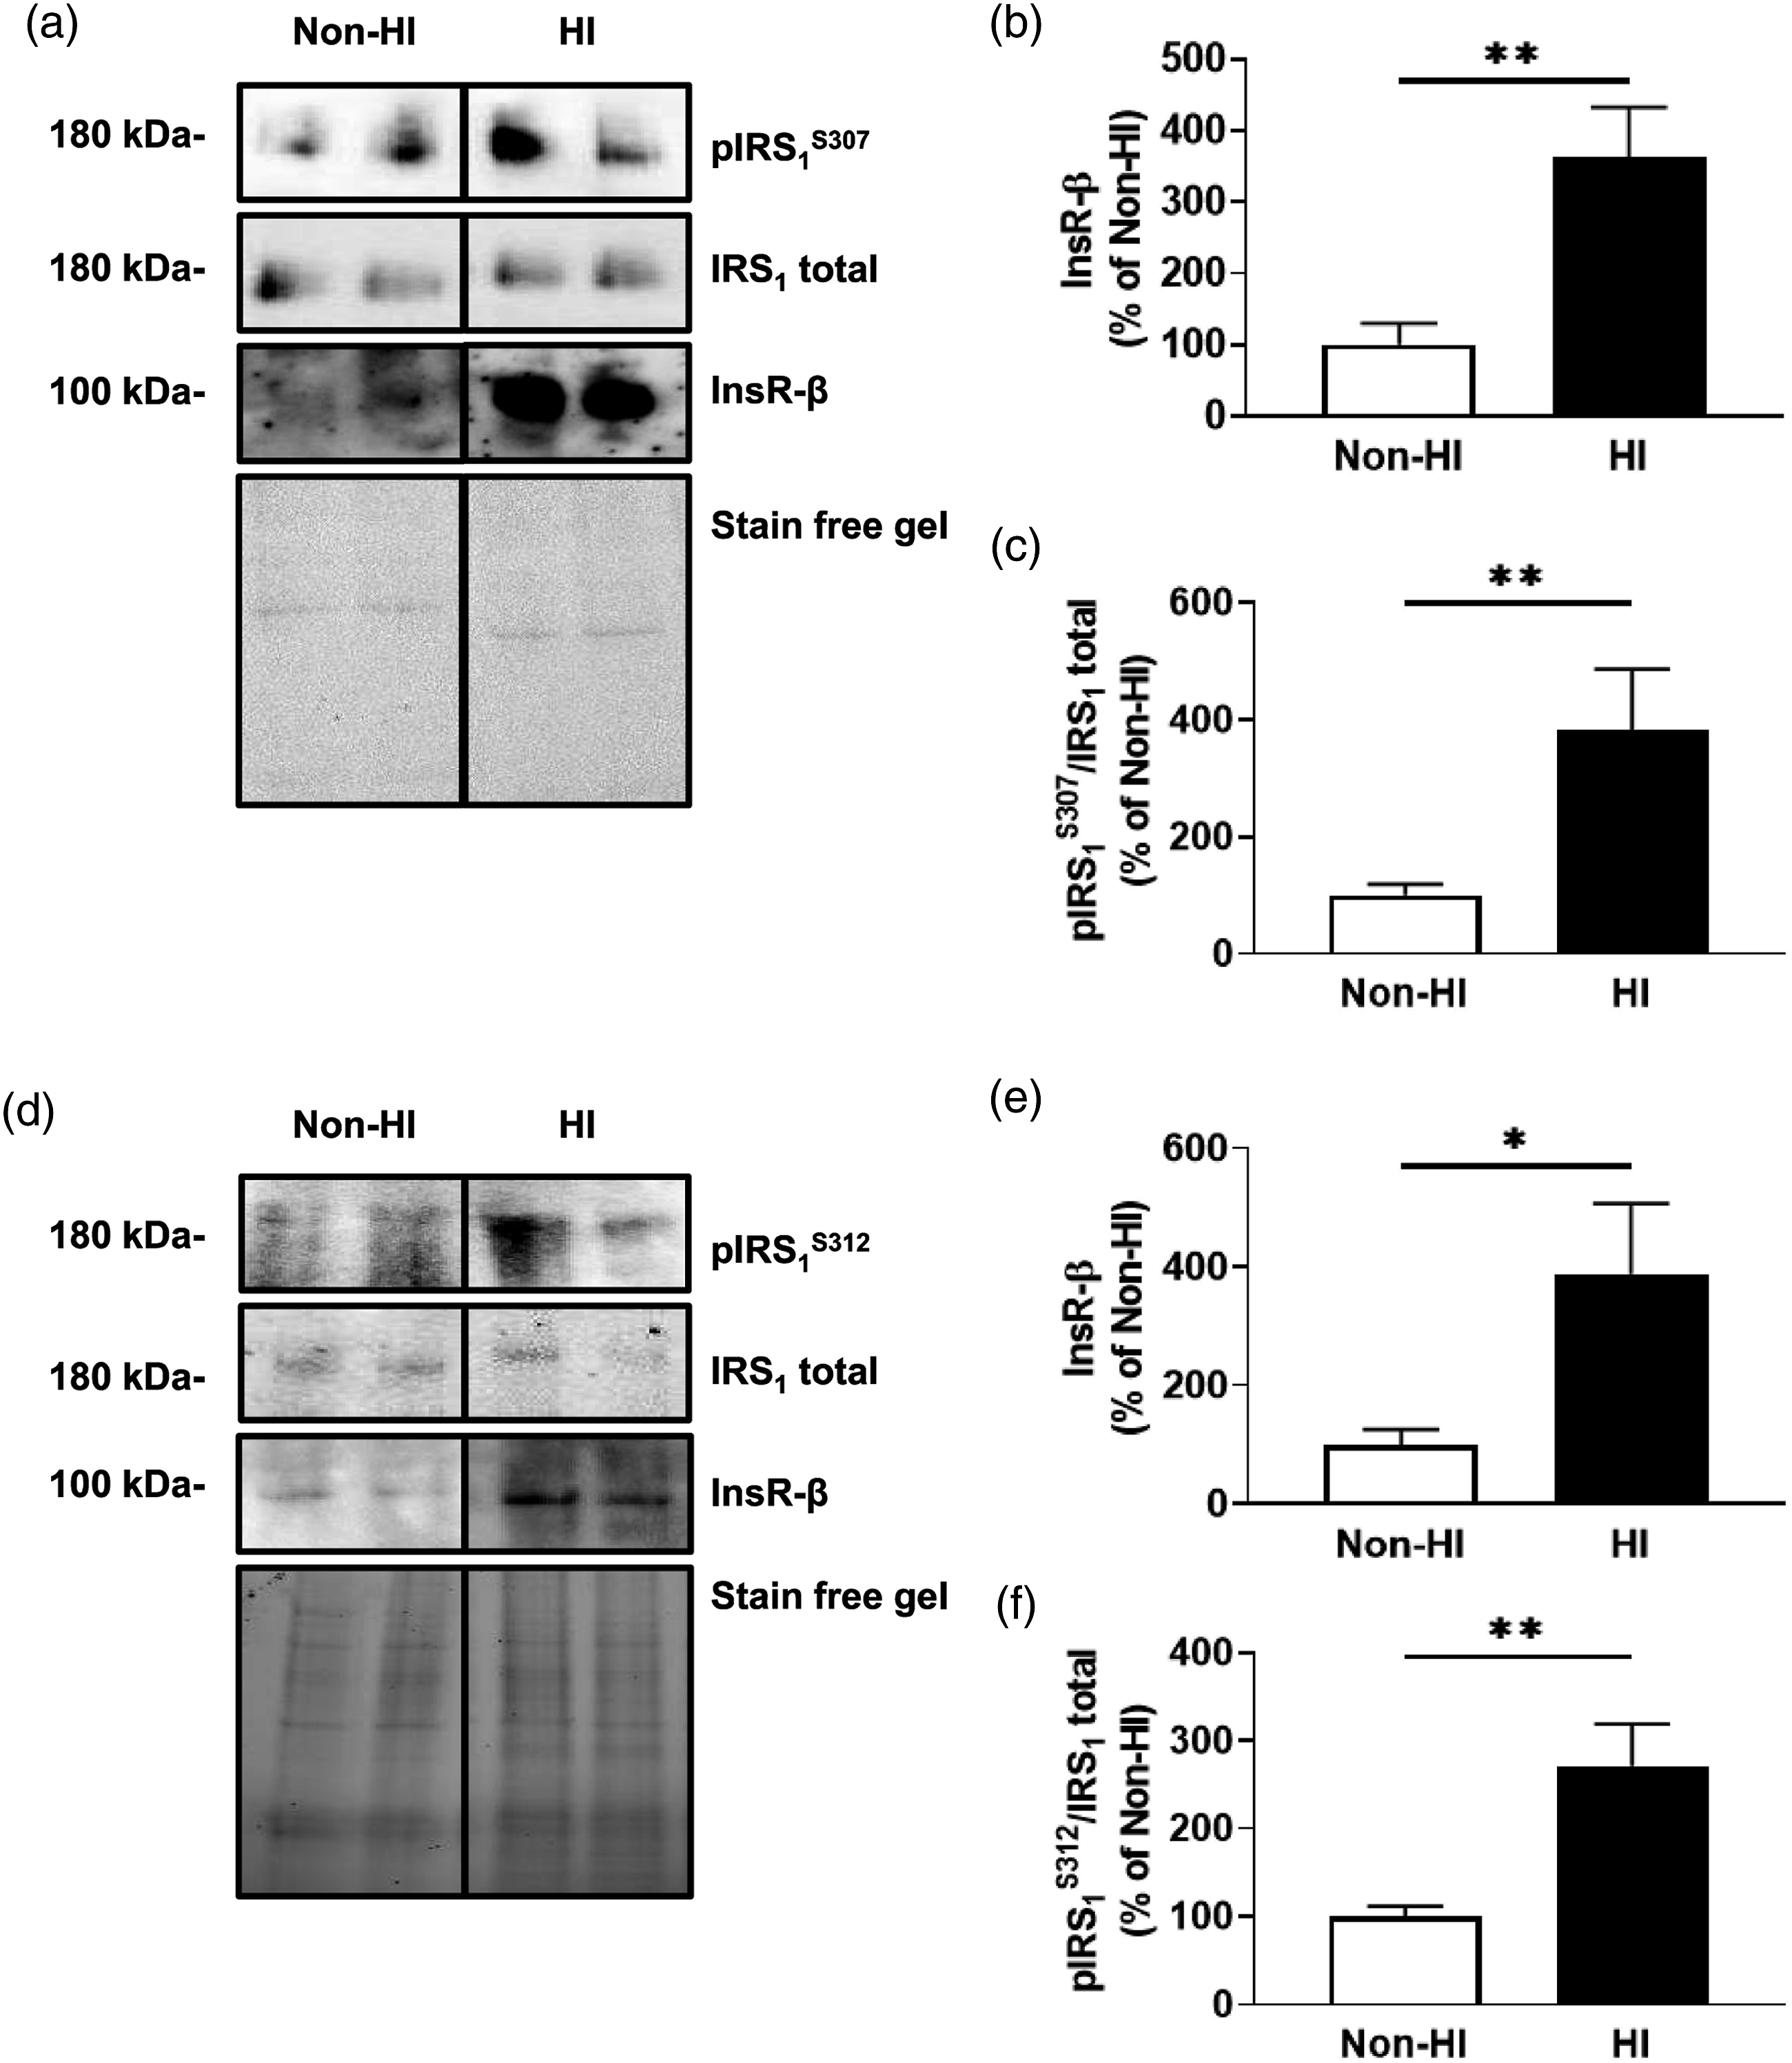
We also confirmed these findings in human cerebral microvascular endothelial cells (HBEC-5is, n = 7–10, N = 4). HBEC-5is treated with experimental hyperinsulinemia demonstrate a significant increase of 288% ± 135% in total insulin receptors compared to untreated HBEC-5is (t (16)= 2.129, p = .0491; Figures 2(D) and (E)). Further, analysis of the IRS1 protein demonstrates that hyperinsulinemic treatment of HBEC-5is exhibit a significant increase in serine phosphorylation by 171% ± 49% compared to untreated HBEC-5is (t (12)= 3.439, p = .0044; Figure 2(D) and (F)).
Hyperinsulinemia leads to differential receptor splice variation
We next sought to examine whether hyperinsulinemia had an impact on receptor splice variation through RT-qPCR quantification of both receptor isoforms A (IR-A) and B (IR-B) in MBECs (n = 5–8, N = 3). Our data indicate that MBECs treated with experimental hyperinsulinemia demonstrate a significant decrease of 89% ± 36% in IR-A mRNA levels compared to untreated MBECs (t (12)= 2.474, p < .0293; Figure 3(B)); however there were no significant differences in IR-B mRNA levels (Figure 3(C)). This translated to a significant decrease of 19% ± 7% in IR-A/(IR-A + IR-B) mRNA ratios (t (11)= 2.591, p = .0251; Figure 3(D)) and a significant overall decrease of 79% ± 36% in total insulin receptor mRNA (t (11)= 2.219, p = .0485; Figure 3(E)) for MBECs treated with experimental hyperinsulinemia compared to untreated MBECs. Experimentally hyperinsulinemic brain endothelial cells demonstrate a decrease in IR-A splice variant expression. Diagram of RT-qPCR primer design for insulin receptor isoforms A and B (IR-A and IR-B, respectively), using exons 10–12 of the mouse insulin receptor coding region. Primers (Table 1) were designed specifically for each isoform. Calculated 2(−ΔΔCt) values for (B) IR-A and (C) IR-B in mouse brain microvascular endothelial cells (MBECs) that are untreated (non-HI) or treated with experimental hyperinsulinemic conditions for 12 h (HI), normalized to non-HI. (D) Ratio of the 2(−ΔΔCt) values for IR-A to total insulin receptor mRNA in non-HI and HI MBECs, normalized to non-HI. (C) Total insulin receptor mRNA levels in non-HI and HI MBECs, normalized to non-HI. (B–E) Data analyzed via two-tailed t-test between non-HI and HI MBECs, n = 5–8/group, N = 3; ✱p < .05. GADPH was used as internal control for all RT-qPCR experiments.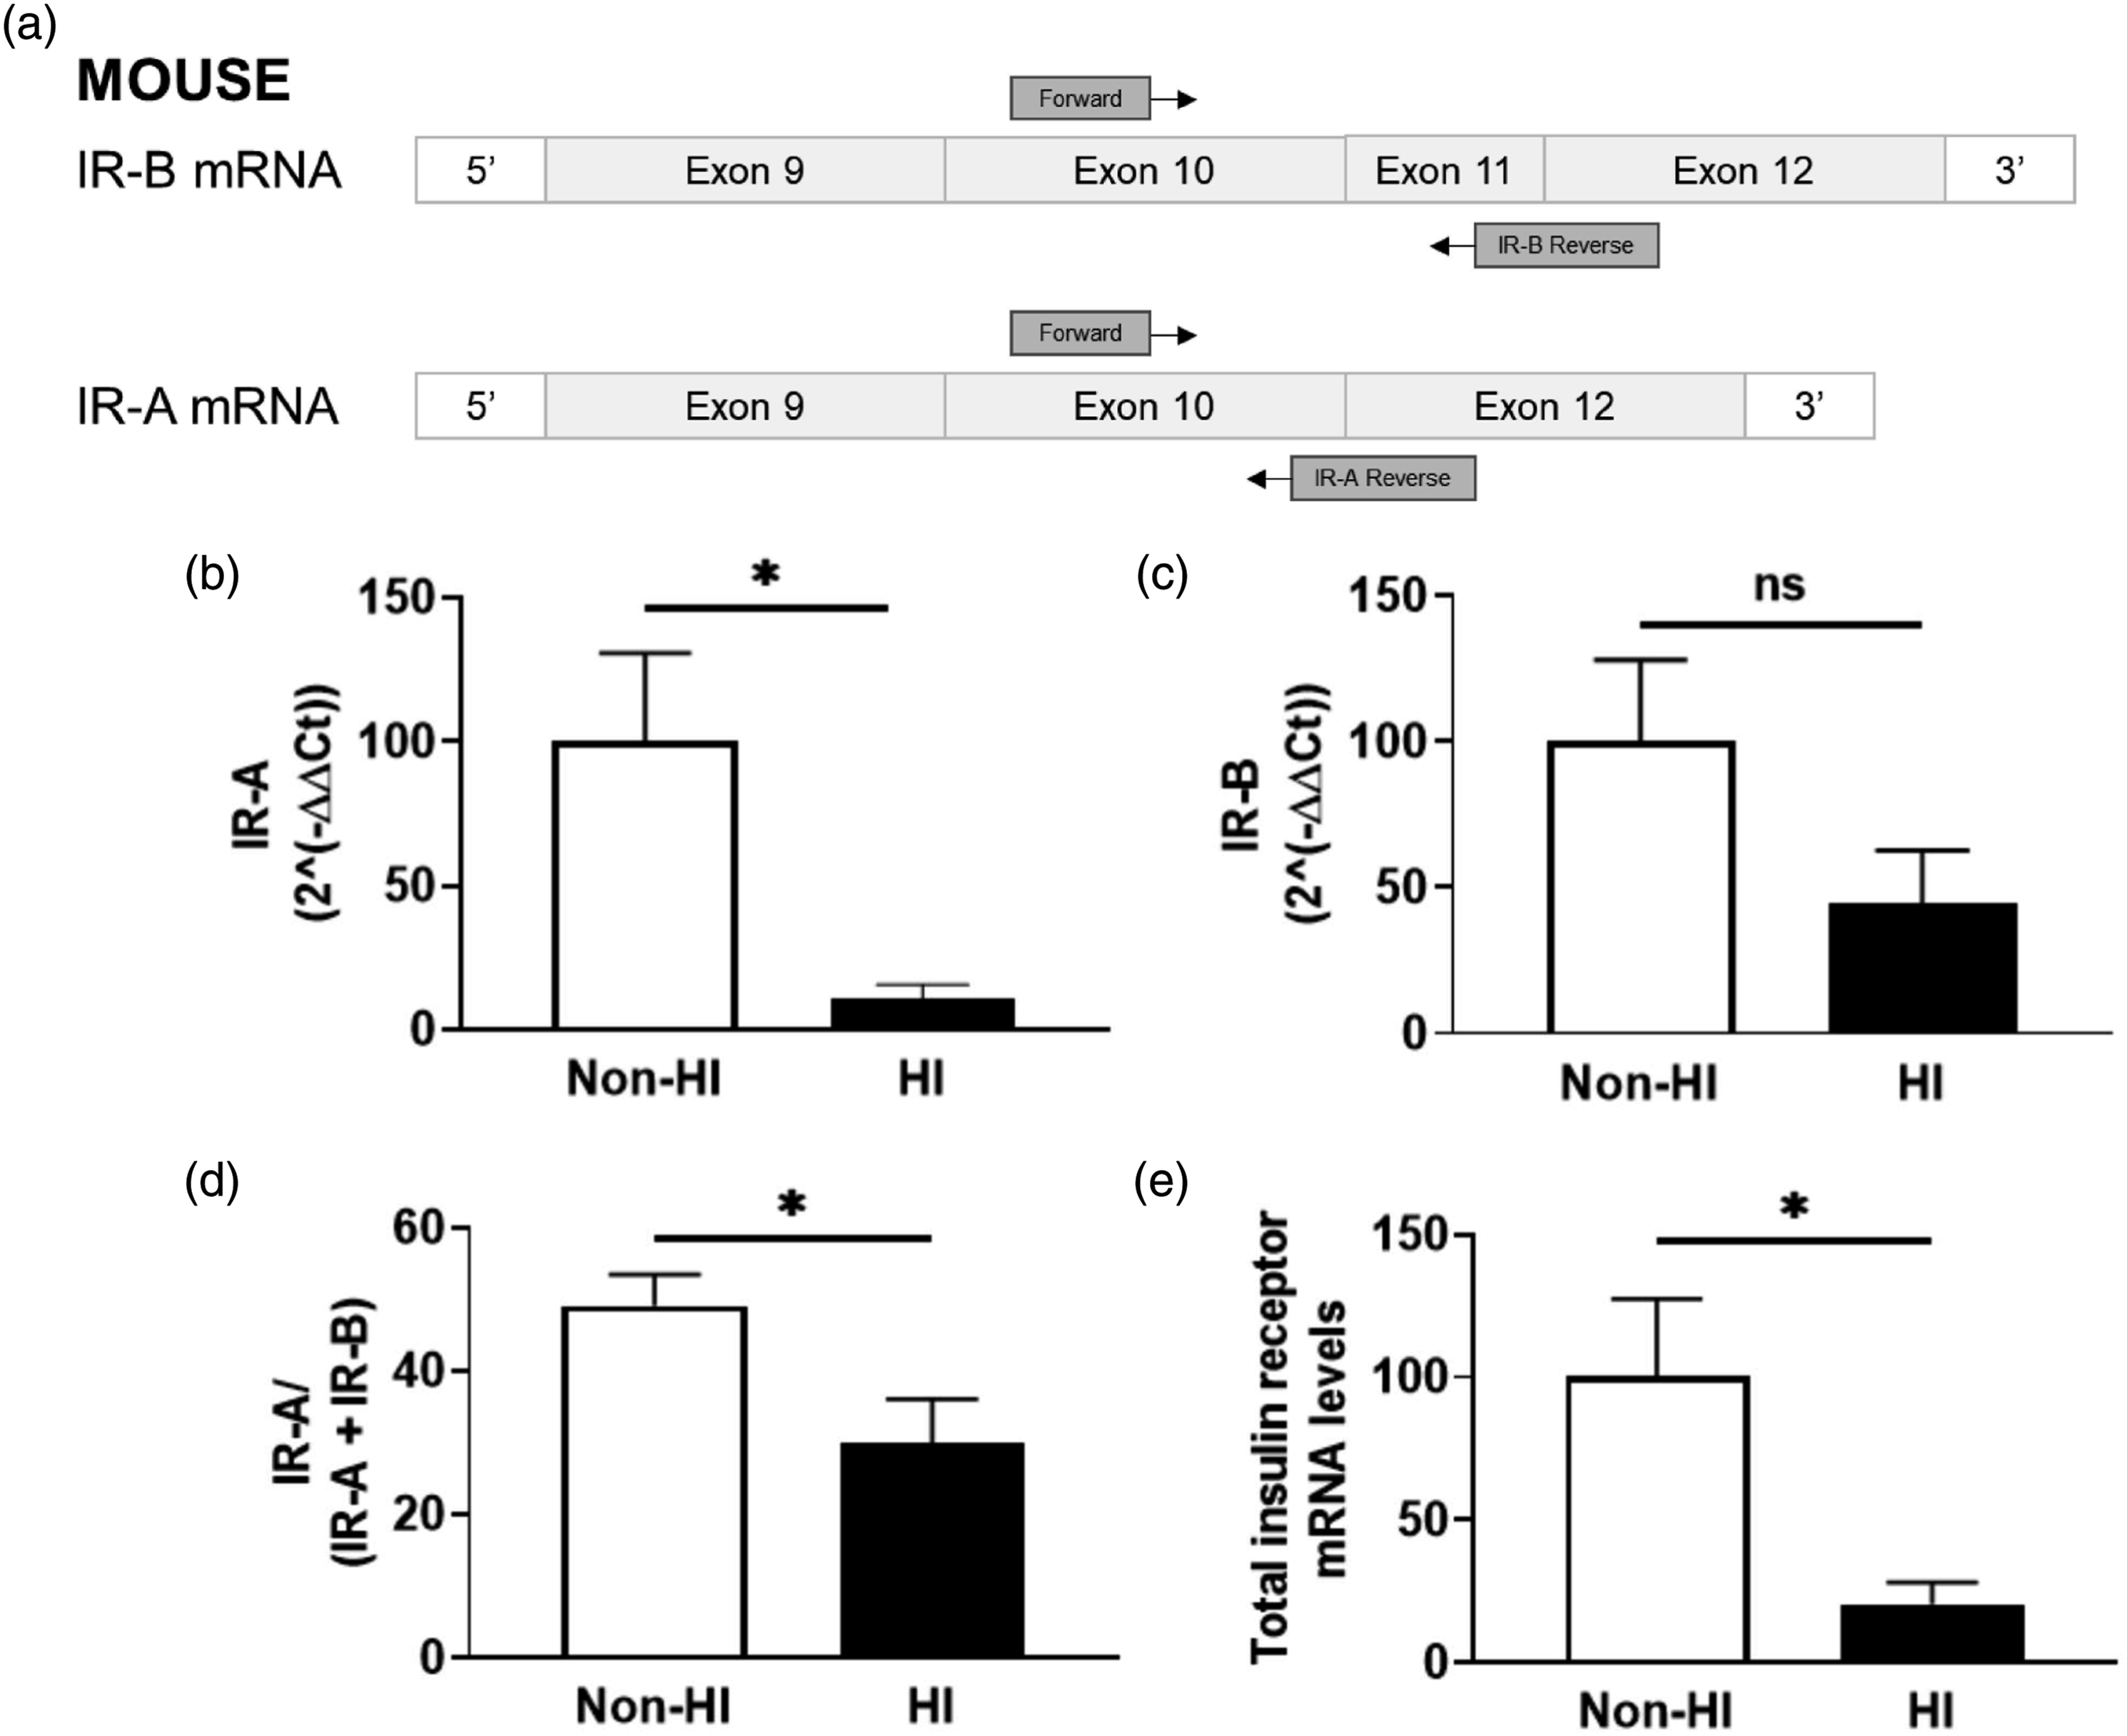
Hyperinsulinemic MBEC insulin receptors demonstrate reduced internalization and insulin signaling following insulin stimulation
Given that the insulin receptor isoform may impact receptor internalization, we assessed the insulin receptor internalization in MBECs (n = 6–9/group, N = 3–4). A two-way ANOVA indicates a significant effect of time (F (3, 52)= 3.501, p = .0217) and hyperinsulinemic treatment (F (1, 52)= 7.175, p = .0099). A Bonferroni’s multiple comparison revealed significant internalized insulin receptors at 15 minutes (p = .0342) and 30 minutes (p = .0136) after stimulating with insulin in MBECs. There was no apparent insulin receptor internalization in the MBECs treated with hyperinsulinemia (HI) at any timepoint post-stimulation (Supp. Figure 1).
We then sought to understand how this impacted downstream insulin receptor phosphorylation and internalization. MBECs treated with experimental hyperinsulinemia display a significant increase of 384% ± 162% in membrane insulin receptor levels of compared to untreated MBECs (t (12)= 2.373, p = .0352; Figures 4(A) and (B)). To assess downstream signaling, non-hyperinsulinemic and HI cells were stimulated with 20 nM insulin for 15 minutes to probe for autophosphorylation of the insulin receptor and downstream AKT phosphorylation. Following insulin stimulation, MBECs treated with experimental hyperinsulinemia display a significant decrease of 117% ± 29% in phosphorylated insulin receptor/total insulin receptor compared to untreated MBECs, normalized to non-stimulated control groups for each (t (14)= 4.085, p = .0011; Figures 4(C) and (D)). This coincided with a significant decrease of 106% ± 48% in phosphorylated AKT/total AKT compared to untreated MBECs, normalized to non-stimulated control groups for each (t (12)= 2.188, p = .0492; Figures 4(E) and (F)). Hyperinsulinemic MBECs do not stimulate downstream signaling via tyrosine autophosphorylation despite having increased membrane insulin receptor levels. (A) Immunoblots and (B) densitometry analysis for insulin receptor (InsR-β) tagged on the membrane and untagged InsR-β mouse brain microvascular endothelial cells (MBECs) treated with experimental hyperinsulinemic conditions for 12 h (HI), and untreated MBECS (non-HI). Data represented as % of total InsR-β per group. (C) Immunoblot and (D) densitometry analysis for tyrosine phosphorylated InsR-β at the 1150/1151 residues (pInsR-βY1150/1151). (E) Immunoblots and (F) densitometry analysis for protein kinase B (AKT) phosphorylated at serine residue 473 (pAKTS473) and AKT total following 20 nM insulin stimulation for 15 minutes. The dotted line represents baseline values for respective, non-insulin stimulated groups. Data was analyzed via two-tailed t-test, n = 6–9/group, N = 3–4; ✱p < .05, ✱✱p < .01. All images were normalized to total gel protein concentrations shown as “Stain free gel”, calculated in Image Lab software per the manufacturer’s instructions.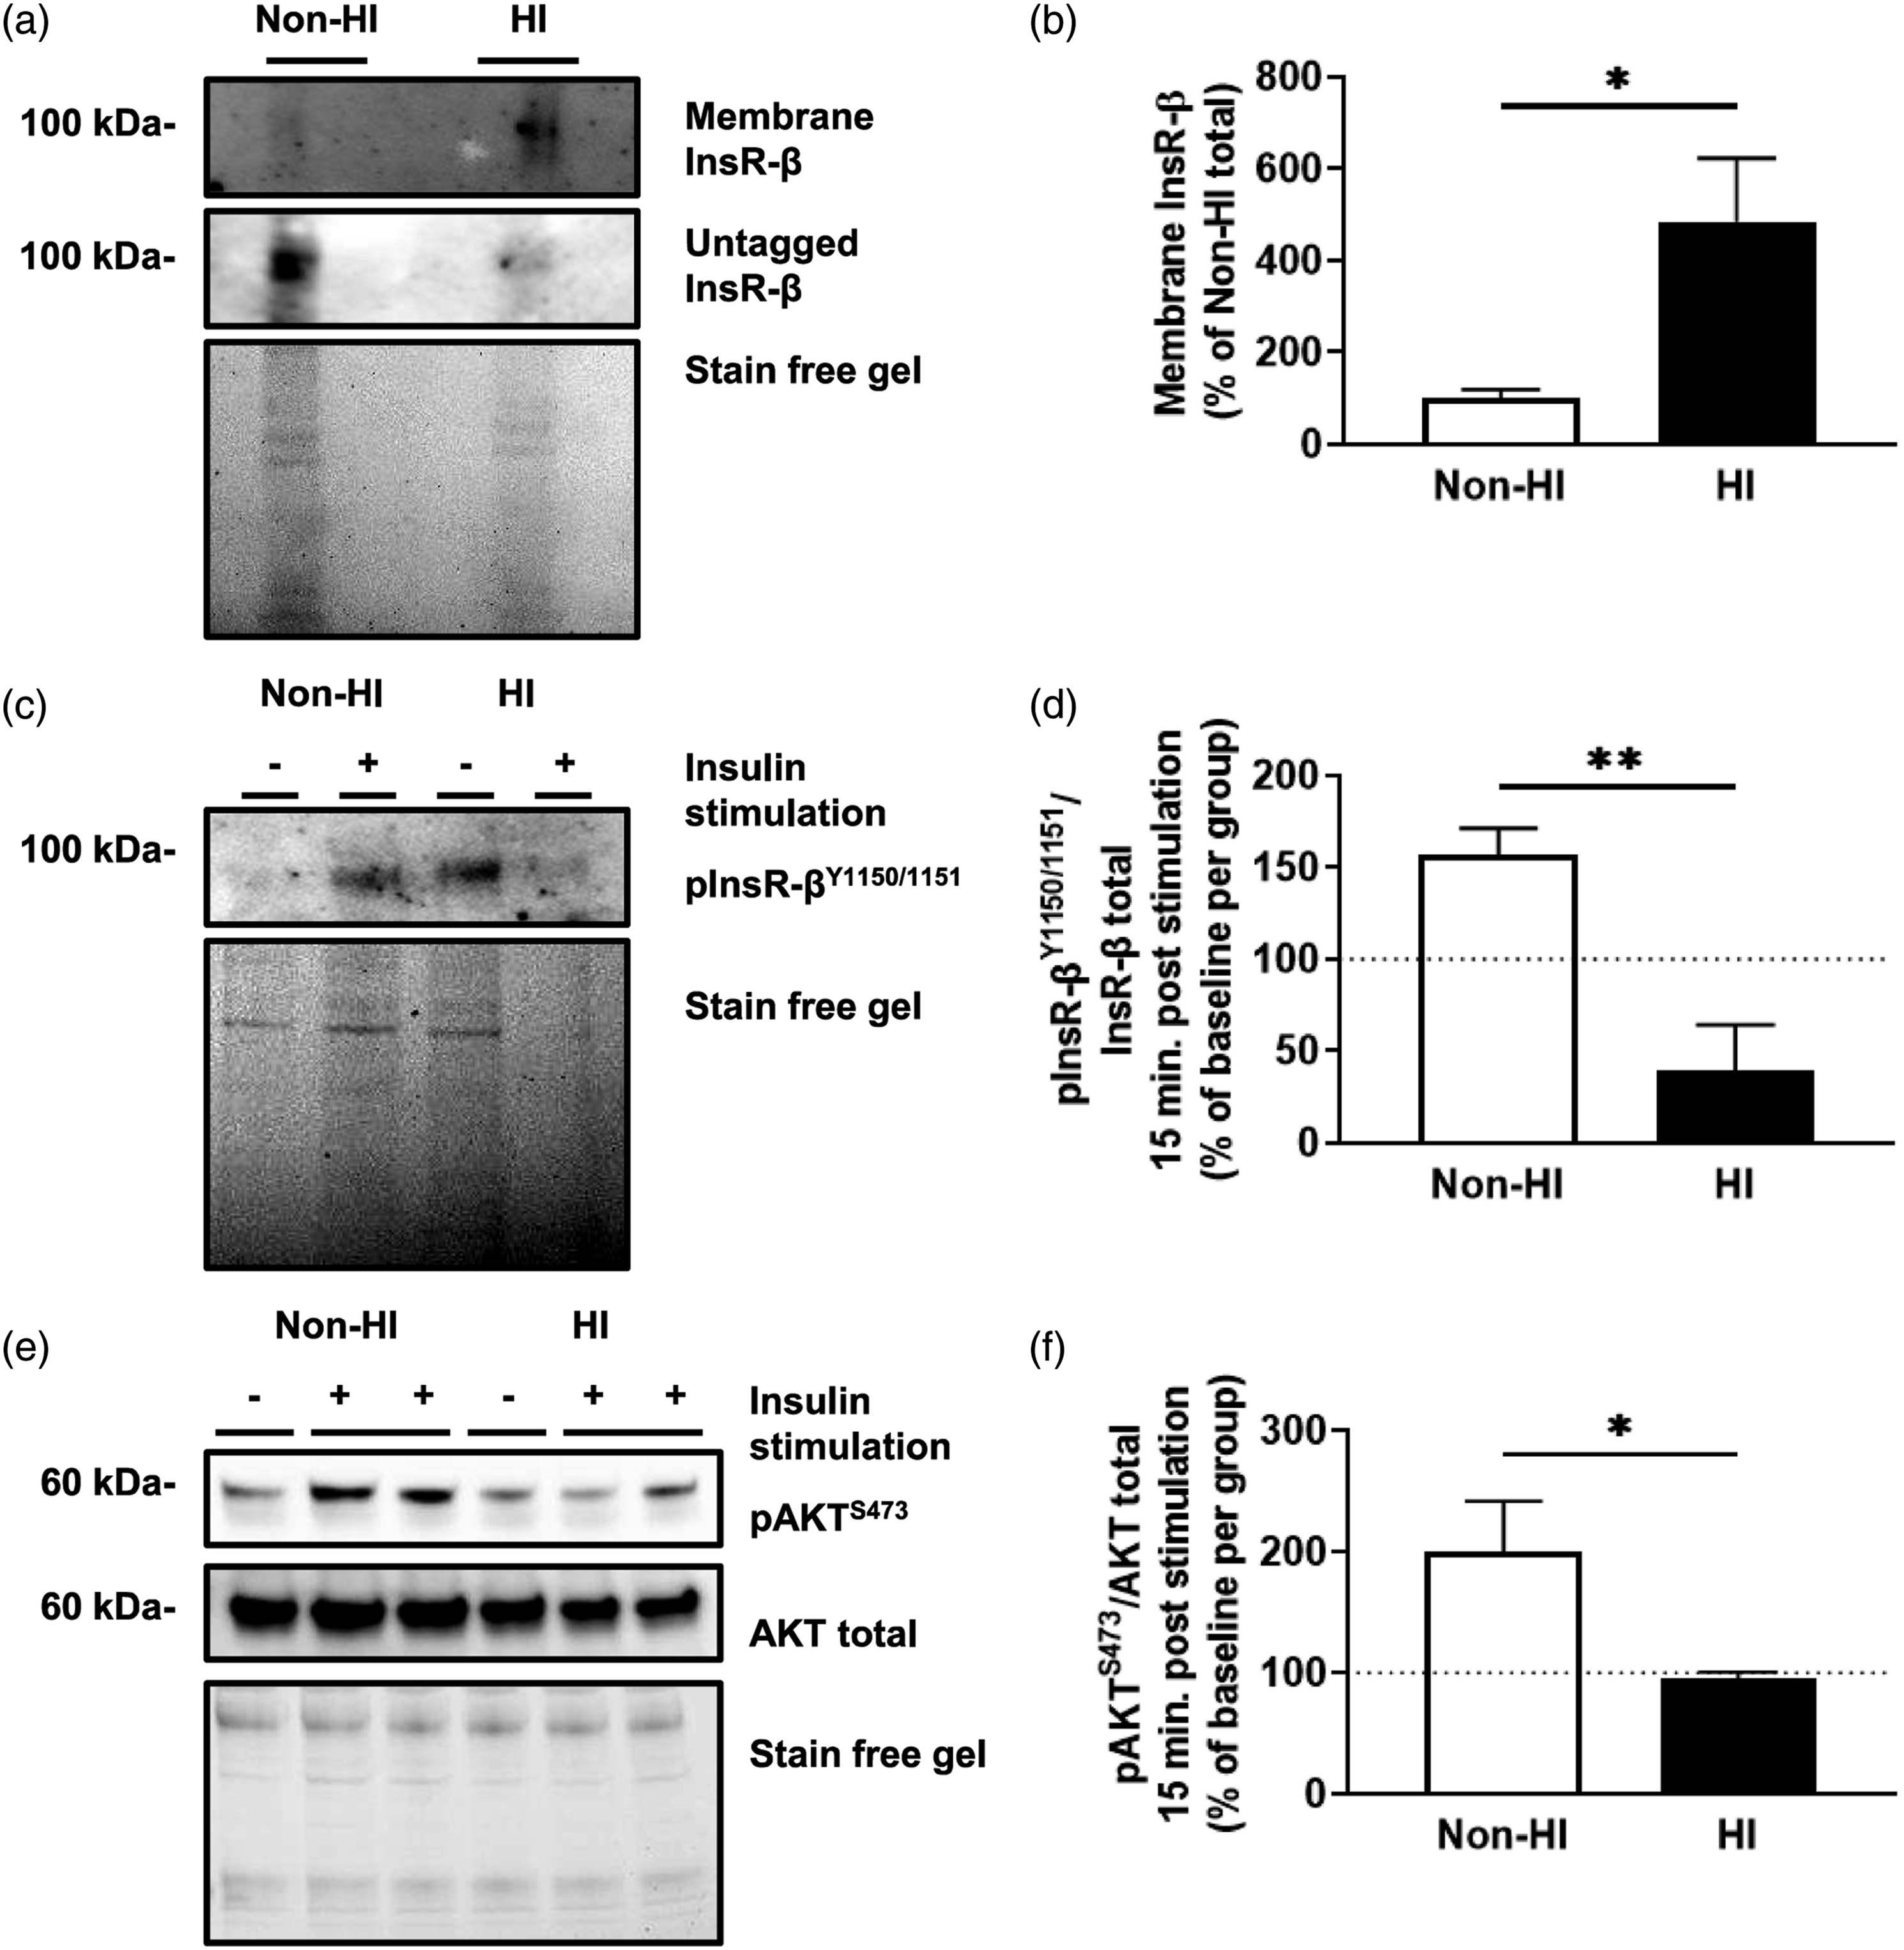
Selective inhibition of PTP1B improves insulin receptor signaling and internalization
Given the decrease in insulin receptor tyrosine phosphorylation under hyperinsulinemic conditions, we next sought to assess whether Claramine, a selective PTP1B inhibitor, could reverse the effects of MBECs treated with hyperinsulinemia when stimulated with insulin for 15 minutes (n = 4–16/group; N = 2–4). Treatment of hyperinsulinemic MBECs with Claramine 30 minutes prior to insulin stimulation significantly reduced PTP1B levels by 22% ± 6% compared to untreated, insulin-stimulated hyperinsulinemic MBECs, normalized to non-stimulated hyperinsulinemic MBECs (t (6)= 3.778, p = .0092); Figures 5(A) and (B)). Claramine treatment also led to a significant increase of 35% ± 14% in phosphorylated insulin receptor/total insulin receptor (t (6)= 2.521, p = .0452); Figures 5(C) and (D)) and a significant increase of 103% ± 46% in phosphorylated AKT/total AKT compared to untreated, insulin-stimulated hyperinsulinemic MBECs, normalized to the non-stimulated hyperinsulinemic (t (26)= 2.253, p = .0329; Figure 5(C) and (E)). When we probed for internalization capacity following insulin-stimulation, we demonstrate a significant difference in internalization between untreated MBECs, MBECS treated with hyperinsulinemia, and MBECs treated with hyperinsulinemia and Claramine (F (1,17)= 3.921, p = .0398). Tukey’s post-hoc comparison indicates increased internalization between untreated MBECs and MBECS treated with hyperinsulinemia by 359% ± 133% (p = .0380; Figures 5(F) and (G)). One sample t-tests indicate a significant increase in insulin receptor internalization (t (7)= 3.692, p = .0077) from unstimulated internalized insulin receptor levels (baseline set to 100%) in the Non-HI group by 434% ± 117%, and a significant increase in insulin receptor internalization (t (5)= 3.251, p = .0227) from baseline in the HI + Claramine group by 192% ± 145% following 15 minutes of insulin stimulation. Claramine treatment restores insulin receptor signaling and improves receptor internalization. (A) Immunoblots and (B) densitometry analysis for PTP1B in mouse brain microvascular endothelial cells (MBECs) treated with just experimental hyperinsulinemic conditions for 12 h (HI), HI MBECs stimulated for 15 minutes with 20 nM insulin stimulation (HI +), and HI pre-treated with 10 µM Claramine (HI + Claramine) for 30 minutes before stimulation with insulin. (C) Immunoblots and densitometry analysis for (D) insulin receptor (InsR-β) phosphorylated at the 1150/1151 tyrosine residues (pInsR-βY1150/1151) and total InsR-β, and (E) protein kinase B (AKT) phosphorylated at serine residue 473 (pAKTS473) and total AKT for HI MBECs, HI + MBECs, and HI + Claramine MBECs. (F) Immunoblots and (G) densitometry for internalized InsR-β at baseline and internalized InsR-β after 15 minutes of 20 nM insulin stimulation in untreated MBECs (non-HI), HI MBECs, and HI + Claramine MBECs. The dotted line represents baseline values for respective, non-insulin stimulated groups. (A–E) Data was analyzed via two-tailed t-test, n = 4–12/group, N = 2–4; ✱p < .05, ✱✱p < .01. (F–G) Data analyzed via a one-tailed t-test to group baselines and a one-way ANOVA with Tukey’s multiple comparisons, n = 6–8/group, N = 4; ✱p < .05, ✱✱p < .01. All images were normalized to total gel protein concentrations shown as “Stain free gel”, calculated in Image Lab software per the manufacturer’s instructions. Line down center of immunoblot indicates a break in the blot; images are from the same immunoblot for each figure and received identical formatting.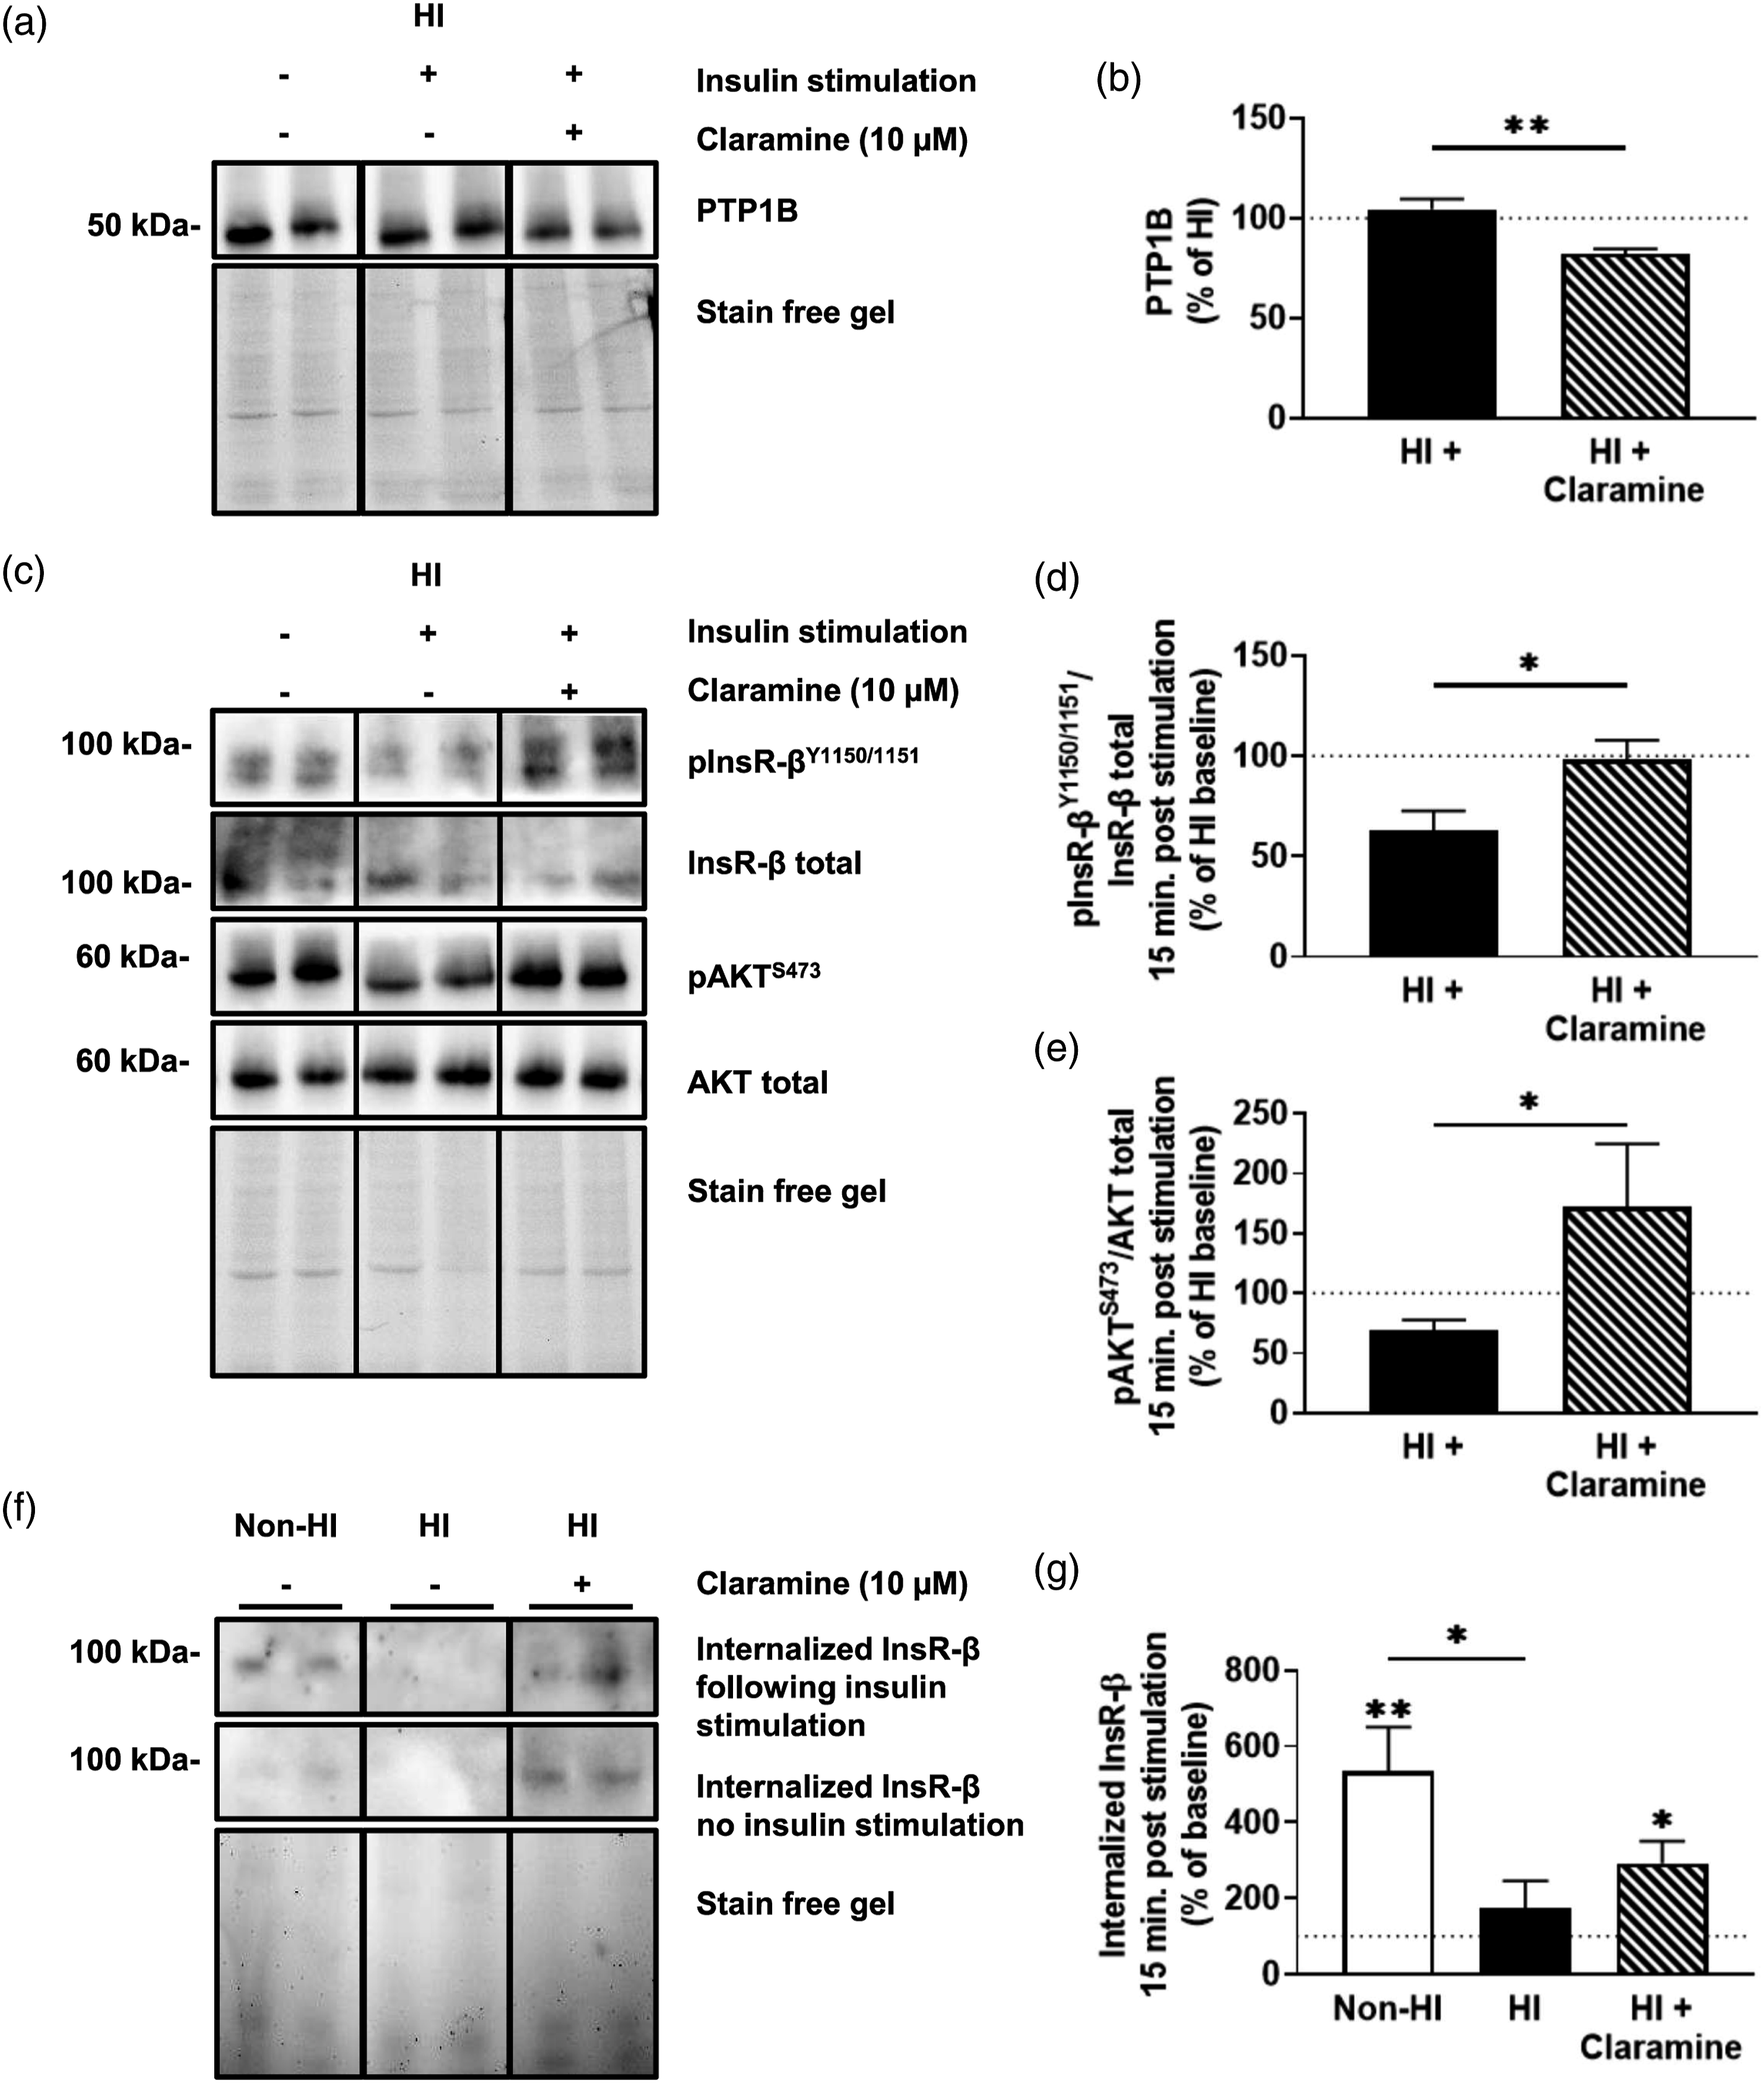
Discussion
Microvascular dysfunction is a potential underlying mechanism linking obesity and cognitive impairment that has garnered more attention over the past decade. The brain microvasculature is a unique subset of the vascular system known as the blood-brain barrier which maintains relative exclusivity of the brain from circulating substances. 5 The brain microvascular endothelial cells play a significant role in mediating the transport of substances, including hormones, across the blood-brain barrier. For example, insulin must cross the blood-brain barrier for delivery to tissues such as the hippocampus for normal function and signaling. It is well known that diet-induced hyperinsulinemia leads to a decrease in the transport of insulin across the blood brain barrier.21,42,43 Currently, it is controversial how this transport occurs, whether it is via a paracellular route 44 or via internalization of the insulin/insulin receptor. Hence, the goal of this current study was to understand the impact obesity plays on insulin receptor functioning within the brain microvascular endothelium. Our primary findings indicate that high-fat diet leads to increased total insulin receptor levels in brain microvasculature, which display impaired signaling capacity post insulin stimulation. We replicated this increase in insulin receptor levels and reduced signaling with experimentally hyperinsulinemic cultured brain endothelial cells in vitro. Upon further analysis, we revealed that this corresponded with a shift in insulin receptor splice variation and increased membrane presentation of insulin receptors but a decreased ability for receptors to internalize and to activate signaling cascade effectors via tyrosine autophosphorylation. Signaling and internalization were both improved via selective inhibition of PTP1B.
Membrane receptor tyrosine kinases such as insulin receptors are unique in their ability to stimulate growth signaling and maintenance of homeostasis. 45 Insulin signaling plays an important role in regulating endothelial cell function. Indeed, multiple studies have associated brain microvascular endothelial cell insulin receptor functioning with regulation of cerebrovascular blood flow via stimulation of nitric oxide and intracellular calcium.5,46 Patients with hyperinsulinemia-induced insulin resistance and preclinical models alike demonstrate impaired hippocampal health and functioning.4,9,34,47 Given that the hippocampus, which is intimately involved with memory processing, displays dense insulin receptor expression along its vasculature,17–19 there may be an underlying connection. Thus, we sought to investigate the brain microvasculature within the mouse model of diet-induced hyperinsulinemia.33,35 First, our data in pooled hippocampal microvessels from high-fat diet fed mice showcase increased levels of total insulin receptors from whole tissue lysates (Figure 1). This is surprising given that a previous report by Gray, Aylor and Barrett 20 isolated microvessels from eight week-old rats on a similar dietary treatment for 4 weeks demonstrated no such difference. This discrepancy may be explained by important methodological differences. For example, we isolated microvessels specifically from the hippocampus, whereas the former study isolated endothelial cells from the entire rat brain. Given that there are regional differences in insulin uptake and signaling, additional studies are warranted. Furthermore, the study compared isolated brain endothelial cell insulin receptor concentrations between high-fat and control diet animals following a week of monoculture treatment. Still, their data indicates a trend towards an increase in insulin receptor levels despite a small sample size of four per group after a week of incubation in vitro. In our studies, isolated brain endothelial cells were immediately placed in ice-cold PBS and analyzed within a short amount of time. This may explain the discrepancies in our findings.
Second, the pooled hippocampal microvessels from high-fat diet fed mice also revealed reduced signaling following insulin stimulation (Figure 1). This is interesting, as the inability to stimulate insulin receptors in brain microvascular endothelial cells can decrease blood-brain barrier tight-gap junctions.48,49 Moreover, both models of insulin receptor endothelial knock-out 49 and a high-fat diet can decrease insulin signaling in the brain of mice. 50 In light of our data, this suggests a relationship between barrier insulin receptor signaling and underlying brain processes.
Isolated microvessels contain multiple cell types such as endothelial cells, astrocytic end-feet, pericyte or vascular smooth muscle cells. 51 Our goal was to better understand the receptor signaling and expression dynamics specifically in endothelial cells. We reinforce our findings from Figure 1 by moving our studies to in vitro models, demonstrating that both primary C57BL/6 mouse brain microvascular endothelial cells (MBECs) and human cerebral microvascular endothelial cells (HBEC-5is) treated with experimental hyperinsulinemia display increases in total insulin receptor expression compared to untreated cells (Figure 2). This hyperinsulinemia-induced change occurred in tandem with increased serine phosphorylation of the insulin receptor substrate (IRS)1 (Figure 2), which is associated reduced insulin signaling. 29 This indicates that hyperinsulinemia is sufficient to modify insulin receptor function in endothelial cells.
Insulin receptor protein expression and IRS1 post-translational modifications are not the only way insulin receptor signaling is modified. There are two receptor variants which differ in the inclusion (variant B, IR-B) and exclusion (variant A, IR-A) of exon 11 in mRNA processing. 52 Here, we provide novel evidence of a shift in insulin receptor splice variation in MBECs treated with hyperinsulinemia. Our data reveals a decrease in IR-A mRNA levels and IR-A mRNA ratios relative to non-hyperinsulinemic controls (Figure 3). Interestingly, IR-A and IR-B differ in their insulin binding kinetics and internalization rates. 53 Following ligand binding, insulin receptor internalization propagates signal transduction. 54 The IR-A isoform has been previously described as having increased internalization capacity relative to IR-B, 52 however the splice variant expression response has yet to be determined in the brain microvasculature during hyperinsulinemia. Hence, we sought to assess this further by exploring the impact of hyperinsulinemia on insulin receptor internalization.
Beyond splice variation, the insulin receptor internalization process also relies on key autophosphorylation sites along the β-subunit, including tyrosines 1150 and 1151 (numbering for splice variant “B”),25,26 which in turn initiates downstream receptor signaling effectors, leading to phospho-activation of protein kinase B (AKT). 30 While other tissues such as the liver demonstrate decreased membrane-associated insulin receptor concentrations in models of diabetes, 55 we present the unique finding that experimentally hyperinsulinemic MBECs demonstrate increased membrane insulin receptor levels (Figure 4). Furthermore, these receptors did not internalize (Supp. Figure 1), nor did they activate downstream signaling cascades following stimulation (Figure 4). All of this coincided with reduced tyrosine autophosphorylation after 15 minutes of stimulation in our model (Figure 4), suggesting that some phosphatase feedback may be enhanced during hyperinsulinemia.
The PTP1B protein is a major regulator of receptor tyrosine activity of the insulin receptor. Recent studies have demonstrated that selective inhibition of PTP1B via Claramine can facilitate tyrosine mediated insulin receptor signaling in vitro. 56 Given our findings of perturbed tyrosine-mediated signaling in hyperinsulinemic cells, we explored whether 30 minutes of Claramine pretreatment prior to stimulation could rescue signaling and internalization. Claramine treatment decreased total PTP1B levels in the MBECs, as well as restored receptor autophosphorylation, downstream signaling, and receptor internalization in hyperinsulinemic cells (Figure 5). This aligns with previous reports of increased insulin uptake in endothelial cells 30 and improved peripheral insulin sensitivity in vivo 57 following PTP1B inhibition. Further research into the efficacy of Claramine as a brain microvascular endothelial cell insulin receptor sensitizer is warranted; however, these results indicate potential for PTP1B inhibition in promoting insulin receptor internalization at this unique microvascular barrier.
Obesity is a varied disorder with multiple complications including dyslipidemia, atherosclerosis, systemic inflammation, and abnormal glucose metabolism, all of which may confound our findings; thus, we acknowledge the focus on hyperinsulinemia is limited in scope. An example of potential confounding metabolic problems is the issue of glucose transporters. There are a variety of glucose transporters throughout the body, and glucose transporter 1 (Glut1), which is not insulin-dependent, is known to be expressed in the brain endothelial cells. However, there is a paucity of information about the other types of glucose transporters or whether conditions such as hyperinsulinemia may lead to a shift in the expression of different families of glucose transporters. Preclinical models of diabetes exhibit an increase of brain Glut4 expression, which is an insulin dependent glucose transporter. 58 This shift during the metabolic state may ultimately contribute to the pathophysiology we have described in unknown ways, and therefore warrants further elucidation.
In conclusion, we provide data which supports the notion that hyperinsulinemia impacts insulin receptor presentation, internalization, and signaling within brain microvascular endothelial cells in vivo and in vitro. We also offer a potential mechanism to reverse the impact of hyperinsulinemia on the brain endothelial cell insulin receptor with Claramine, a potent PTP1B inhibitor. Going forward, it will be important to follow these studies with analysis of PTP1B inhibition in vivo to assess whether there is functional recovery of the brain microvascular endothelial cells in a high-fat diet model. It will also be prudent to understand whether receptor splice variation occurs in the high-fat model. Our data indicate that while there is dampening of the receptor signaling and a reduction of insulin receptor internalization, we do not know whether these changes are a result of impaired receptor internalization ability via endocytic vesicle machinery, a change in the rate of recycling of the receptor at the brain endothelial cell membrane, or by other means. Additional studies will be required to further understand the greater endocytic machinery of the brain endothelial cell. This has implications beyond insulin receptor functionality which include transcytosis of circulating materials into the brain, as well as functional control over vascular tone and barrier formation.
Supplemental Material
Supplemental Material - Hyperinsulinemia alters insulin receptor presentation and internalization in brain microvascular endothelial cells
Supplemental Material for Hyperinsulinemia alters insulin receptor presentation and internalization in brain microvascular endothelial cells by Luke S Watson, Brynna Wilken-Resman, Alexus Williams, Stephanie DiLucia, Guadalupe Sanchez, Taylor L McLeod and Catrina Sims-Robinson in Diabetes and Vascular Disease Research
Footnotes
Acknowledgements
The authors wish to acknowledge Janet Boggs for technical assistance and support.
Author contributions
Conceptualization, L.S.W, B.W.R., C.S-R.; Methodology, L.S.W, C.S-R.; Formal Analysis, L.S.W.; Investigation, L.S.W., A.W., S.D., G.S., T.L.; Resources, C.S-R.; Data Curation, L.S.W, C.S-R.; Writing – Original Draft Preparation, L.S.W.; Writing – Review and Editing, B.W.R., A.W., S.D., G.S., T.L., C.S-R.; Visualization, C.S-R.; Supervision, C.S-R.; Project Administration, C.S-R.; Funding Acquisition, C.S-R.
Declaration of conflicting interests
The author(s) declared the following potential conflicts of interest with respect to the research, authorship, and/or publication of this article: L.S.W. is currently an employee of Intra-Cellular Therapies, Inc., however his employment played no role in the presentation of these findings. All other authors declare that they have no conflicting interests. The funders had no role in the design of the study; in the collection, analyses, or interpretation of data; in the writing of the manuscript, or in the decision to publish the results.
Funding
The author(s) disclosed receipt of the following financial support for the research, authorship, and/or publication of this article: This research was funded by the National Institutes of Health (NHLBI 4T32HL007260-40 to L.S.W. and BWR; NCATS TL1 TR001451 and UL1 TR001450 to S.D.; NINDS 5K01NS079461, NINDS 1R01NS099595, NIGMS R25GM072643, and NIGMS P20GM109040 to C. S-R.) and the Alzheimer’s Association (AARGD-16–440893 to C.S-R.). The funding bodies played no role in the design of the study, nor the collection, analysis, and interpretation of data, nor in writing the manuscript.
Data availability
The data that support the findings of this study are available from the corresponding author upon reasonable request.
Institutional review board statement
The study was conducted in accordance with the university guidelines, state and federal regulations, and the standards of the “Guide for the Care and Use of Laboratory Animals.” All protocols/procedures were approved by the Medical University of South Carolina Institutional Animal Care and Use Committee.
Supplemental material
Supplemental material for this article is available online.
Appendix
References
Supplementary Material
Please find the following supplemental material available below.
For Open Access articles published under a Creative Commons License, all supplemental material carries the same license as the article it is associated with.
For non-Open Access articles published, all supplemental material carries a non-exclusive license, and permission requests for re-use of supplemental material or any part of supplemental material shall be sent directly to the copyright owner as specified in the copyright notice associated with the article.