
Abstract
Background:
Coronary arterial plaques in patients with end-stage renal disease (ESRD) are assumed to have increased calcification due to underlying renal disease or initiation of dialysis. This relationship may be confounded by comorbid type 2 diabetes mellitus (DM).
Methods:
From a single-center OCT registry, 60 patients were analyzed. Twenty patients with ESRD and diabetes (ESRD-DM) were compared to 2 groups of non-ESRD patients: 20 with and 20 without diabetes. In each patient, one 20 mm segment within the culprit vessel was analyzed.
Results:
ESRD-DM patients exhibited similar calcium burden, arc, and area compared to patients with diabetes alone. When compared to patients without diabetes, patients with diabetes exhibited a greater summed area of calcium (DM: Median 9.0, IQR [5.3–28] mm2 vs Non-DM: 3.5 [0.1–14] mm2, p = 0.04) and larger calcium deposits by arc (DM: Mean 45 ± SE 6.2° vs Non-DM: 21 ± 6.2°, p = 0.01) and area (DM: 0.58 ± 0.10 mm2 vs Non-DM: 0.26 ± 0.10 mm2, p = 0.03). Calcification deposits in ESRD-DM patients (0.14 ± 0.02 mm) and patients with diabetes (0.14 ± 0.02 mm) were more superficially located relative to patients without diabetes (0.21 ± 0.02 mm), p = 0.01 for both.
Conclusions:
Coronary calcification in DM and ESRD-DM groups exhibited similar burden, deposit size, and depth within the arterial wall. The increase in coronary calcification and cardiovascular disease events seen in ESRD-DM patients may not be secondary to ESRD and dialysis, but instead due to a combination of declining renal function and diabetes.
Keywords
Introduction
Patients with chronic kidney disease (CKD) and specifically those requiring renal replacement therapy (end-stage renal disease, ESRD) commonly develop atherosclerotic cardiovascular disease, contributing to mortality rates significantly higher than the general population.1–4 Both histological and imaging studies have demonstrated an increased occurrence of coronary artery calcification among patients with CKD and ESRD,5–7 which has proven to be an important marker of atherosclerosis, cardiovascular disease events, and mortality in this population.8–10
However, the relationship between ESRD and coronary artery calcification may be impacted by co-existent diabetes mellitus (DM), the most common primary cause of ESRD in the U.S. population. 1 Optical coherence tomography (OCT), intravascular ultrasound, and electron-beam computed tomography investigations have shown a clear correlation between diabetic status and coronary calcification.11–18 When studied in the context of CKD stages 3–5, diabetic status has been shown to have a significant effect on the extent of coronary calcification, and while declining kidney function was associated with coronary calcification, this relationship was significantly attenuated after adjusting for diabetic status. 19
Considering its superior resolution and ability to accurately identify and quantify calcific plaque, OCT is an ideal intravascular imaging modality for determining extent and type of coronary calcification.20–22 To date, only 2 studies have utilized OCT to analyze plaque morphology in patients with ESRD, with neither study addressing diabetes as a confounding factor.23,24 Therefore, we sought to compare coronary arterial plaque morphology, specifically calcific plaque extent and burden in patients with and without ESRD and diabetes using OCT imaging, and to determine the relationship between dialysis duration, diabetic status, and coronary calcification in ESRD patients with atherosclerotic coronary artery disease.
Methods
The data that support the findings of this study are available from the corresponding author upon reasonable request.
Study population
The Loyola University Medical Center Intravascular Imaging Registry was created in 2007 and approved by the Institutional Review Board for retrospective review of intravascular imaging procedures at the time of clinically indicated cardiac catheterization and coronary intervention. All patients provided informed consent for inclusion in this registry. Of the >300 patients in the registry, 27 patients fulfilled our definitions of ESRD and diabetes mellitus. After excluding patients with poor image quality (n = 4) and those with ESRD alone (n = 3), a total of 20 patients with both ESRD and diabetes were compared to 2 cohorts of non-ESRD patients, including 20 patients with diabetes and 20 patients without diabetes. Efforts were made during patient selection to achieve balance between groups in terms of sex and age as prior studies have illustrated both age and male gender are two consistent and significant risk factors implicated in coronary calcification. 8 Blinded to imaging data, patients with both ESRD and diabetes were matched 1:1 to patients with and without diabetes, using first sex and then age ± 10 years as parameters. Best fit patients for either DM or non-DM groups were selected until a target number of 20 per group was reached. After matching was completed, patients with OCT runs with poor image quality or any target segments that were interrupted by prior stenting were excluded. If an initial match was excluded on the basis of poor image quality, it was then replaced by the next best fit based on sex and age (Figure 1). Statistically based matching was not performed due to the relatively small pool of candidates available for review.
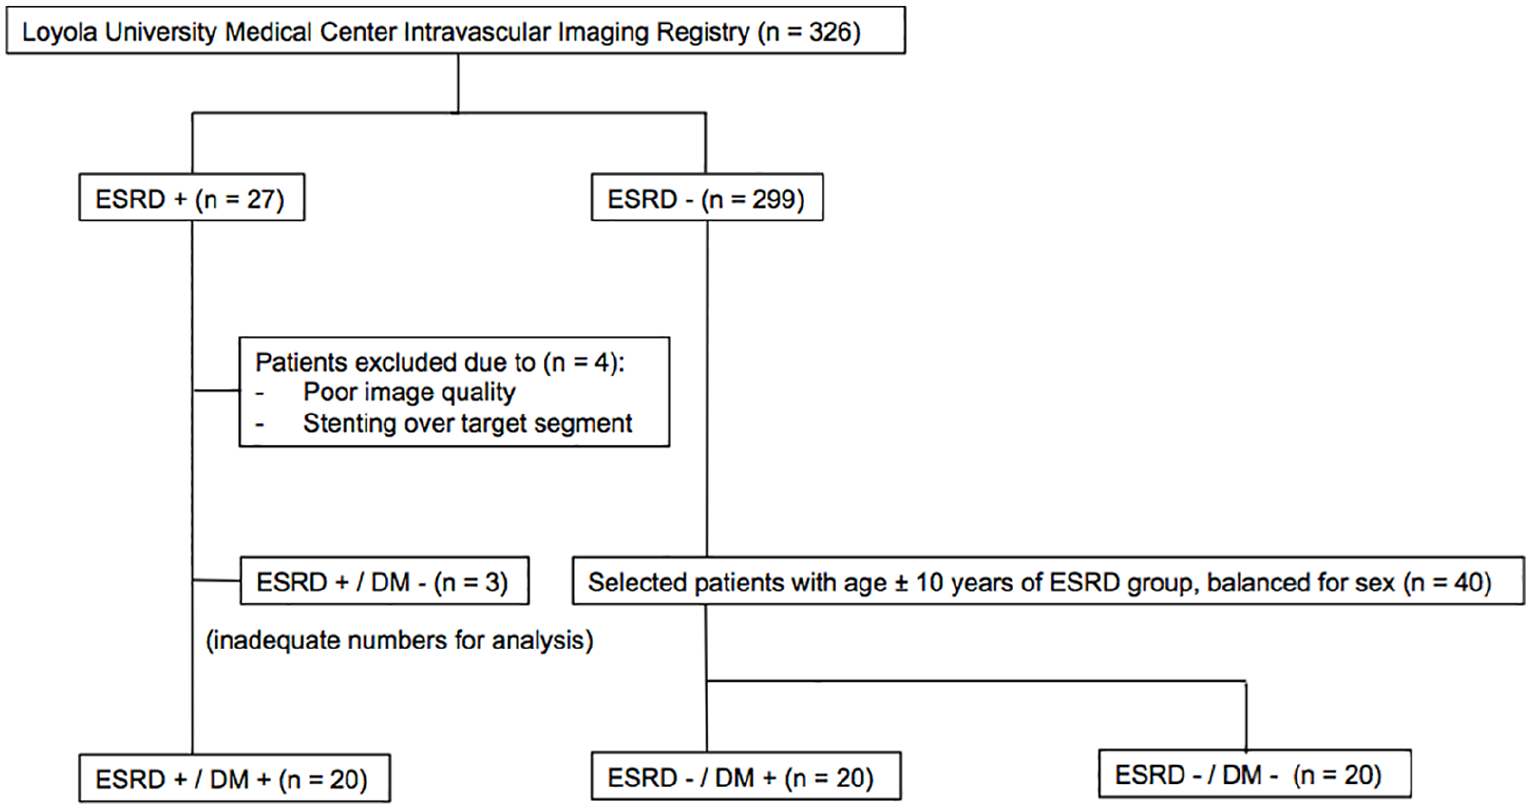
Flow chart outlining the patient selection process. After excluding patients with poor image quality (n = 4) and those with ESRD alone (n = 3), a total of 20 patients with both ESRD and diabetes were identified. ESRD-DM patients were matched 1:1 to patients with and without diabetes, using first sex and then age ± 10 years as parameters. Best fit patients for either DM or non-DM groups were selected until a target number of 20 per group was reached. After matching was completed, patients with OCT runs with poor image quality or any target segments that were interrupted by prior stenting were excluded. If an initial match was excluded on the basis of poor image quality, it was then replaced by the next best fit based on sex and age.
ESRD status was defined as dialysis dependence at the time of catheterization. Diabetic status was defined as a documented clinical history of type 2 diabetes mellitus, use of diabetic pharmacological therapy (oral agents and/or insulin), or hemoglobin A1c (HbA1c) ⩾ 6.5%. Indications for catheterization included acute coronary syndrome (ACS; unstable angina and non-ST-segment elevation myocardial infarction) as well as non-ACS (angiography for stable angina, positive stress test, or pre-operative evaluation for renal, liver, or lung transplantation).
Baseline demographics compared between groups included age, sex, race, ethnicity, cardiovascular presentation (ACS vs non-ACS) at time of catheterization, hypertension, prior cardiovascular disease history, smoking tobacco use, warfarin use, insulin use, diabetes duration, dialysis duration, dialysis type (peritoneal dialysis vs hemodialysis), body mass index (BMI), and imaged vessel location. Laboratory data included HbA1c, hemoglobin (Hb), estimated glomerular filtration rate (eGFR) calculated using the Modification of Diet in Renal Disease (MDRD) Study Equation, 25 creatinine, total cholesterol, low-density lipoprotein (LDL), high-density lipoprotein (HDL), and white blood cell (WBC) count.
OCT image acquisition
After diagnostic angiography, OCT imaging was performed using the frequency-domain ILUMIEN™ PCI Optimization System (Abbott-St. Jude Medical, Saint Paul, MN) as part of routine pre-percutaneous coronary intervention imaging. A 2.7 French imaging catheter (Dragonfly, LightLab Imaging, Inc) was advanced distally across the target lesion. With contrast injection (14–16 mL), automated pullback of the OCT imaging core (frame interval of 5 frames/mm or 0.2 mm thickness per slice) was triggered in a distal to proximal direction. Acquired images were subsequently de-identified and digitally stored for off-line dedicated workstation analysis.
OCT image analysis
All OCT studies were analyzed using offline analysis software by a trained independent observer (JRW) and overread by an experienced reader (JJL) blinded to group status. Discrepancies in image analysis were adjudicated via consensus between observers. Interobserver agreement between readers was estimated by calculating an intraclass correlation coefficient (ICC) for calcium arc, area, and depth measurements from a subset of analyzed OCT frames. One lesion per patient was analyzed in the target vessel, defined as a contiguous 20 mm segment centered on the minimum lumen area. If at the time of analysis it was not possible to center a 20 mm segment on the minimal lumen area, the analyzed segment was extended either proximally or distally in relation to the minimal lumen area. If adjacent stents or guiding catheter sheath encroached upon the 20 mm segment, then segment length was truncated as necessary. Lesions were analyzed at 1 mm intervals for presence and degree of calcification as well as lipid arc >90°. Definitions of plaque features were based on previously reported OCT consensus standards. 26 Descriptions of the different plaque types are highlighted in Figure 2. Only contiguous lipid arcs >90° were measured; therefore, reported lipid arcs fall between a possible range of 90° to 360°. Lipid arc was not measured if it was interrupted by calcium so as to avoid overlap of calcium and lipid arcs. Percentage area stenosis was calculated by dividing the minimal lumen area by a proximal or distal reference lumen area within the same arterial segment that had the largest area and was most representative of a normal vessel wall.
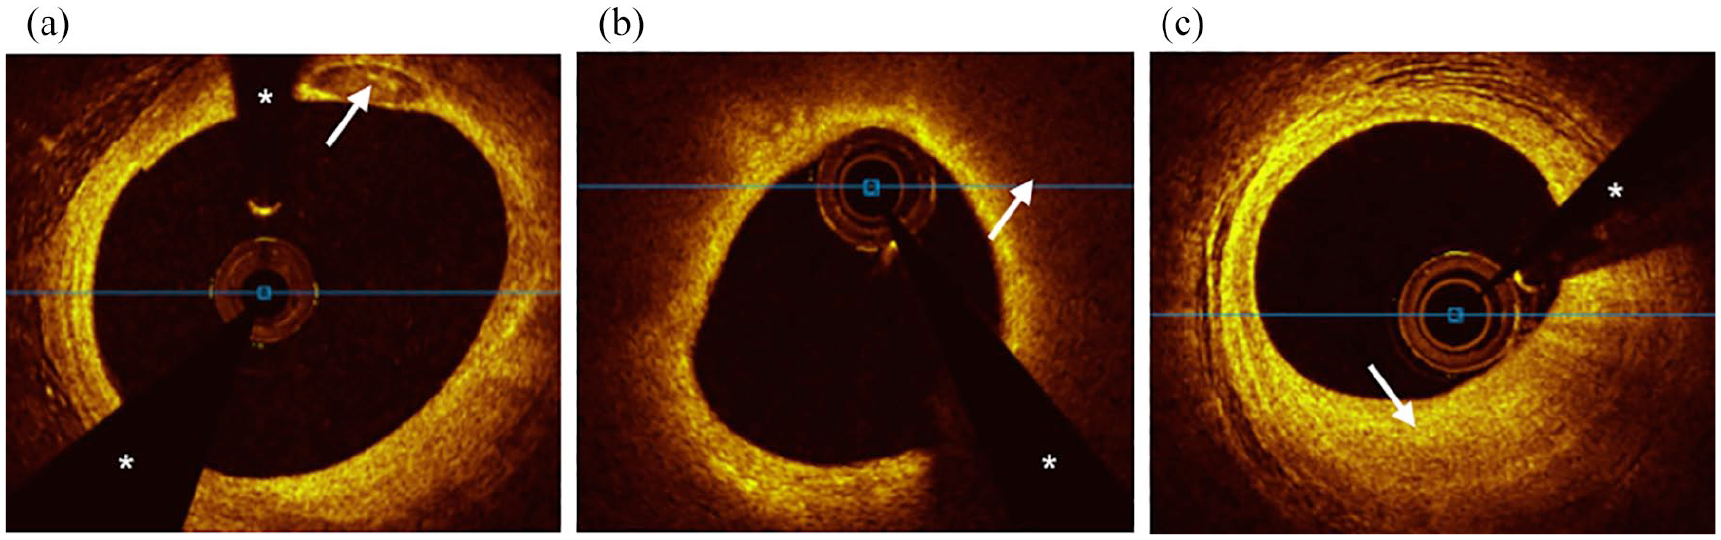
Cross-sectional optical coherence tomography images of plaque types. (a) Calcified plaque was defined as a signal poor or heterogeneous area with a sharply delineated border. A calcium deposit is visible at 1 O’clock (white arrow). (b) Lipid plaque was defined as a signal poor area with poorly delineated borders. Circumferential lipid plaque with overlying fibrous cap is visible and highlighted at 2 O’clock (white arrow). (c) Fibrous plaque was defined as an area of high backscattering and homogenous signal. A focus of fibrous plaque is visible at 6 O’clock (white arrow).
Calcific plaque burden was determined semi-quantitatively by measuring the number of calcium deposits as well as arc and area at 1 mm intervals. Calcium deposits were defined as discrete areas of calcific plaque (borders defined when measuring calcium area). Due to OCT’s inherent limitations, including potential changes in angular position of calcium along an OCT pullback, and our non-continuous image analysis at 1mm intervals, contiguous calcium deposits across multiple vessel sections could not be distinguished with confidence. The number of deposits contained in each analyzed frame was counted every 1 mm, and the sum total of calcium deposits for an entire analyzed vessel segment was reported as a “frame-level calcium score.” Calcium arc was measured from the lumen center. Calcium area was measured by tracing the visible borders of calcific plaque. Summed calcium area per mm was defined as the summed area of calcium along the entire analyzed segment divided by lesion length, which serves to describe the linear density and distribution of calcium. Depth of calcium was defined as the distance between the most superficial edge of calcific plaque and the luminal surface (Figure 3).
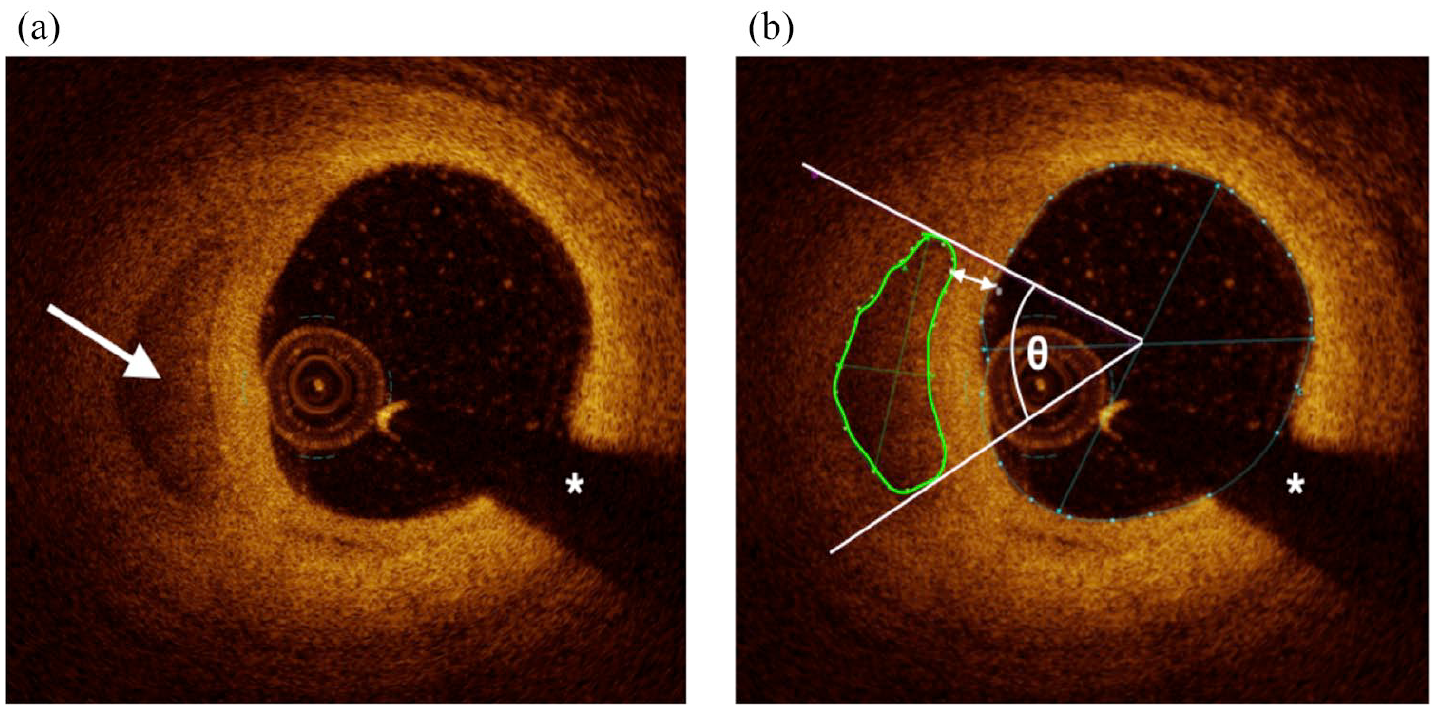
Cross-sectional optical coherence tomography images of calcium. (a) A calcium deposit is visible at 9 O’clock (white arrow). (b) The same calcium deposit after offline image analysis, including area (green circle), arc (angle θ), and depth (double-headed arrow) measurements. The white asterisks denote guidewire shadow artifact.
Statistical methods
A descriptive analysis includes subjects’ demographic and clinical data stratified by group. Pearson chi-square and Fisher’s exact tests were used to compare categorical risk factors, while non-parametric Wilcoxon Rank Sum and Kruskal–Wallis tests were employed to assess continuous measures. A Dwass, Steel, Critchlow-Fligner (DSCF) correction was utilized to adjust for multiple pairwise comparisons when more than two groups were present. Pearson correlation coefficients are also reported to characterize the relationship between level of calcification and diabetes mellitus/dialysis duration. Linear mixed effects models were then used to compare the groups’ mean arc, area, and depth of calcification and lipid arc estimates. In these models, random intercepts were employed to account for multiple arterial frame observations for each patient. An alpha error rate of p ⩽ 0.05 was used to determine statistical significance. All analyses were completed using SAS 9.4 (Cary, NC).
Results
Baseline patient demographics
Baseline patient demographics are displayed in Table 1. Patient groups were largely similar in terms of age, sex, prevalence of ACS, smoking tobacco use, warfarin use, comorbid conditions, past medical history, and relevant laboratory data. The ESRD-DM group was comprised of a larger proportion of Hispanic patients compared to other groups (p < 0.001). Patients in the ESRD-DM group had a lower average HbA1c when compared to the DM group (p < 0.001) but also a lower average Hb (p < 0.001). Both ESRD-DM (50%) and DM groups (60%) had similar proportions of patients requiring insulin therapy, and there was no significant difference in duration of diabetes between these two groups. The DM group had a greater proportion of patients who were post-coronary artery bypass surgery compared to other groups (p = 0.02). Patients in the non-DM group reported a lower body mass index when compared to patients in the DM group (p = 0.02). Not shown in Table 1 are the proportions of ESRD-DM patients who received hemodialysis (90%), peritoneal dialysis (15%), and both (5%) as well as eGFR ranges for ESRD-DM (4–28 mL/min per 1.73 m2), DM (37.3–121 mL/min per 1.73 m2), and non-DM (55.8–131.2 mL/min per 1.73 m2) groups. Note that for the variables diabetes duration, total cholesterol, LDL, HDL, and HbA1c several data points were not collected, and group comparisons were made with available data.
Baseline demographics.
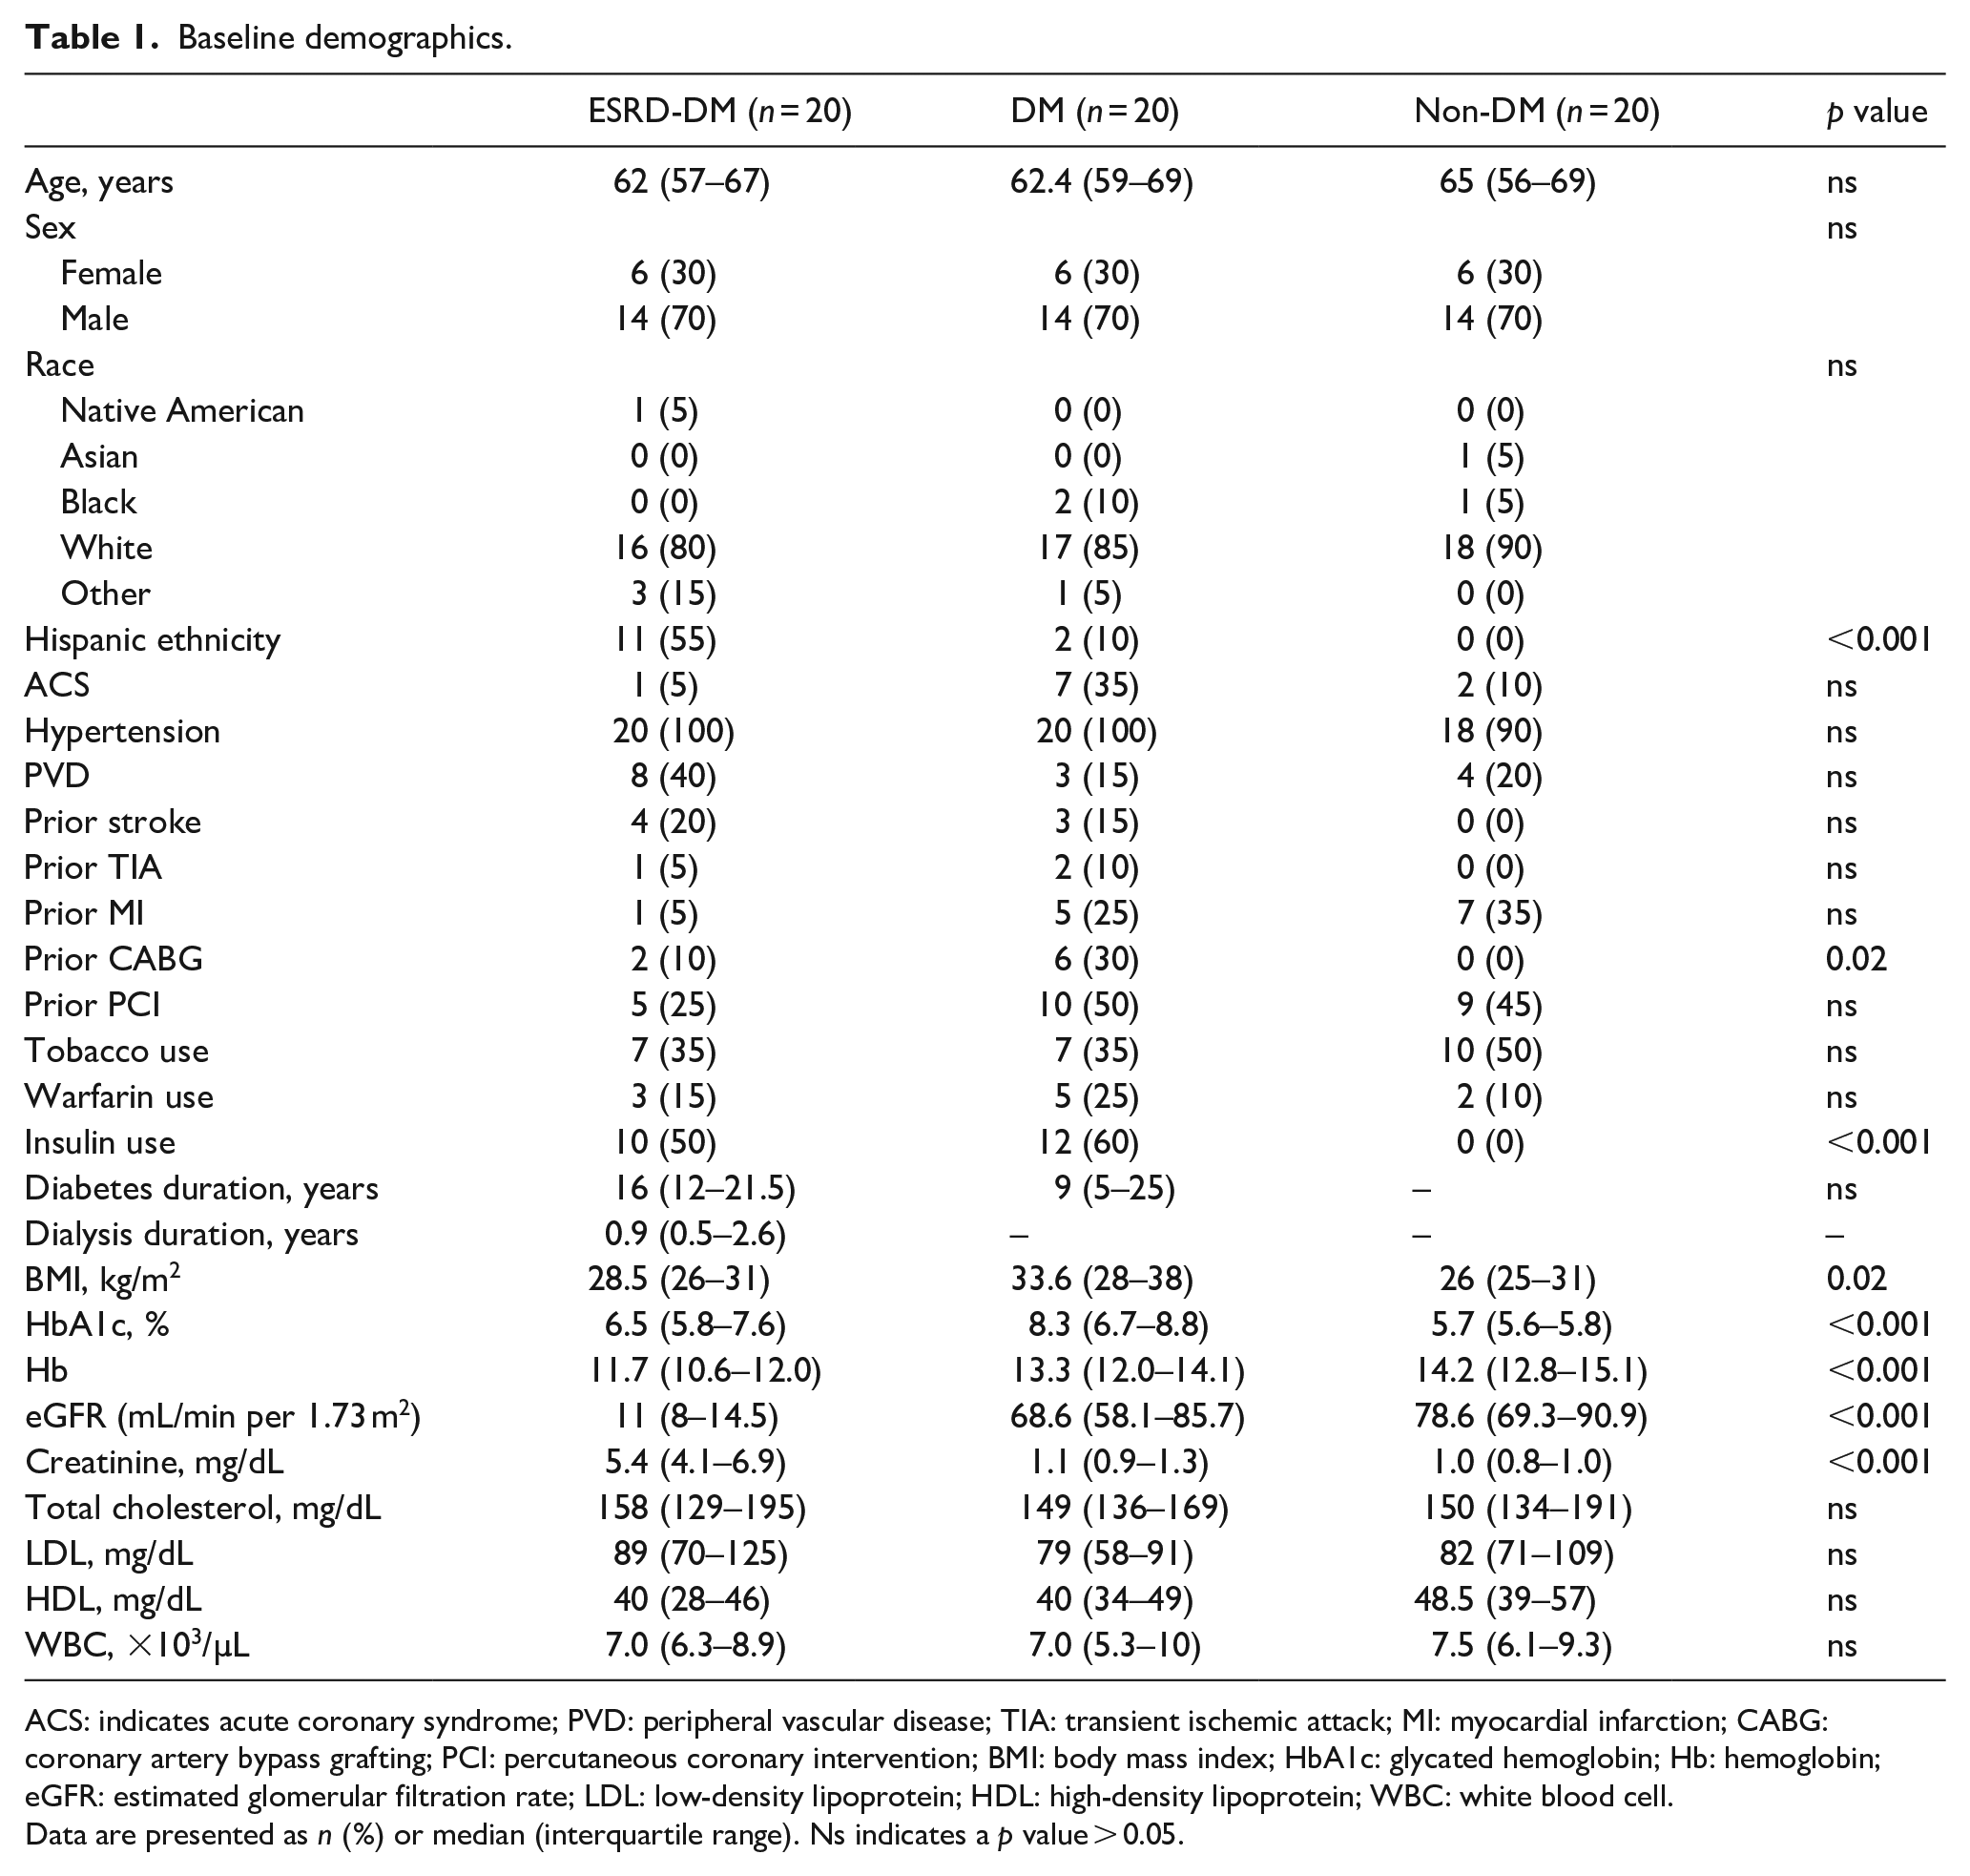
ACS: indicates acute coronary syndrome; PVD: peripheral vascular disease; TIA: transient ischemic attack; MI: myocardial infarction; CABG: coronary artery bypass grafting; PCI: percutaneous coronary intervention; BMI: body mass index; HbA1c: glycated hemoglobin; Hb: hemoglobin; eGFR: estimated glomerular filtration rate; LDL: low-density lipoprotein; HDL: high-density lipoprotein; WBC: white blood cell.
Data are presented as n (%) or median (interquartile range). Ns indicates a p value > 0.05.
Optical coherence tomography findings
Interobserver agreement between readers was of very good to excellent reliability as demonstrated by an ICC of 0.958 for calcium arc, 0.872 for calcium area, and 0.958 for calcium depth. OCT characteristics of the analyzed culprit lesions are summarized in Table 2. Patients with diabetes exhibited a greater frame-level calcium score compared to those without diabetes (DM: Median = 22.0, Interquartile range [IQR] = 12–26 vs Non-DM: Median = 8.5, IQR = 0.5–22, p = 0.03). Patients with diabetes also exhibited a greater summed area of calcium (DM: Median = 9.0 mm2, IQR = 5.3–28 mm2 vs Non-DM: Median = 3.5 mm2, IQR = 0.1–14 mm2, p = 0.04) and summed calcium area per mm (DM: Median = 0.5, IQR = 0.3–1.4 vs Non-DM: Median = 0.2, IQR = 0.0–0.7, p = 0.04) when compared to those without diabetes. There were no significant differences in any measure of calcium (frame-level score, summed area, or summed area per mm) when comparing the ESRD-DM group to either the DM or non-DM group. There were no significant differences between groups in terms of anatomical location of the analyzed vessel, analyzed segment length, minimal lumen area, and percent area stenosis. ESRD-DM patients (Mean = 193°, SE = 8.2°) exhibited higher and marginally higher mean lipid arcs than patients with diabetes (Mean = 167°, SE = 9.1°, p = 0.04) and patients without diabetes (Mean = 171°, SE = 8.5°, p = 0.07), respectively. Otherwise, analyzed lesions in each group exhibited similar lipid burden in terms of maximum lipid arc and number of analyzed frames containing lipid.
Patient-Level optical coherence tomography findings.
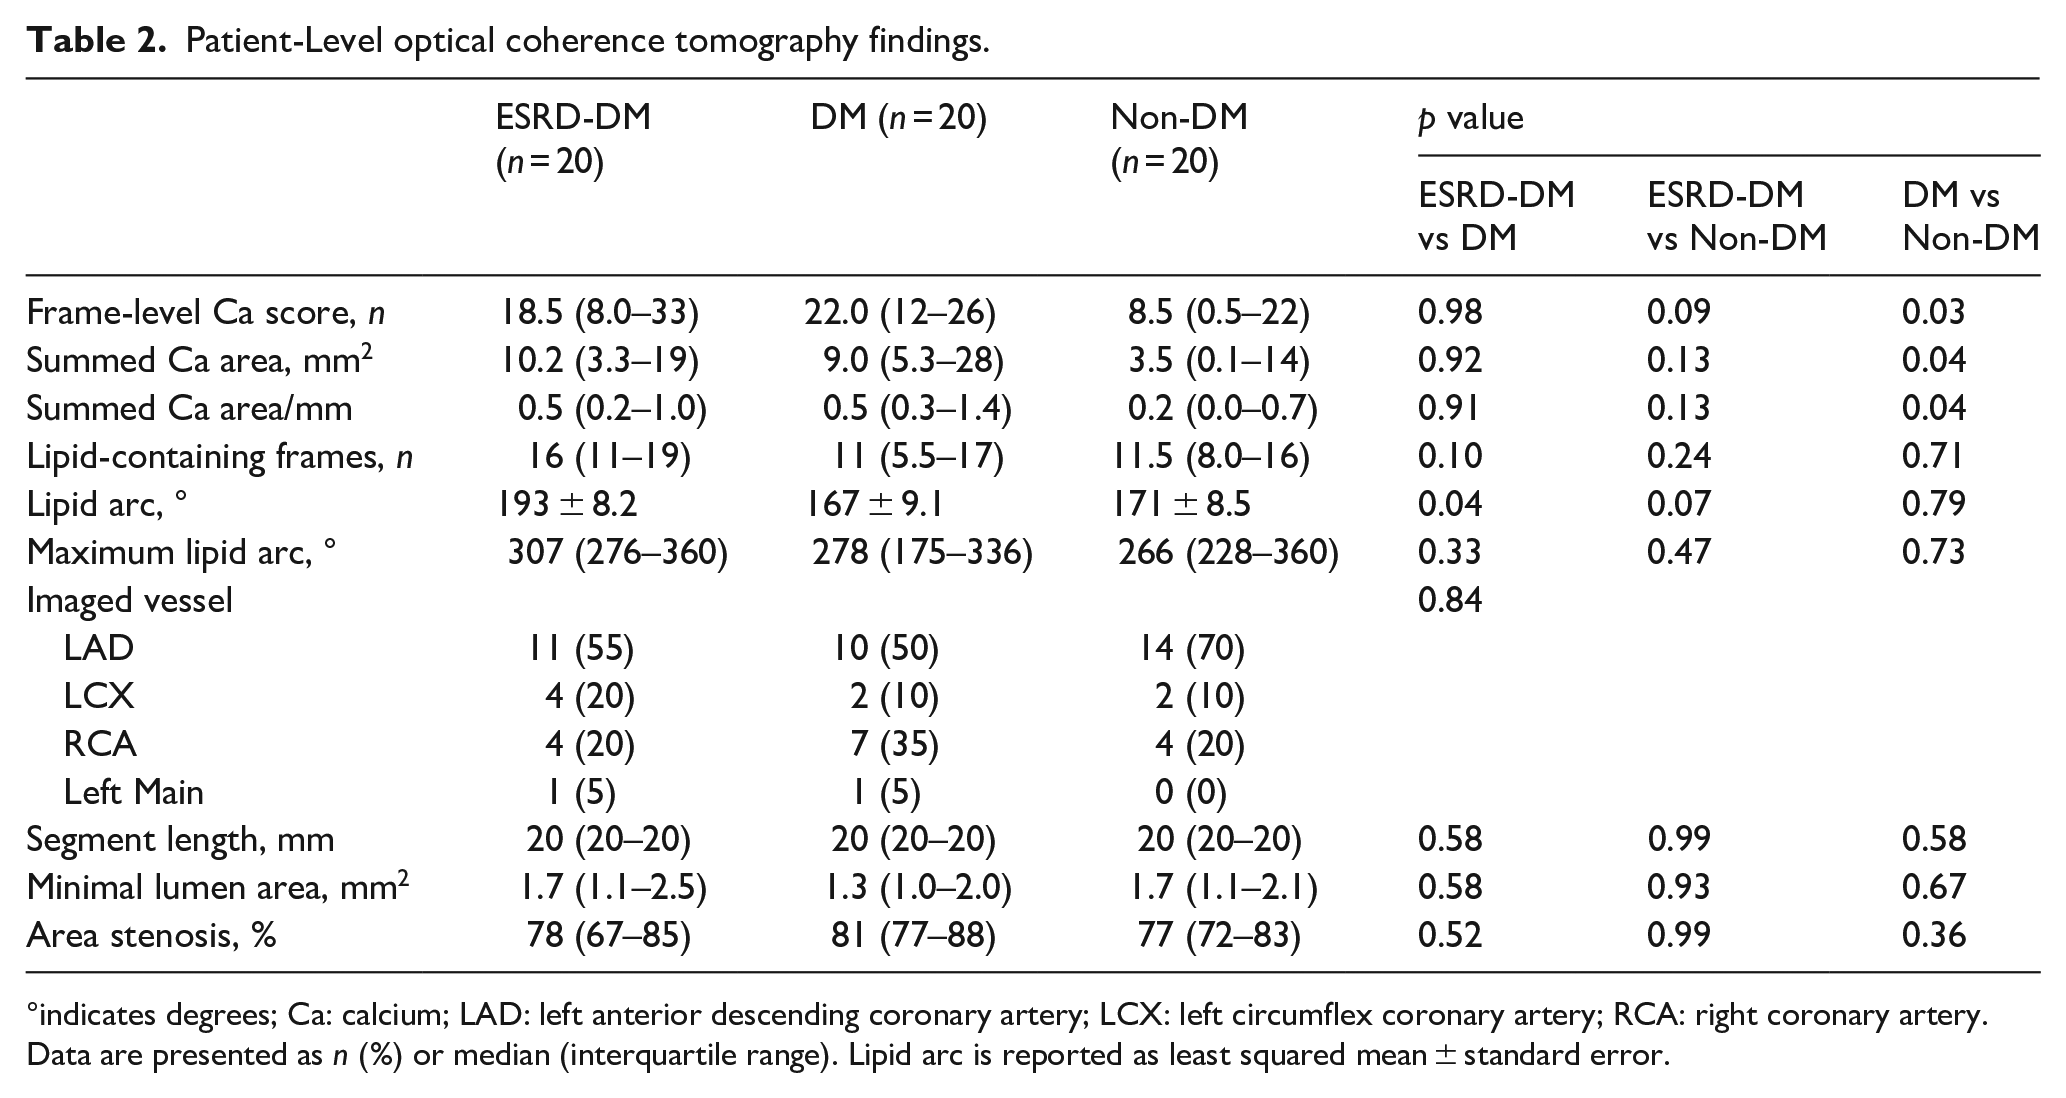
°indicates degrees; Ca: calcium; LAD: left anterior descending coronary artery; LCX: left circumflex coronary artery; RCA: right coronary artery.
Data are presented as n (%) or median (interquartile range). Lipid arc is reported as least squared mean ± standard error.
Calcium deposit characteristics
Measurements describing calcium deposits (arc, area, and depth) are summarized in Table 3 and Figure 4. Calcium deposits in patients with diabetes (Mean = 45°, SE = 6.2°) exhibited, on average, greater calcium arc than those in patients without diabetes (Mean = 21°, SE = 6.2°, p = 0.01). Deposits found in ESRD-DM patients (Mean = 38°, SE = 6.2°) also had a marginally larger mean calcium arc than deposits found in patients without diabetes (p = 0.06). Similarly, deposits found in patients with diabetes (Mean = 0.58 mm2, SE = 0.10 mm2) had a significantly greater mean calcium area than those found in patients without diabetes (Mean = 0.26 mm2, SE = 0.10 mm2, p = 0.03). Deposits in patients with diabetes (Mean = 0.14 mm, SE = 0.02 mm) and ESRD-DM patients (Mean = 0.14 mm, SE = 0.02 mm) were both more superficially located within the vessel wall in comparison to deposits in patients without diabetes (Mean = 0.21 mm, SE = 0.02 mm, both p = 0.01). ESRD-DM patients and patients with diabetes exhibited similar mean arc (p = 0.45), area (p = 0.23), and depth (p = 0.98) (not shown in Table 3).
Calcification deposit arc, area, and depth.
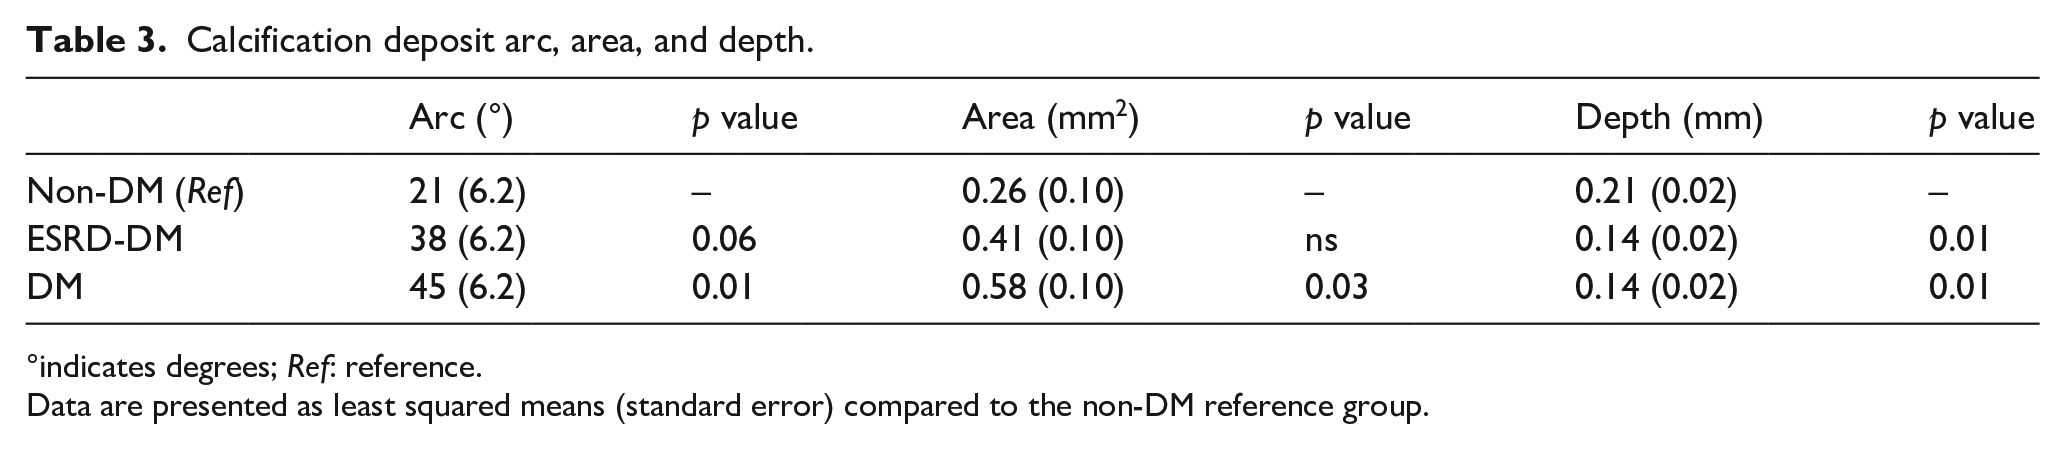
°indicates degrees; Ref: reference.
Data are presented as least squared means (standard error) compared to the non-DM reference group.
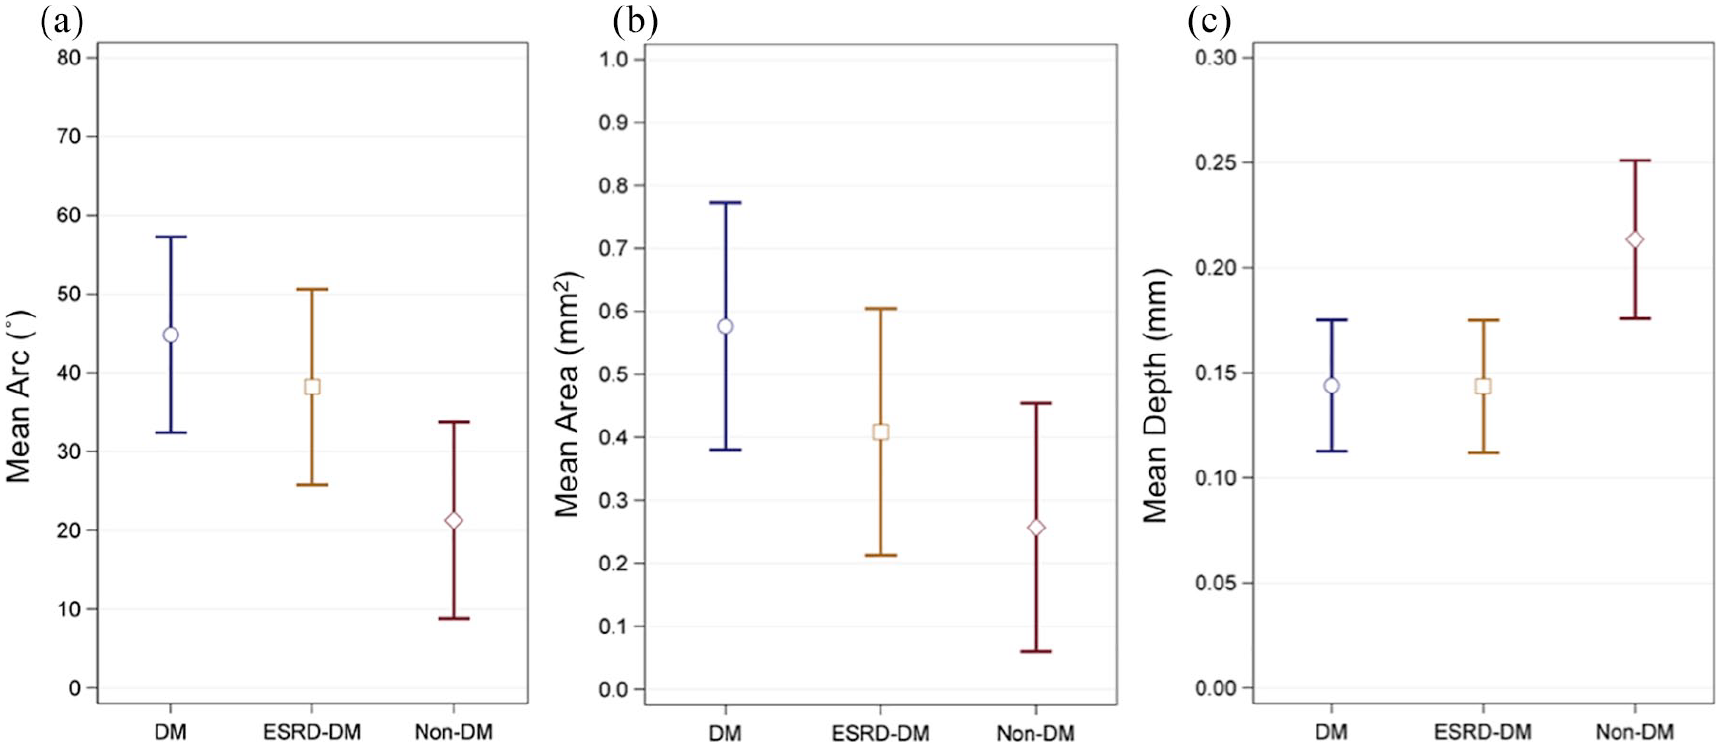
Graphical summary comparing mean (a) arc, (b) area, and (c) depth of calcification between patient groups. Blue circles, golden squares, and red diamonds represent mean values for DM, ESRD-DM, and non-DM groups respectively.
Associations between calcium burden, diabetes duration, and dialysis duration
Only summed area of calcium was positively correlated with dialysis duration for ESRD-DM patients (r = 0.61, p = 0.004; Figure 5). There was no significant correlation between summed area of calcium and diabetes duration (r = –0.03, p = 0.86) or HbA1c (r = –0.06, p = 0.72) for all patients with diabetes (from both DM and ESRD-DM groups). Similarly, summed area of calcium and diabetes duration were also compared for only ESRD-DM patients. Overall, there was not a significant association between these two factors within this patient subgroup (r = 0.08, p = 0.72). There was no significant correlation between average lipid arc and diabetes duration (r = 0.02, p = 0.89), HbA1c (r = 0.12, p = 0.44), or dialysis duration (r = –0.21, p = 0.37).
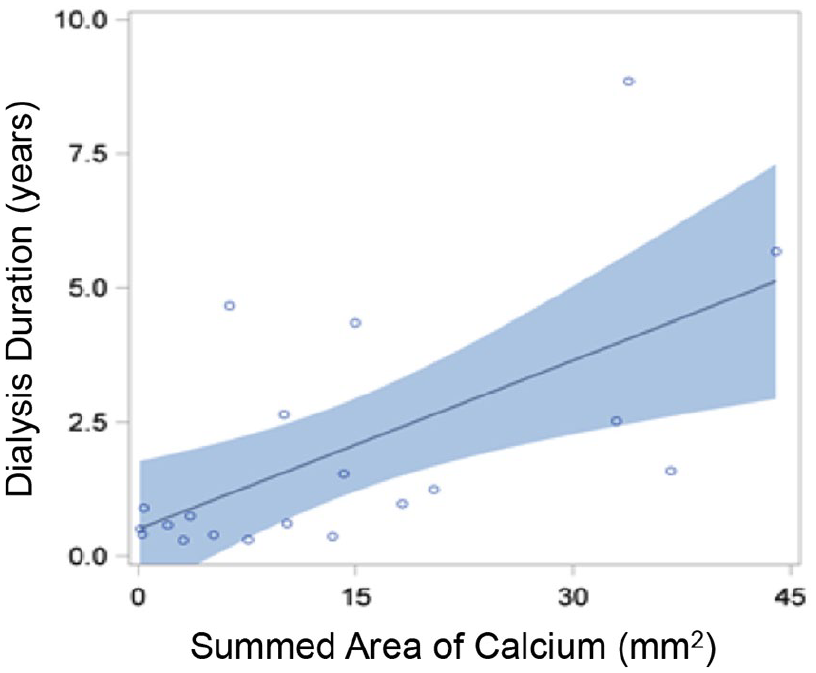
Correlation curve showing relationship between dialysis duration and summed area of calcium. Individual ESRD-DM patients are represented by blue circles. Blue shading represents 95% confidence limits. Summed area of calcium was positively correlated with dialysis duration for ESRD-DM patients (r = 0.61, p = 0.004).
Discussion
In this comprehensive OCT analysis of patients with ESRD and diabetes, we have demonstrated that patients with both ESRD and diabetes exhibited a similar degree of coronary arterial plaque calcification compared to patients with diabetes alone. Calcification deposits in these two groups were similarly sized, exhibiting equivalent mean arcs and areas. When compared to patients without diabetes, patients with diabetes exhibited a greater burden of coronary calcification as well as larger calcium deposits while patients with both ESRD and diabetes showed a trend toward larger calcium arc. In addition, calcification deposits in both ESRD-DM and DM groups were more superficially located as compared to patients without diabetes. While calcification burden was associated with diabetic status, it did not correlate significantly with the reported duration of diabetes. However, among ESRD-DM patients, calcification burden did strongly correlate with dialysis duration.
Only two studies have previously employed OCT in an attempt to characterize atherosclerotic plaque in patients with ESRD undergoing dialysis.23,24 Chin et al. showed that compared to 62 matched patients without CKD, patients on hemodialysis exhibited atherosclerotic plaque with greater mean and maximum arcs of calcium. Neither calcium area nor volume were assessed in this study. Groups were equally matched in terms of diabetic status, with HD and non-CKD groups both comprised of a majority (61%) of patients with diabetes; however, the study did not assess differences in plaque characteristics or calcium burden between patients with diabetes and patients without diabetes. 24 Sugiyama et al. compared 28 ESRD patients to 268 non-ESRD patients, with the ESRD group composed of a significantly larger proportion of patients with diabetes (64.3%) compared to CKD (45.2%) and non-CKD (37.3%) control groups (p = 0.028). In this study, ESRD was associated with a larger arc and longer length of calcification, and multivariate analysis revealed that age, diabetic status, and hemodialysis were independently associated with the presence of calcified plaques. 23 While novel in their use of OCT to characterize plaques of ESRD patients, the mixed nature of these studies’ patient populations makes it difficult to assess whether ESRD or diabetes, alone or in combination, was the critical factor resulting in higher calcific plaque burden observed in the dialysis-dependent groups. In contrast, we compared patients with diabetes on dialysis to diabetic controls and found no difference in coronary plaque calcium burden or deposit size; however, when compared to patients without diabetes, patients with diabetes (without ESRD) showed the largest difference in calcium burden, while ESRD-DM patients showed a trend toward larger calcium arc. Our results point to a greater role of diabetes in the process of coronary calcification in patients with ESRD than previously suspected.
Risks for coronary calcification in ESRD
It has been generally assumed that as CKD progresses to ESRD, the progression of coronary arterial calcification observed in ESRD patients is secondary to the onset and duration of dialysis itself. Prior studies have shown that coronary calcification in CKD and ESRD patients is associated mainly with age, dialysis vintage, dyslipidemia, and more inconsistently, serum levels of calcium, phosphorus, calcium-phosphorus product, and parathyroid hormone. 27 Meanwhile, computed tomography (CT), intravascular ultrasound, and OCT studies have shown a clear correlation between diabetic status and coronary arterial calcification, and findings from analyses of large epidemiological studies not only reinforce the importance of this relationship specifically in the setting of kidney disease, but also suggest that coronary calcification (and presumably overall plaque burden) is already present, severe, and, most importantly, clinically significant before dialysis initiation.11–19,28,29 Furthermore, an analysis of the Dallas Heart Study by Kramer et al. using electron beam CT demonstrated a significant attenuation in the relationship between CKD stage and coronary calcification when controlling for diabetes. They found no significant associations between CKD stage and coronary calcification among patients without diabetes, and a greater prevalence of mild, moderate, and severe calcium scores in patients with diabetes alone than in patients with CKD alone. 19 Similarly, Budoff et al. showed with CT imaging that while there was a graded relationship between declining renal function (eGFR) and coronary calcification, diabetes was the single most important risk factor for coronary calcification (OR 2.51 for diabetes vs OR 1.49 for eGFR ⩽ 30) among participants in the Chronic Renal Insufficiency Cohort (CRIC) Study. 28 Finally, a substudy of the Multi-Ethnic Study of Atherosclerosis (MESA) revealed that in 562 patients with CKD and no history of clinical cardiovascular disease, only diabetic status, not biomarkers of kidney function (cystatin C or albuminuria), predicted coronary calcification progression. 29
In contrast, two notable OCT analyses challenge the association between diabetes and coronary calcification. In a study of 91 patients, Milzi et al. found no significant difference in calcium burden, location, size, or shape between patients with diabetes and patients without diabetes; however, the study’s main inclusion criteria required the presence of coronary calcification on OCT leading to the exclusion of seven patients and may have introduced a bias by excluding patients without OCT calcification. 30 Similarly, in a study of 250 patients, Krishnamoorthy et al. found diabetes predicted less coronary arterial calcification volume; however, average lesion length was shorter (15–18 mm) in comparison to the 20 mm segments analyzed in our study. 31 It is therefore possible that calcifications outside of the analyzed segment were missed in the shorter lesions leading to an underestimation of calcium burden.
Diabetes duration, dialysis duration, and calcification burden
Chin et al. showed with OCT that more extensive coronary calcification is associated with longer dialysis durations. 24 In contrast, Sugiyama et al. were unable to show a positive correlation between dialysis duration and coronary calcification as determined by arc, thickness, length, or depth by OCT. 23 Despite our study population’s relatively short median dialysis duration (0.9 years), a correlation between dialysis duration and coronary arterial calcification was still observed. Our findings are congruent with previous studies, but the clinical significance of this finding remains to be consistently demonstrated.32–35 Furthermore, the correlation between dialysis duration and coronary calcification progression may be confounded by pre-existing coronary calcification as degree of calcification progression in dialyzed patients also appears to be correlated with degree of baseline calcification. 34 Unfortunately, data on our patient’s baseline coronary arterial calcification was unavailable.
We failed to show a positive correlation between calcium burden and duration of diabetes as has been previously reported in a recent analysis of data from the Coronary Artery Risk Development in Young Adults (CARDIA) Study. Reis et al. showed with CT that each 5-year longer period of diabetes and pre-diabetes was associated with a 1.15 and 1.07 hazard ratio for the presence of coronary artery calcium respectively. 36 One reason for our discrepant results may have been that diabetes duration was underestimated given that the relevant chart and laboratory data was retrospectively collected, and recognition of the disease state may have occurred years after its true onset.
Coronary calcification depth
In our study both ESRD and DM groups exhibited more superficially located calcium deposits when compared to patients without diabetes. With OCT, Sugiyama et al. found that ESRD was associated with a shallower depth of calcification compared to CKD and non-CKD controls with a median calcium depth of 40 µm (IQR 30–85 µm), which was shallower than our ESRD-DM group’s mean of 140 ± 0.02 µm. These findings are further consistent with a postmortem histological analysis of coronary arteries of CKD patients that found extensive intimal calcification but no evidence of medial calcification. 5 Our study further challenges the assumption that diabetes, CKD, and ESRD are mainly associated with medial rather than intimal calcification in the coronary arteries. 37
Potential mechanisms of coronary calcification in diabetes and CKD
Although the exact mechanism behind calcification in patients with diabetes, CKD, and/or ESRD remains to be fully elucidated, several compelling explanations link diabetes and CKD to the advanced atherosclerotic disease observed in new ESRD patients. Advanced glycation end products (AGEs) and receptors for advanced glycation end products (RAGEs) are found in higher concentrations in patients with diabetes due to prolonged exposure to increased circulating levels of glucose, galactose, and fructose. Binding of these end products with their receptors in vascular smooth muscle cells downregulates native vascular smooth muscle cell gene markers via protein kinase C and increases expression of bone matrix proteins such as alkaline phosphatase, resulting in an osteoblast-like phenotypic differentiation. This suggests a direct link between the high glucose milieu found in patients with diabetes and deposition of hydroxyapatite into the vascular extracellular matrix. 38 Furthermore, S100A12, another ligand of receptors for advanced glycation end products, has been shown to accumulate in diabetes and ESRD and induces osteoblastic differentiation of smooth muscle cells.39,40 Similar mechanisms are involved in the pathogenesis of coronary calcification in CKD, including vascular smooth muscle cell apoptosis induced by mechanical stress, vasoactive substances, oxidized LDL, inflammatory mediators, and possibly inorganic phosphate, followed by differentiation of vascular smooth muscle cells to osteoblast-like cells. 41
In conclusion, while calcium burden is positively correlated with dialysis duration in patients with ESRD and diabetes, calcification in ESRD-DM patients and in patients with diabetes alone appeared similar in terms of overall burden, deposit size, and depth within the arterial wall. The similarity between these groups highlights the importance of diabetic disease in the process of coronary calcification. The notable increase in coronary calcification and cardiovascular disease events seen in ESRD patients with diabetes may not be secondary to the onset of dialysis, but instead may be due to a combination of factors including the deleterious effects of declining renal function and diabetes mellitus.
Limitations
While OCT provides the ability to spatially resolve calcium in the coronary artery beyond that allowed by CT, OCT is a technically challenging and complex technique. Therefore, studies employing OCT often have a limited sample size. (1) Our study was a single-center, retrospective study with a small sample size. (2) Since implementation of OCT during catheterization was up to the discretion of the operator, our data was obtained from a very small pool of candidates for review, and a formal propensity analysis could not be performed, we cannot fully exclude the possibility of a selection bias. (3) The ESRD-DM cohort was comprised of patients with short dialysis durations (IQR: 0.5–2.6) whose risk factors and plaque characteristics may differ from those with longer dialysis durations. However, according to the 2018 USRDS annual data report, the expected remaining lifetime for male and female ESRD patients older than age 60 (ESRD patients in our study had an average age of 61.8) was only 5.6 and 5.7 years respectively. 1 (4) A fourth cohort comprised of patients with ESRD but without diabetes was unattainable as the majority of ESRD patients in our registry had comorbid diabetes. (5) OCT is prone to inherent limitations including the inability to analyze micro-calcifications as well as a limited penetration depth, which makes identification of the deep trailing edge of calcium and subsequent area measurements of deep deposits difficult.42,43 Due to this limited penetration depth, it is not possible to image medial calcification in the coronary vessels outside of exceptional cases. Instead, in severely diseased atherosclerotic coronary vessels, it is the atherosclerotic plaque within the medial border which is imaged, and which has eliminated a true intimal layer. (6) Prior studies have shown that Hispanic patients have a lower relative risk for coronary calcification compared to white patients, 44 and our ESRD-DM group was comprised of a larger proportion of Hispanic patients. (7) Warfarin use has been shown to be associated with progressive coronary atheroma calcification. 45 While warfarin use was higher in the DM group, there was no statistical difference in warfarin use between groups. (8) There is a possibility of survival bias leading to an underestimation of coronary calcification in the ESRD-DM group as prior studies have shown that the rate of cardiovascular events in ESRD patients are significantly more frequent early in the course of dialysis. 46 This may be somewhat mitigated by our study population’s relatively short dialysis vintage.
Footnotes
Acknowledgements
We would like to thank members of the Loyola University Medical Center Intravascular Imaging Group for their contributions.
Declaration of conflicting interests
The author(s) declared the following potential conflicts of interest with respect to the research, authorship, and/or publication of this article: Dr. Lopez is a consultant for Abbott-St Jude, runs educational training programs related to OCT, and is an investigator in clinical trials with OCT (research support and honoraria from Abbott-St Jude categorized as “modest”). No other authors have any conflicts to discuss.
Funding
The author(s) disclosed receipt of the following financial support for the research, authorship, and/or publication of this article: This study was partly supported by a grant from the National Heart, Lung, and Blood Institute (NHLBI) of the National Institutes of Health (NIH) through 1T35HL120835 and by the Czech Health Research Council of Czech Republic, AZV 16-28525A.