
Abstract
We investigated whether prediabetes diagnosed by hemoglobinA1c (HbA1c) or oral glucose tolerance test (OGTT) could predict presence and severity of coronary artery disease (CAD) in symptomatic patients. The presence of plaque, stenosis, plaque characteristics, and coronary artery calcium (CAC) were evaluated by coronary CT angiography in 702 patients with suspicion of CAD. Patients were classified by glycemic status using the American Diabetes Association criteria for HbA1c and OGTT, and compared to their respective normal ranges. Prediabetes was observed in 24% by HbA1c and 72% by OGTT. Both prediabetes classifications were associated with increased presence of plaque, stenosis, calcified plaques, CAC >400, and a lower frequency of zero CAC compared to their respective normal range (all, p < 0.05). After adjusting for potential confounders, patients with HbA1c-prediabetes had an odds ratio of 2.1 (95% CI: 1.3–3.5) for CAC >400 and 1.5 (95% CI: 1.0–2.4) for plaque presence, while none of the associations for OGTT-prediabetes were significant. The receiver operating characteristic-curve for HbA1c-prediabetes showed an area under the curve of 0.81 for CAC >400 and 0.77 for plaque presence. Prediabetes defined by HbA1c predicts presence and severity of CAD. Although OGTT identified more patients with prediabetes, their risk of CAD were not explained by prediabetes using these diagnostic-criteria.
Keywords
Introduction
Abnormal glycemic status defined as type 2 diabetes mellitus (T2DM) and its precursor, prediabetes, are frequently seen in patients with known coronary artery disease (CAD). 1 The presence of prediabetes worsens the prognosis of CAD, 2 as patients with prediabetes and T2DM are known to have an almost doubled cardiovascular (CV) mortality risk compared to normoglycemic patients. 3 According to guidelines, early detection of abnormal glucose regulation is essential, as evidence suggests that intensive glycemic control has a more favorable CV effect if initiated early in the course of T2DM. 4 To diagnose T2DM and prediabetes fasting plasma glucose (FPG), oral glucose tolerance test (OGTT), and glycated hemoglobinA1c (HbA1c) can be used. However, it is an ongoing discussion which of these tests is the most preferable to identify patients with abnormal glycemic status at risk of CAD. The discussion is directed at the lower sensitivity of FPG and HbA1c, whereas the OGTT is criticized for being time-consuming and with low reproducibility. 5
In clinical practice, HbA1c has largely replaced the OGTT in the diagnosis of prediabetes and T2DM. However, the background for the diabetic HbA1c threshold is based on the development of microvascular complications, 6 and regarding prediabetes progression to T2DM. 7 It is still unclear whether substituting OGTT with HbA1c results in an underestimation of patients with prediabetes who are at a high risk of CAD, or if HbA1c can predict macrovascular complications in patients with prediabetes. Therefore, this study aimed to examine if HbA1c- or OGTT-diagnosed prediabetes could predict presence and severity of CAD in patients suspected of chronic coronary syndrome (CCS).
Methods
Study design
This was a single-center, open-labeled, descriptive cross-sectional study of patients referred to a coronary CT angiography (CCTA) due to suspicion of CCS. Patients were seen in the Outpatient Clinic of Cardiology at Odense University Hospital, Svendborg, between February 2018 and December 2020. The Regional Committees on Health Research Ethics for Southern Denmark (ID S-20170094), as well as the Danish Data Protection Agency (ID 18/5857) approved the study.
Study population Inclusion criteria were; 1) age >18 years, 2) capable of giving written informed consent, 3) referred for a CCTA due to suspicion of chronic coronary syndrome. Exclusion criteria were: 1) Body mass index (BMI) > 40, 2) irregular or fast heart rhythm inadequate for CCTA, 3) reduced kidney function with estimated glomerular filtration rate (eGFR) < 45 mL/min, 4) contrast allergy, 5) known diabetes mellitus, 6) diagnosis of new T2DM by HbA1c or OGTT, 7) known previous CAD.
Patients were divided according to their glycemic status through HbA1c and OGTT. OGTT: Participants were instructed in fasting for at least 8 h before the OGTT. FPG was measured, 75-g glucose dissolved in 250 mL water was ingested over 5 min and 2 h later postprandial plasma glucose (2 h-PG) was measured. HbA1c- and OGTT-prediabetes were classified according to the American Diabetes Association (ADA). 7
Seven hundred and ninety-three patients were eligible for participation, of whom 91 patients were excluded due to a new diagnosis of T2DM by either HbA1c and/or OGTT (see Figure 1). Study flowchart of the study population. HbA1c, HemoglobinA1c; OGTT, Oral Glucose Tolerance Test.
Patients were separated into the following groups:
1) HbA1c: HbA1c-prediabetes: Patients were classified as having prediabetes when HbA1c was in the range of 39–47 mmol/mol (5.7–6.4%). These were compared to HbA1c-normal: classified by having a HbA1c < 39 mmol/mol (<5.7%).
2) OGTT: OGTT-prediabetes: Patients were classified as having prediabetes by OGTT when their FPG and/or 2h-PG levels indicated either impaired fasting glucose (IFG) and/or impaired glucose tolerance (IGT). These were compared to OGTT-normal: classified by OGTT showing normal glycemic status (NGS) (see Figure 2). Classification of prediabetes and new diabetes. Figure 2 displays the various glycemic range classifications and provides conversion factors between NGSP, IFCC and eAG units. HbA1c, HemoglobinA1c; OGTT, Oral Glucose Tolerance Test; IFCC, International Federation of Clinical Chemistry and Laboratory Medicine; NGSP, National Glycohemoglobin Standardization Program; eAG, estimated Average Glucose; FPG, Fasting Plasma Glucose; 2h-PG = 2 h Plasma Glucose; IFG, Impaired Fasting Glucose; IGT, Impaired Glucose Tolerance.
Blood samples were obtained and analyzed for HbA1c, total cholesterol, low-density lipoprotein (LDL), high-density lipoprotein (HDL), triglyceride, creatinine, eGFR, and C-reactive protein (CRP). Remnant cholesterol was calculated as total cholesterol minus LDL minus HDL. Other cardiovascular risk factors were accessed through a questionnaire about age, height, weight, symptom presentation, smoking, history of CAD, and medication. Arterial hypertension and dyslipidemia were considered present if the patients were on respectively antihypertensive or lipid-lowering medication. The Canadian Cardiovascular Society classification was used to grade angina symptoms. 8 Written and oral consent was obtained for each participant before the examination.
Image protocol and analysis
All patients underwent CCTA using the same 256-slice scanner (GE Healthcare, Revolution, Milwaukee, WI, USA). Every participant received oral 7.5 mg Ivabradine × 2 one day before the scan, and patients with a heart rate>65 bpm right before the scanning, were given incremental doses of 5 mg intravenous Metoprolol until a maximum of 30 mg. Coronary artery calcium (CAC) score was determined based on the scoring system described by Agatson et al, 9 To evaluate plaque and stenosis presence and characteristics, a contrast-enhanced coronary artery scan was subsequently performed. For image analysis, the 16-segment coronary artery tree based on the American Heart Association guidelines was used. 10 An experienced cardiologist analyzed all CT-scans. Coronary plaques were considered present when structures >1 mm2 were detected within or adjacent to the lumen. Significant coronary stenosis was defined as >50% narrowing of the lumen. Plaques were categorized as calcified (exclusively content with density >130 Hounsfield units) or soft (exclusively content with density <130 Hounsfield units).
Statistical analysis
Statistical analysis was performed using Stata 17.0 software (StataCorp. 2019. College Station). Categorical variables were expressed as counts with proportions, and numerical variables as mean ± standard deviation (SD). To compare categorical variables between groups Pearson’s chi-squared test or Fisher’s exact test (when groups consisted of 5 or fewer observations) were used. Linear regression was used for comparison between groups for numerical variables. Logistic regression models were performed to evaluate the relationship between glycemic status and CCTA outcomes. Adjusted odds ratios (OR) with 95% confidence interval (CI) for the logistic regression were estimated. Logistic regression was performed as two models. Model 1 was adjusted for non-modifiable risk factors: Age and sex. Model 2 was adjusted for the following coronary artery risk factors: Age, sex, BMI, smoking status, antihypertensive- and lipid-lowering medication. Logistic models were used to generate receiver operating characteristic (ROC) curves, which were tested by tenfold cross validation test. Sensitivity and specificity were calculated from the Youden Index. A p-value below 0.05 was considered statistically significant.
Results
Population characteristics and prevalence of prediabetes
Baseline characteristics of study patients according to glycemic status.

Values are given as mean ± standard deviation (SD) or number and proportion (%).
*p < 0.05 compared with normal glycemic status.
HbA1c, Hemoglobin A1c; OGTT, Oral Glucose Tolerance Test; BMI, Body Mass Index; BP, Blood Pressure; CAD, Coronary Artery Disease; LDL, Low-Density Lipoprotein; HDL, High-Density Lipoprotein; eGFR, estimated Glomerular Filtration Rate; CRP, C-Reactive Protein; HbA1c, HemoglobinA1c; FPG, Fasting Plasma glucose; 2h-PG, 2 h plasma glucose; IFG, Impaired Fasting Glucose; IGT, Impaired Glucose Tolerance; DM, Diabetes Mellitus.
CCTA findings
Coronary CT angiography findings according to glycemic status.
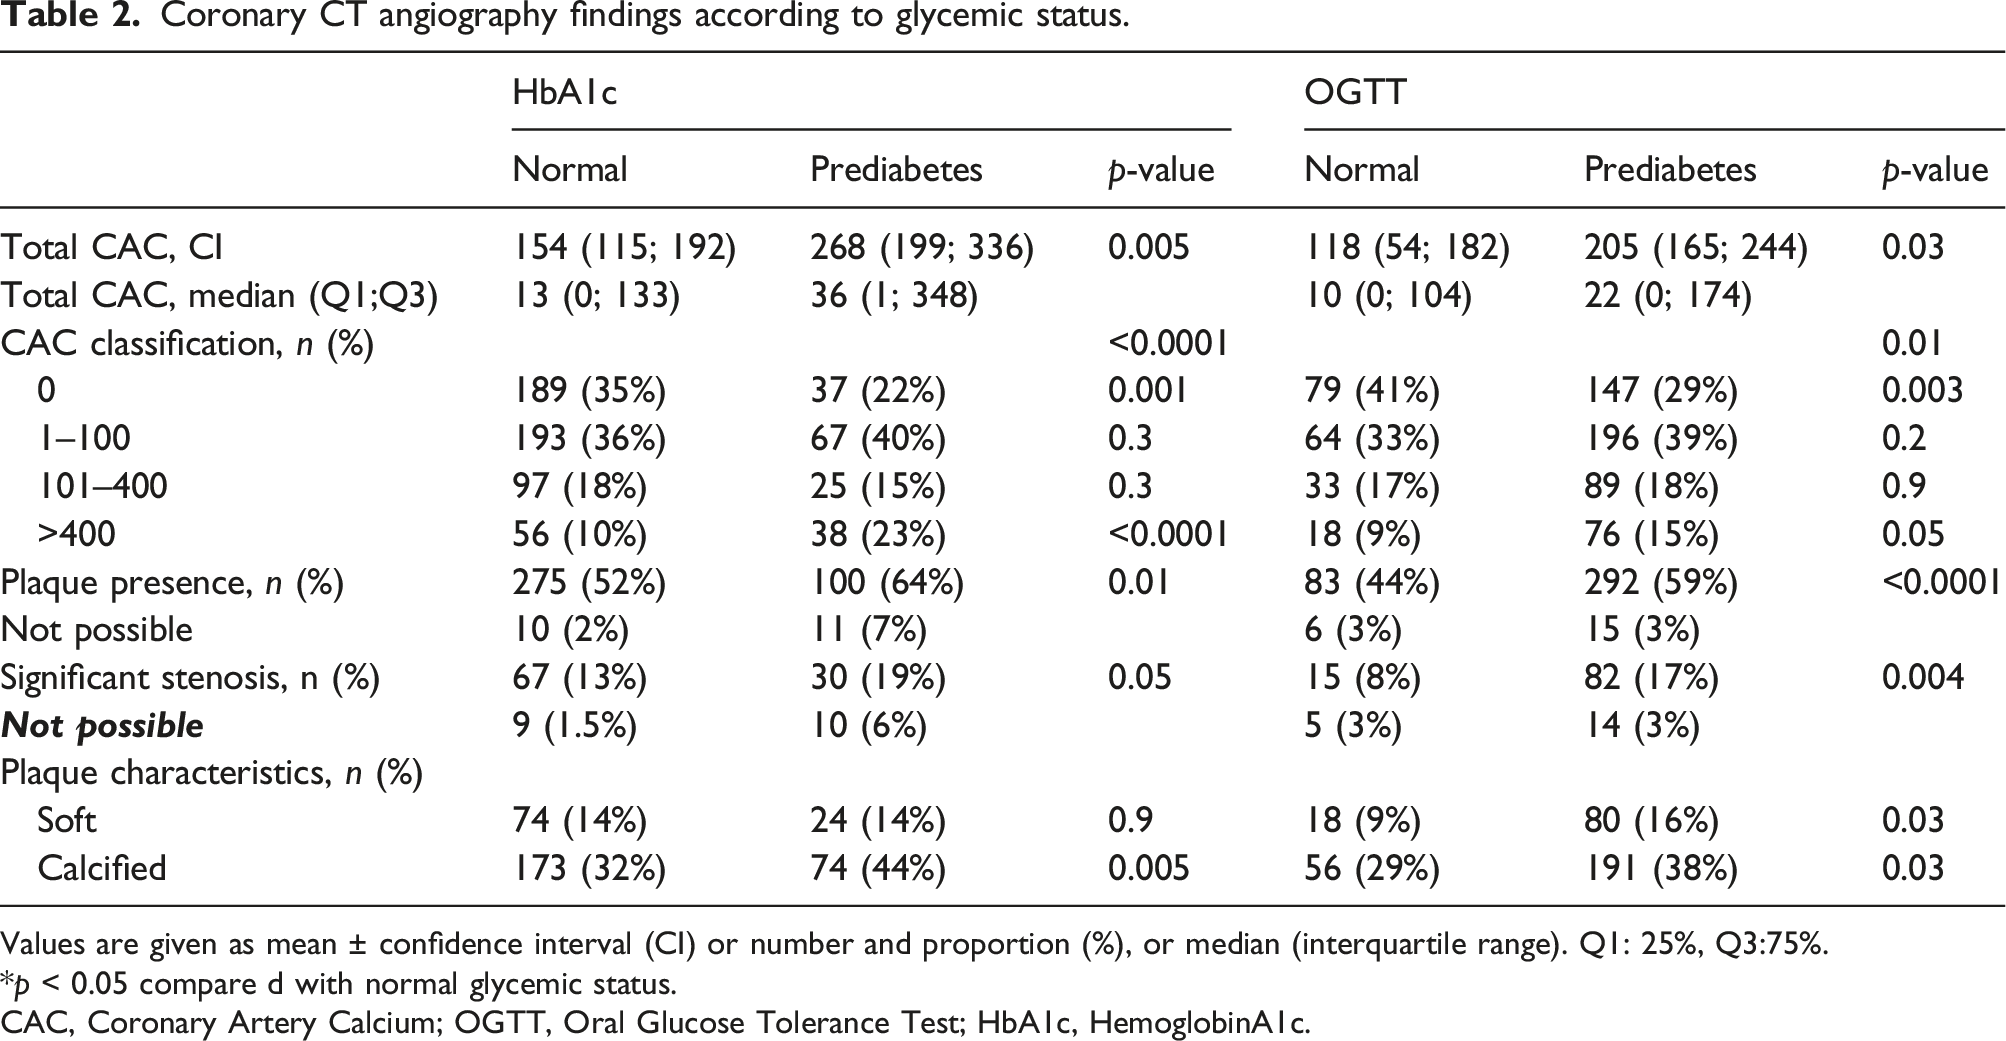
Values are given as mean ± confidence interval (CI) or number and proportion (%), or median (interquartile range). Q1: 25%, Q3:75%.
*p < 0.05 compare d with normal glycemic status.
CAC, Coronary Artery Calcium; OGTT, Oral Glucose Tolerance Test; HbA1c, HemoglobinA1c.

(a)–(d): CCTA findings regarding CAC score, plaque- and stenosis presence, and plaque characteristics in patients with normal glycemic status and prediabetes.
Association between glycemic status and CCTA
Logistic regression of CCTA outcomes for the two classifications of prediabetes.
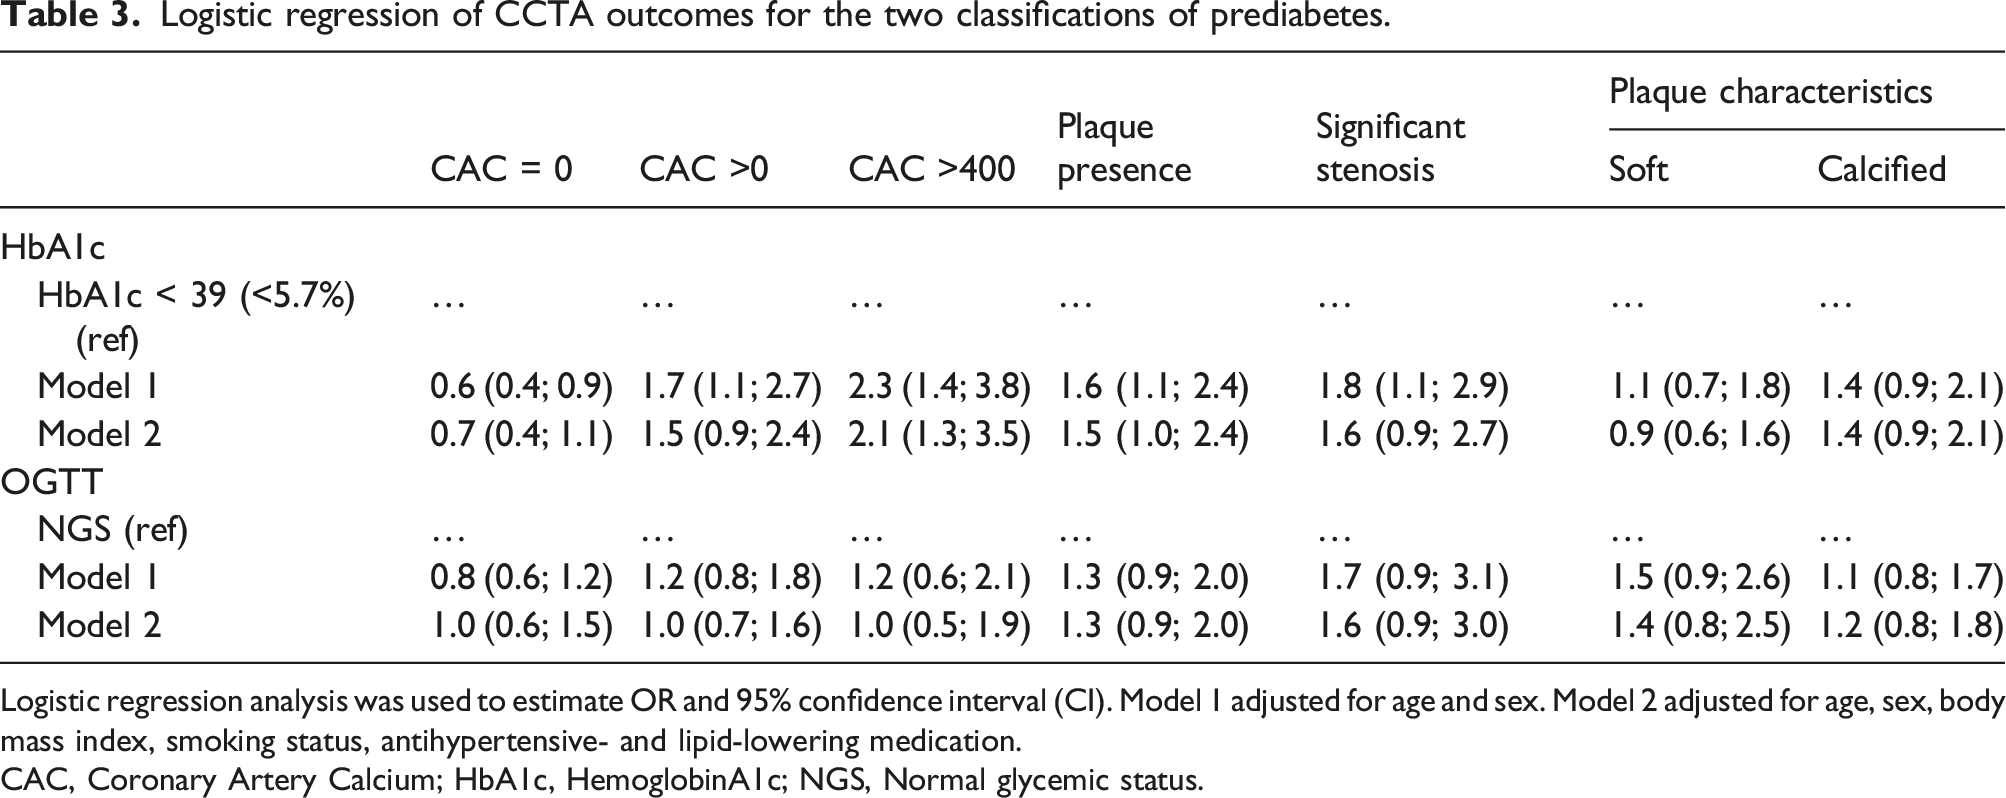
Logistic regression analysis was used to estimate OR and 95% confidence interval (CI). Model 1 adjusted for age and sex. Model 2 adjusted for age, sex, body mass index, smoking status, antihypertensive- and lipid-lowering medication.
CAC, Coronary Artery Calcium; HbA1c, HemoglobinA1c; NGS, Normal glycemic status.
Prediction of CAD presence and severity through HbA1c
We used the significant logistic models to generate a receiver operating characteristic (ROC) curve. Since the odds ratios for the patients with OGTT-prediabetes were not statistically significant, meaning that associations between OGTT-prediabetes and calcium-score (regardless of score), presence of plaque, significant stenosis, and plaque characteristics could not be confirmed, no further analyses were done. Models for HbA1c were used to assess the ability of HbA1c-prediabetes to predict the presence and severity of CAD. The area under the curve (AUC) for HbA1c-prediabetes and CAC greater than 400 was 0.81 (Figure 4) and the AUC for the presence of plaque was 0.77. The sensitivity and specificity were calculated for the patients with HbA1c-prediabetes for CAC greater than 400 (sensitivity 84%, specificity 66%) and presence of plaque (sensitivity 75%, specificity 66%) (Table 4). ROC curve for CAC >400 and plaque presence for HbA1c-prediabetes. Sensitivity and specificity for CAC >400 and plaque presence for HbA1c-prediabetes. CAC = Coronary Artery Calcium.

Discussion
We have studied the association of HbA1c and OGTT with presence and severity of CAD in patients suspected of CCS. The main findings of this study are as follows: 1) Prediabetes defined by HbA1c can predict presence and severity of CAD 2) OGTT identified more as having prediabetes, however, their risk of CAD was similar to those without prediabetes in analysis adjusted for age and sex.
CAC and prediabetes
This study measured presence of plaque and CAC-score, as an indicator for presence and severity of CAD in patients with suspicion of CCS. We divided the patients into two groups according to their HbA1c and OGTT results. We identified the patients with HbA1c-prediabetes as having a significantly greater risk of a high CAC-score. We found a 2.1-fold exceeded risk of CAC >400, even after adjustment for modifiable and non-modifiable risk factors. There is consensus of a CAC >400 as an expression of the severity of CAD. A meta-analysis 11 showed that CAC-scores >400 are associated with very high relative risks (Hazard Ratio: 4.3–17.0) of coronary heart disease events. On the other hand, we found that the patients with HbA1c-prediabetes had low odds of a CAC-score of zero when adjusted for sex and age. Zero CAC is known to be associated with very low cardiovascular events. 12 After further adjustment for modifiable risk factors, this association did however not remain significant. Suggesting that a significant part of the excess risk was attributable to coronary artery risk factors, i.e. metabolic syndrome. Our findings are in line with other studies. Several studies have assessed the association between prediabetes and CAC-score, and have all reliably shown crude associations. Four studies13–16 found significant associations between HbA1c in the prediabetic-range and CAC-score. On the other hand, three studies17–19 found that the relationship disappeared when adjusting for risk factors. There were some significant differences between our study and the aforementioned, as the participants in these studies were all asymptomatic compared to our participants, who had suspicion of CCS. Our results on CAC-score exhibited slightly higher scores compared to the positive studies, which would also be expected when taking into account that our population already had suspicion of CCS. Another explanation could also be that our population was older, which is known to increase CAC-score. 20
HbA1c vs. OGTT
We found that HbA1c could predict presence and severity of CAD, expressed by ROC-curves for plaque presence with an AUC = 0.77 and CAC >400 with an AUC = 0.81, whereas none of the OGTT logistic models were statistically significant. These results are in line with findings from other large, prospective studies. The ARIC-study, 21 a prospective cohort study following 11,000 participants over two decades, found the ADA HbA1c-classification of prediabetes to be a better classifier of future risk of CV disease and mortality compared to FPG and 2h-PG. Similarly, a prospective study of 31,000 participants from Metcalf et al. 22 found that HbA1c showed a stronger association with CV disease and mortality compared to OGTT. On the other hand, in our study, we observed that the OGTT classified prediabetes in two-thirds of the patients, whereas HbA1c only classified prediabetes in a quarter of the patients. This means that the OGTT classified three times as many patients with prediabetes compared to the HbA1c. In preventive aim, it is a challenge to decide on whether identifying a large number, including many at low risk of CAD (ie. OGTT), and on the other hand, using a specific test (ie. HbA1c) that might miss some high-risk patients who would benefit from prophylactic treatment. In support of the HbA1c, the Whitehall II cohort study 23 of almost 6,000 participants examined OGTT-diagnosed diabetes that could or could not be confirmed by HbA1c in 4 years of follow-up. They found that individuals who could not be confirmed by HbA1c were at a similar risk of CV disease as the diabetes-free population. Therefore, they concluded that the replacement of OGTT with HbA1c in clinical practice seemed justified. We presented a subgroup analysis of patients who were classified as having prediabetes based on both HbA1c and OGTT (Supplementary Table S1). Our findings suggest that the results for the combined prediabetes group were comparable to those for the HbA1c-prediabetes group, which we argue in support of the HbA1c. A large meta-analysis 24 of 129 studies, involving 10 million participants, distinguishing between different classifications of prediabetes found comparable results when looking at HbA1c and OGTT in the general population. Nonetheless, they emphasized the advantages of HbA1c compared to OGTT, as it is easier to perform, less time-consuming, and with less intra-individual variability.
Limitations
First, a limitation of our study lies in the cross-sectional design with no possibility to repeat glycemic measures and a lack of prospective follow-up to evaluate the progression to T2DM and CV events. This also meant that we could not establish the manifest diagnosis of new diabetes. To assure that we did not overestimate the results, we excluded patients with HbA1c ≥ 48 (n = 12) and new T2DM (n = 91) by OGTT (see Figure 1). Secondly, when performing a CCTA the calcium-scan was initially conducted, if CAC-score exceeds 1000, in some of the cases, a contrast scan could not be performed (n = 18). Therefore potential plaques and significant stenosis could not be measured in these patients. This could underestimate the results regarding plaque- and stenosis presence. To approach this problem, we performed a sensitivity analysis where a CAC >1000 (n = 18) resulted in presence of plaques and significant stenosis (Supplementary Table S2). Both results regarding patients with HbA1c-prediabetes were statistically significant in both adjustment models. Patients with OGTT-prediabetes had a significant association to stenosis when adjusting for age and sex. However, when accounting for other cardiovascular risk factors in model 2, this association was no longer significant. As a result, we do not consider the impact of these few cases to be substantial.
Implications
Patients with CAD have an increased frequency of abnormal glucose regulation, and therefore screening for T2DM is recommended in patients with newly confirmed CAD. 25 Our results suggest that it may be relevant to lower the bar and start screening for prediabetes as well. This might already be done, when patients are referred to further examination due to suspicion of CCS. The justification for screening for prediabetes in this population is the possibility of reducing progression to T2DM. There is evidence that prophylactic prevention can delay or even prevent progression to T2DM.4,26,27 Studies have shown a relative risk reduction of up to 50% with appropriate lifestyle interventions. 25 Secondly, there is a substantially greater risk for recurrent CV events and mortality, when suffering from both diseases. 28
Conclusion
Prediabetes defined by HbA1c predicts presence and severity of CAD. Although OGTT identified more patients as having prediabetes, our results suggest that their risk of CAD were not explained by prediabetes using these diagnostic-criteria. Our results support the replacement of OGTT with HbA1c as a diagnostic tool for prediabetes in patients with suspected CCS.
Supplemental Material
Can prediabetes diagnosed using HemoglobinA1c or oral glucose tolerance test predict presence and severity of coronary artery disease in symptomatic patients?
Supplemental material for Can prediabetes diagnosed using HemoglobinA1c or oral glucose tolerance test predict presence and severity of coronary artery disease in symptomatic patients? by Katrine S Overgaard, Thomas R Andersen, Roda A Mohamed, Laurits J Heinsen, Helle G Binderup, Sören Möller, Søren Auscher, Jess Lambrechtsen and Kenneth Egstrup in Diabetes & Vascular Disease Research Journal
Footnotes
Acknowledgements
The authors thanks the student team working on the project, who helped collect data. We would also like to thank the clinical biochemical department for their invaluable collaboration in collecting data (HB in charge). The authors would also like to thank the statistics advisor from OPEN, SM.
Author contributions
KO wrote the manuscript with assistance from TA and RM. LH, SA, and JL reviewed the manuscript. KE initiated and directed the study and reviewed the manuscript. Study data were collected and managed using REDCap electronic data capture tools hosted at OPEN, Odense University Hospital. All authors revised the manuscript critically for important intellectual content and approved the final version before submission.
Declaration of conflicting interests
The author(s) declared no potential conflicts of interest with respect to the research, authorship, and/or publication of this article.
Funding
The author(s) received no financial support for the research, authorship, and/or publication of this article.
Supplemental Material
Supplemental material for this article is available online.
References
Supplementary Material
Please find the following supplemental material available below.
For Open Access articles published under a Creative Commons License, all supplemental material carries the same license as the article it is associated with.
For non-Open Access articles published, all supplemental material carries a non-exclusive license, and permission requests for re-use of supplemental material or any part of supplemental material shall be sent directly to the copyright owner as specified in the copyright notice associated with the article.