
Abstract
Aim:
To investigate the thrombotic microenvironment in early stages of type 2 diabetes mellitus measuring platelet-derived, endothelial-derived and erythrocyte-derived microvesicles.
Methods:
We recruited 50 newly diagnosed type 2 diabetes mellitus patients who did not receive glucose-lowering treatment except for metformin and 25 matched non-type 2 diabetes mellitus volunteers. Microvesicles were measured with flow cytometry, glycated haemoglobin with high-performance liquid chromatography and advanced glycation end products with enzyme-linked immunosorbent assay.
Results:
Type 2 diabetes mellitus patients showed significantly higher levels of platelet-derived microvesicles [195/μL (115–409) vs 110/μL (73–150), p = 0.001] and erythrocyte-derived microvesicles [26/μL (9–100) vs 9/μL (4–25), p = 0.007] compared to non-type 2 diabetes mellitus individuals. Platelet-derived microvesicles were positively associated with fasting blood glucose (p = 0.026) and glycated haemoglobin (p = 0.002). Erythrocyte-derived microvesicles were also positively associated with fasting blood glucose (p = 0.018) but not with glycated haemoglobin (p = 0.193). No significant association was observed between platelet-derived microvesicles (p = 0.126) or erythrocyte-derived microvesicles (p = 0.857) and advanced glycation end products. Erythrocyte-derived microvesicles predicted the presence of type 2 diabetes mellitus, independently of platelet-derived microvesicles.
Conclusion:
In newly diagnosed type 2 diabetes mellitus, ongoing atherothrombosis is evident during the early stages as evidenced by increased microvesicles levels. Furthermore, the association with glycemic profile suggests that microvesicles represent not only a novel mechanism by which hyperglycemia amplifies thrombotic tendency in type 2 diabetes mellitus but also early markers of thrombosis highlighting the need for earlier management of hyperglycemia.
Introduction
Microvesicles (MVs) are small membrane vesicles (0.1–1 μm in diameter) shed into the extracellular space from various cell types upon cell activation or apoptosis.1,2 Their name stems from the cells they originally come from: endothelial-derived (EMVs), erythrocyte-derived (ErMVs) and platelet-derived (PMVs) microvesicles. EMVs have been associated with endothelial dysfunction, PMVs with platelet activation and ErMVs with thrombus formation and stability.3–5 Initially regarded as insignificant cellular dust, MVs have been extensively studied over the last few years. Under healthy conditions, they are produced in low numbers, contributing to the regulation of physiological processes, including coagulation, inflammation and endothelial function. In contrast, in the presence of cardiovascular risk factors, MVs are released in large numbers that differ in composition and function and exert multiple deleterious biological effects such as pro-coagulant and pro-inflammatory properties, contributing to endothelial dysfunction and the development of cardiovascular disease. 6 MVs are significantly increased in several cardiovascular disease states such as hypertension, diabetes mellitus (DM), dyslipidemia and in coronary artery disease. Consequently, MVs have been proposed as a novel biomarker reflecting disrupted vascular homeostasis.7–9
Type 2 diabetes mellitus (T2DM) is a disease associated with significant cardiovascular morbidity and mortality mainly attributed to microvascular and macrovascular complications and to the clustering with other cardiovascular risk factors, such as obesity, hypertension and dyslipidemia. 10 All these conditions share a common pathophysiologic environment of inflammation, hypercoagulability and endothelial dysfunction, rendering DM a disease of accelerated atherosclerosis and enhanced cardiovascular risk. In this disarranged microenvironment, MVs, apart from biomarkers of vascular dysfunction, could contribute significantly to the pathogenesis and progression of the disease.11–14
Indeed, accumulating evidence indicate that MVs are significantly increased in patients with long-standing T2DM15–19 and correlate with the severity of microvascular and macrovascular complications.14,20–22 However, potential factors leading to their initial release in diabetic patients remain largely unknown.14,23 Importantly, information regarding the effect of glycemia or insulin is scarce,16,19 whereas the effect of advanced glycation end products (AGEs) has never been studied. Furthermore, no studies in newly diagnosed T2DM have ever assessed PMVs and ErMVs which are increasingly recognized as potential contributors to the atherothrombotic process. 24 On top of these, studies in newly diagnosed T2DM are extremely rare, suffering from methodological problems, namely in defining this very difficult to recruit population.
Therefore, the aim of this study was to assess the thrombotic and inflammatory microenvironment at the very early stages of a meticulously selected population of patients with newly diagnosed T2DM by measuring the levels of circulating EMVs, ErMVs and PMVs. In an attempt to explore possible contributing factors, we further tried to associate levels of MVs with factors related to disease emergence and severity such as glucose, glycated haemoglobin (HbA1c) and AGEs.
Methods
A total of 50 patients with T2DM recruited from the Diabetes Outpatient Unit and 25 matched non-T2DM volunteers, aged 18–75 years, were enrolled in the study. Patients were eligible to participate provided they had a very recent diagnosis of diabetes, that did not exceed 6 months, and they did not receive any glucose-lowering treatment with the only exception of metformin. In particular, diagnosis was based on two abnormal glucose tests; fasting blood glucose (FBG) ⩾ 126 mg/dL in two measurements in separate days and/or 2-hr post-load glucose ⩾ 200 mg/dL in oral glucose tolerance test (OGTT, 75 gr) when it was necessary.25,26 In addition, only patients with normal FBG or not diagnostic OGTT within a year’s time prior to diagnosis were included, verified from previous medical records including those of the annual health check-up. Exclusion criteria were as follows: established cardiovascular disease or stroke, chronic kidney disease [glomerular filtration rate (GFR) ⩽ 45 mL/min/1.73 m2], concomitant acute or chronic inflammatory diseases, malignancy, pregnancy and any medication (including antiplatelets and anticoagulants) except from antihypertensive agents, based on self-report and a review of medical records and prescribed medication. All measurements were performed between 9:00 and 11:00 am with the participants having refrained from food, coffee and smoking for at least 10 h. The study protocol was conducted in accordance with the principles of the Helsinki Declaration and was approved by the Ethics Committee of Aristotle University of Thessaloniki. All participants were Caucasian, and a written informed consent was obtained before inclusion in the study.
Biochemical profile
Plasma glucose, lipids [total cholesterol, low-density lipoprotein (LDL)-cholesterol, high-density lipoprotein (HDL)-cholesterol, triglycerides], kidney and liver function were determined using routine laboratory techniques under fasting conditions. Glycated haemoglobin (HbA1c) was measured using high-performance liquid chromatography (HPLC). Enzyme-linked immunosorbent assay (ELISA) was applied to detect and quantify AGEs in patient sera collected and stored in −80°C. Commercially available human AGE ELISA Kit (AMSbio, Abingdon, UK) with a detection range of 4.69–300 ng/mL and sensitivity of 2.813 ng/mL was used.
Assessment of office blood pressure
Office blood pressure (BP) was measured in the sitting position using a validated oscillometric device (Microlife Exact BP, Microlife AG, Widnau, Switzerland) according to standard recommendations for office BP measurement. 27 The mean of the second and third value of three consecutive measurements with a 2-min interval in the arm with the higher BP was considered as the patients’ office BP.
Assessment of microalbuminuria
Urinary albumin excretion (UAE) was calculated in 24-h urine samples, which is considered as the gold standard for the diagnosis of microalbuminuria, by immuno-turbidimetric method. Levels of UAE between 30 and 300 mg/24 h were defined as microalbuminuria. 28 Participants were advised against any change in their usual dietary habits.
Blood sampling for MVs quantitation
Blood samples for MV measurements were collected in citrated tubes (sodium citrate 3.2%) and centrifuged within 30 min with a two-step centrifugation protocol (2500×g for 15 min at room temperature, followed by a second centrifugation of the supernatant at the same condition). Supernatant was collected, and platelet poor plasma was stored at −80°C. 29 MVs detection was then performed on thawed samples using a CyFlow Cube8 ROBBY flow cytometer (Sysmex Partec GmbH, Goerlitz, Germany). Preliminary experiments showed excellent reproducibility in samples stored less than 2 weeks (coefficient of variation < 10%). Therefore, all samples were analysed in less than 2 weeks from collection.
MVs quantitation
Flow cytometry protocol was standardized based on previous studies. 29 Background noise was checked using ultrapure water at less than 2000 events/s (flow rate ~10,000 events/s). The following fluorochrome coupled antibodies and their corresponding isotypes were used for MVs detection: anti-CD105 and anti-CD144 PE (Immunostep, Salamanca, Spain) for EMVs, anti-C235 PC7 (Immunostep) for ErMVs, anti-CD42a APC (Immunostep) for PMVs and Annexin V–fluorescein isothiocyanate (FITC; Immunotech SAS, Marseille, France). Megamix-Plus SSC beads (Biocytex, Marseille, France) calibrated from 0.16 to 0.5 mm were used to define an analysis window (gate) consistent with the size of MVs. Events less than 0.5 μm were identified in forward scatter and side scatter intensity dot representation, gated as a microparticle and then plotted on two-colour fluorescence histograms. Double-positive events for Annexin and each antibody characterizing the MVs origin, in the MVs region, were measured for EMVs, ErMVs and PMVs. MVs were then quantified using Flow-Count Fluorospheres (Beckman Coulter, Germany): [MVs counts × fluorospheres concentration (counts/μL) × fluorospheres volume (μL)]/fluorospheres counts × sample volume (μL). One independent flow cytometry specialist (E.Y.) who was not familiar with the participant’s clinical data performed the analysis using the FCS Express 4 (DeNovo Software, Glendale, CA, USA).
Statistical analysis
Data analysis was performed using Statistical Package for Social Sciences (SPSS, SPSS Inc., Chicago, IL, USA) software, version 22. Results were expressed as frequencies for qualitative variables and as mean ± standard deviation (SD) or median (Q1–Q3, interquartile range) for continuous variables, according to the normality of their distribution. Categorical data were expressed as rate and compared by chi-squared test. Logarithmic transformation was performed when necessary. Differences between groups were evaluated by the t-test for parametric and Mann–Whitney test for nonparametric variables. Correlations between continuous variables were performed with the parametric Pearson or the nonparametric Spearman’s Rho correlation coefficient. A probability value of p ⩽ 0.05 was considered statistically significant. Due to the difficulty of patient recruitment and the lack of previous studies on the same MVs and population, post hoc power analysis was performed. In unequal sample size of 1:2 with 90% statistical power at 5% level of significance, the total sample size required for differences in ErMVs values was 74 individuals.
Results
Baseline characteristics
A total of 75 subjects, 50 patients with newly diagnosed T2DM and 25 non-T2DM individuals matched for age, sex, smoking and their medical history of hypertension and dyslipidemia were enrolled in the study. Baseline characteristics of the population are depicted in Table 1. The majority of patients (65.3%) with T2DM were diagnosed less than 1 month earlier, while the remaining had median disease duration of 3 (1–5.5) months. As expected, patients with T2DM had significantly higher fasting plasma glucose (130 ± 45.5 mg/dL vs 92.7 ± 7.5 mg/dL, p < 0.001) and HbA1c [6.9% (6.4–8.2) vs 5.3% (5.0–5.6), p < 0.001] compared to non-T2DM individuals. Only 40% of T2DM patients were receiving metformin for a median of 2.5 weeks (1–11). Not surprisingly, T2DM patients had significantly higher triglycerides (p = 0.002), lower HDL levels (p < 0.001) and higher body mass index (BMI; p < 0.001), consistent with the adverse metabolic profile frequently observed in diabetic individuals. In addition, patients with T2DM had higher GFR values as expected by the hyperfiltration observed in the early stages of DM (p < 0.001). Apart from the above parameters, biochemical profile and office BP were similar between the groups, as depicted in Table 1.
Baseline characteristics of the study population.
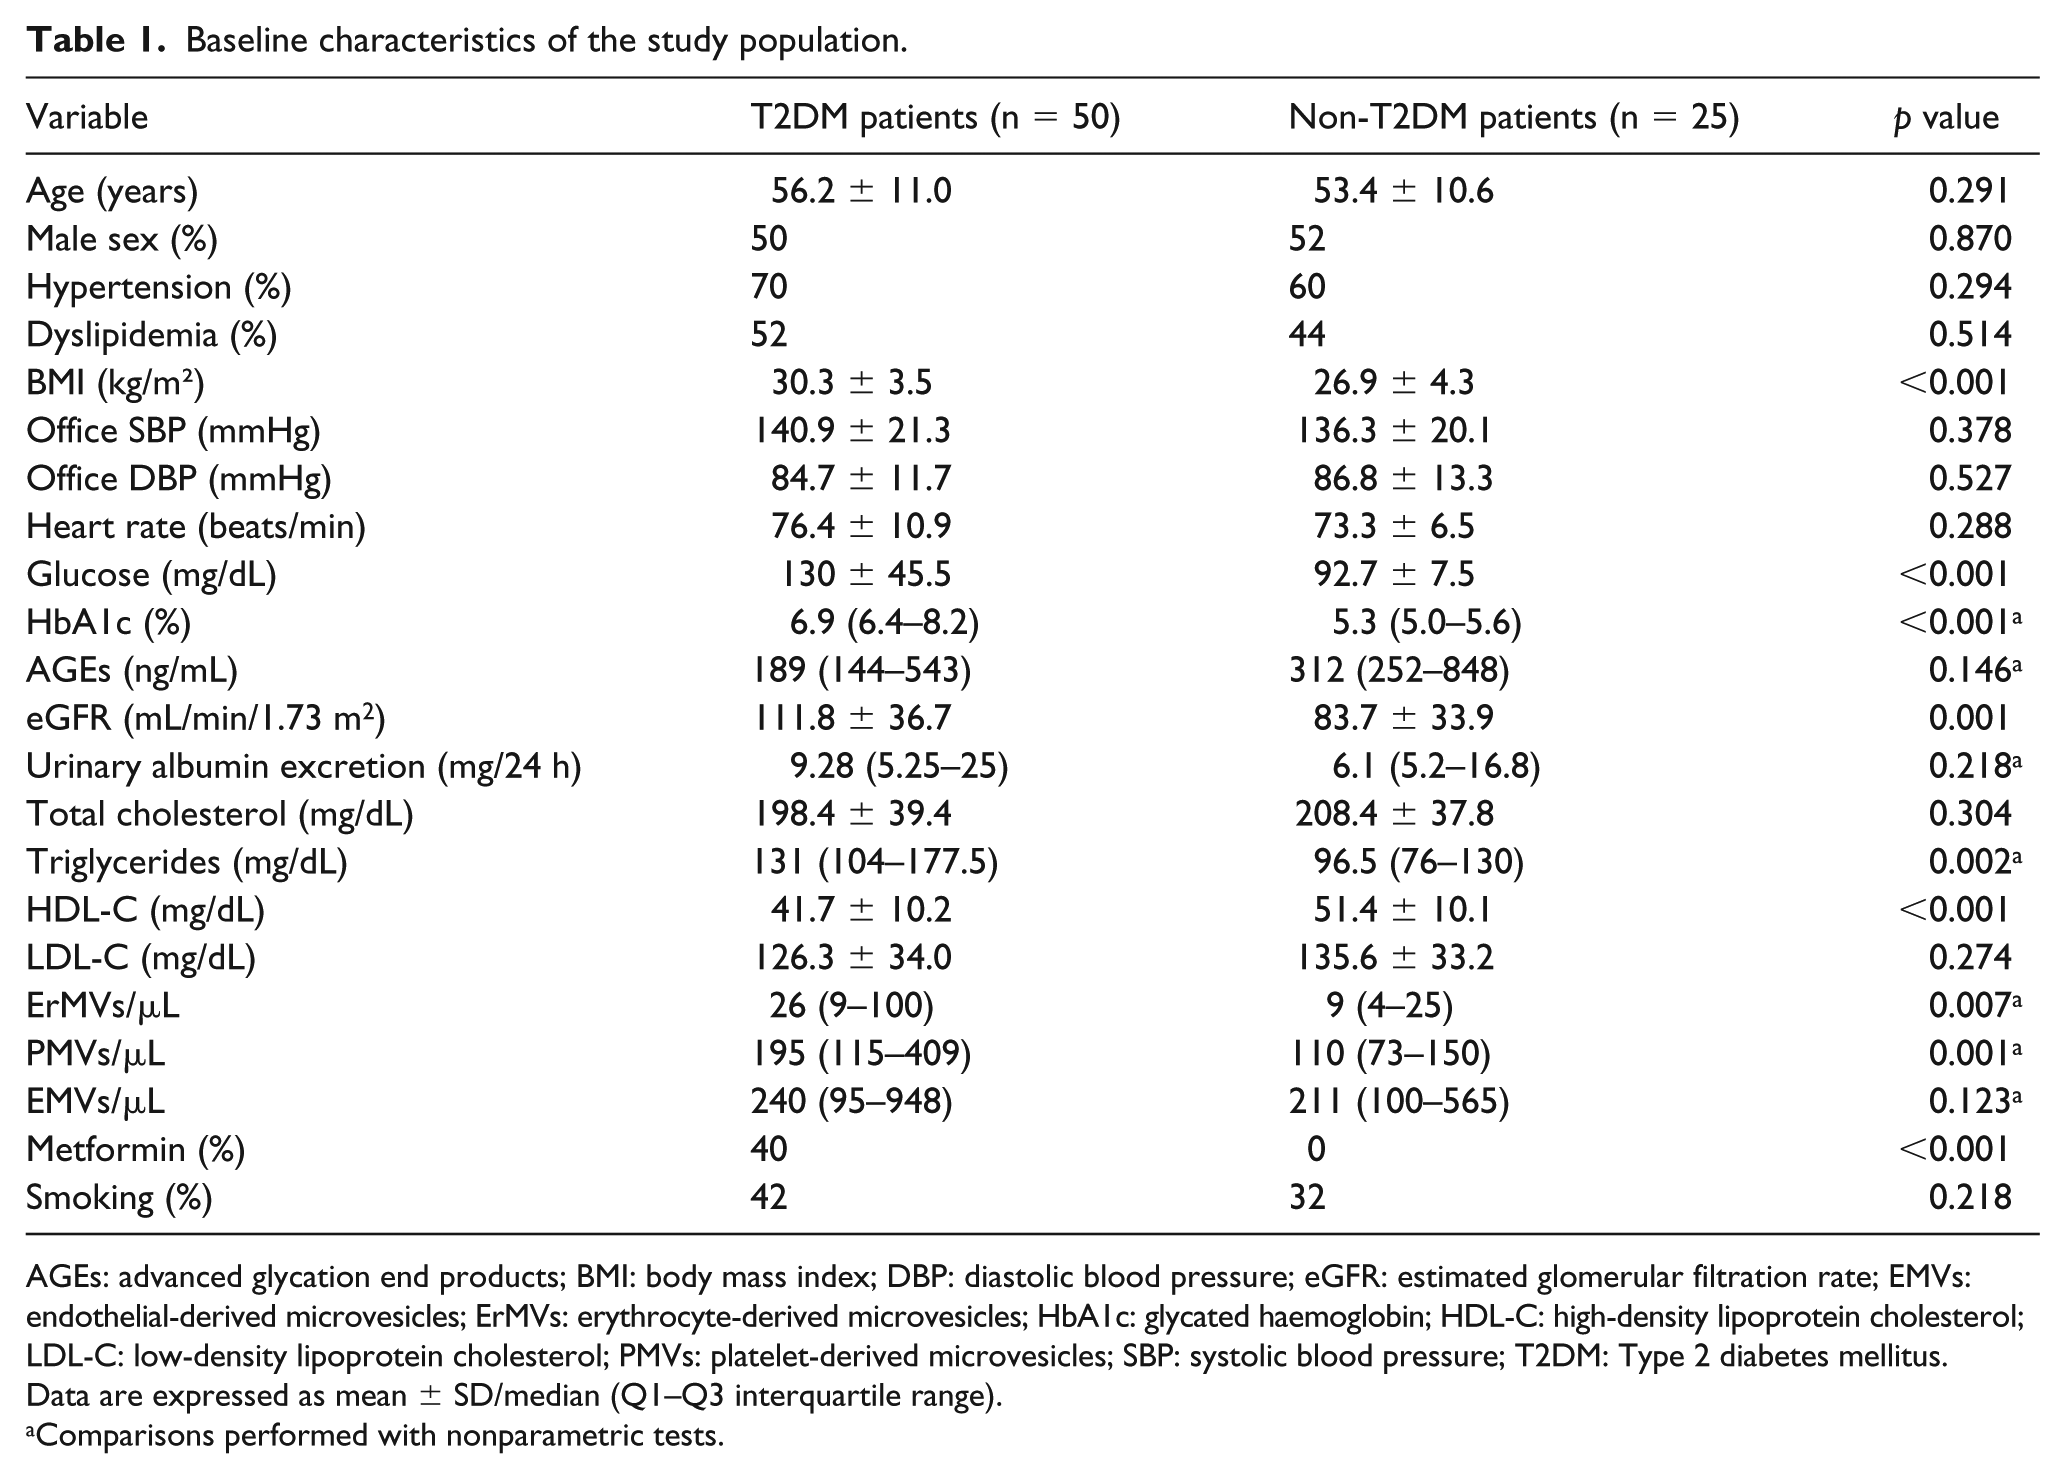
AGEs: advanced glycation end products; BMI: body mass index; DBP: diastolic blood pressure; eGFR: estimated glomerular filtration rate; EMVs: endothelial-derived microvesicles; ErMVs: erythrocyte-derived microvesicles; HbA1c: glycated haemoglobin; HDL-C: high-density lipoprotein cholesterol; LDL-C: low-density lipoprotein cholesterol; PMVs: platelet-derived microvesicles; SBP: systolic blood pressure; T2DM: Type 2 diabetes mellitus.
Data are expressed as mean ± SD/median (Q1–Q3 interquartile range).
Comparisons performed with nonparametric tests.
Levels of circulating MVs
Patients with T2DM displayed significantly higher levels of circulating PMVs [195/μL (115–409) vs 110/μL (73–150), p = 0.001] and ErMVs [26/μL (9–100) vs 9/μL (4–25), p = 0.007] as compared with non-T2DM individuals. However, EMVs were not different between T2DM and non-T2DM individuals [240/μL (95–948) vs 211/μL (100–565), p = 0.123], as depicted in Table 1. Figure 1 depicts differences in circulating MVs.
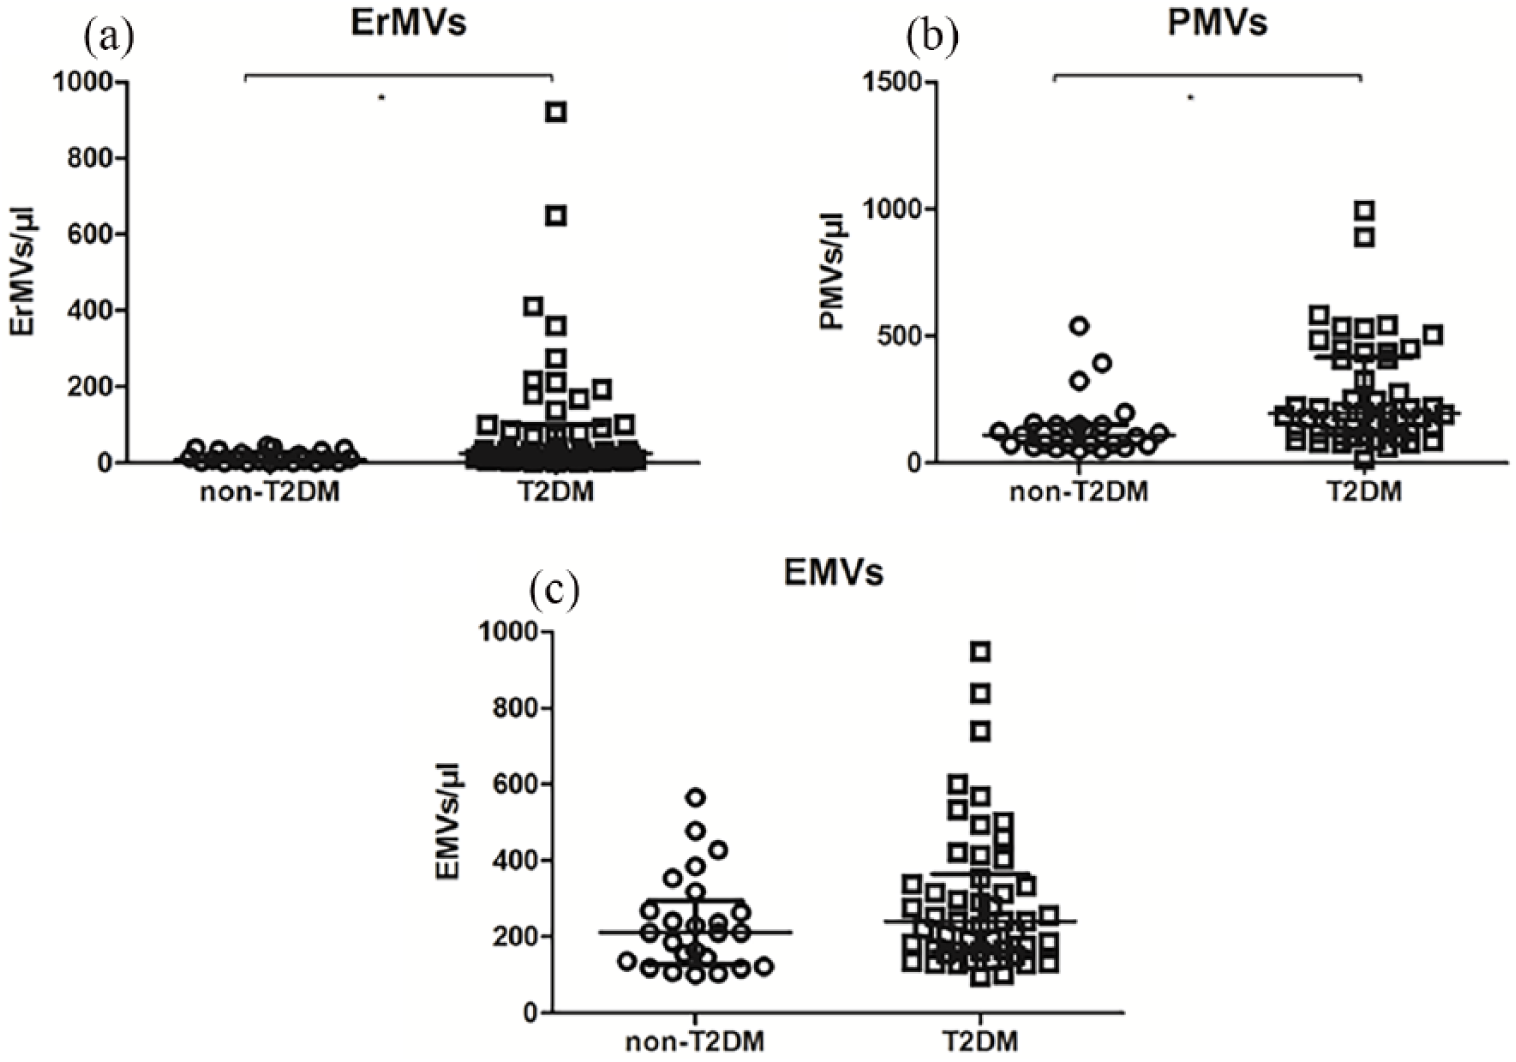
Circulating MVs in T2DM versus non-T2DM patients: (a) ErMVs, (b) PMVs and (c) EMVs.
Correlations between MVs and patient characteristics
We further sought to investigate if there was any association between elevated levels of ErMVs and PMVs and the glycemic profile of the total study group (Table 2). Plasma levels of PMVs were positively correlated with levels of FBG (r = 0.261, p = 0.026) and HbA1c (r = 0.350, p = 0.002). Levels of ErMVs were also positively correlated with FBG (r = 0.276, p = 0.018) but not with HbA1c (r = 0.152, p = 0.193). No significant association was observed between PMVs (r = 0.217, p = 0.126) or ErMVs (r = 0.026, p = 0.857) and AGEs. In addition, there was no significant association between MVs and other parameters studied, including office BP, lipids, BMI and microalbuminuria.
Correlations between plasma levels of MVs and indices of glycemia in total study population.
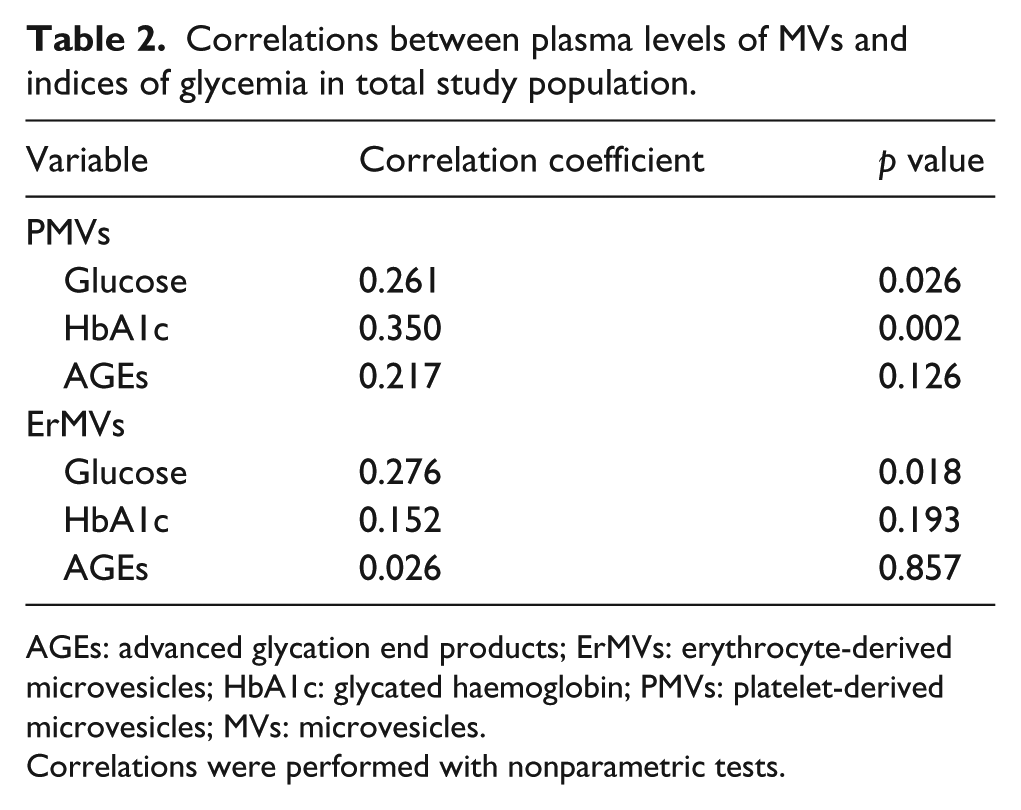
AGEs: advanced glycation end products; ErMVs: erythrocyte-derived microvesicles; HbA1c: glycated haemoglobin; PMVs: platelet-derived microvesicles; MVs: microvesicles.
Correlations were performed with nonparametric tests.
Discussion
T2DM is associated with increased cardiovascular mortality mainly attributed to the development of microvascular and macrovascular complications along with a coexistence of a cluster of cardiovascular risk factors such as hypertension, dyslipidemia and coronary artery disease.12,30–32 Our study measured, for the first time, novel markers of atherosclerosis and thrombosis in a carefully selected population of newly diagnosed diabetic individuals with T2DM at the very early stages of the disease. We further investigated possible associations between ErMVs and PMVs with factors related to DM emergence and severity such as glucose, HbA1c and AGEs. Our study provides some novel and interesting findings.
First, newly diagnosed patients with T2DM present markedly elevated levels of ErMVs as compared with non-T2DM individuals. This finding requires special consideration as it refers to a meticulously selected group of newly diagnosed T2DM patients who were carefully matched with the control group regarding several cardiovascular risk factors. A concrete amount of data has demonstrated that ErMVs are actively involved in the atherothrombotic process, promoting endothelial dysfunction, inflammation and coagulation.33–35 However, in cardiovascular clinical setting, there are only a few studies investigating the role of ErMVs. Helal et al. 36 showed significantly elevated levels of ErMVs in patients with metabolic syndrome, a condition characterized by an increased risk for T2DM. The fact that ErMVs can predict, independently, the presence of T2DM suggests that ErMVs may be elevated even from the early stages of the disease. Recently, the only study which measured ErMVs in T2DM was performed by Chiva-Blanch et al., 24 including patients with long-standing T2DM under treatment. There was no difference in ErMVs between T2DM and controls. However, this study refered to a totally different group compared to ours. Our study is the first to measure levels of ErMVs in patients with newly diagnosed T2DM, who were either untreated or receiving only metformin (40% of the subjects). Whether ErMVs are a mere clinical biomarker reflecting a microenvironment of ongoing thrombosis and inflammation or a mediator of atherothrombosis contributing to the long-term disease progression and diabetes-related complications needs to be investigated.
In an attempt to further explore the thrombotic microenvironment in newly diagnosed T2DM, we also measured levels of PMVs. T2DM is characterized by markedly altered platelet metabolism and distinct changes in intraplatelet signalling pathways that contribute to the atherothrombotic state of the disease.37,38 Moreover, PMVs actively interact with endothelial and white blood cells, regulating their function and thus promoting oxidative stress and inflammation.5,39 Accumulating data have shown that PMVs are significantly elevated in uncomplicated T2DM as well as in T2DM with microvascular and macrovascular complications 21 and may correlate with the severity of microvascular complications. 40 However, no study, so far, has measured PMVs in such an early stage of T2DM, whereas the majority of published studies do not comment on disease duration. The finding of significantly increased PMVs observed in our study not only confirms the ongoing thrombotic process in T2DM but also demonstrates that these events are present from the very early onset of the disease.
In contrast, EMVs were not significantly different between T2DM and control subjects. Endothelial dysfunction is the main pathophysiological pathway promoting atherosclerosis not only in T2DM but also in hypertension and dyslipidemia. 41 Our control group comprised such patients in an effort to match T2DM patients in the most accurate way. It is possible that the lack of difference between groups does not reflect the absence of ongoing endothelial damage during the early stages of diabetes. In contrast, it points towards the multifactorial origin of the endothelial dysfunction due to the clustering of multiple cardiovascular risk factors. Furthermore, a portion of our patients were on treatment with metformin. Recent data from T2DM animal models suggest that improvement of endothelial function may be observed even from the very early beginning of treatment with metformin. 42
We further sought to investigate any association between elevated levels of ErMVs and PMVs and factors of disease emergence and severity, such as FBG, HbA1c and AGEs. ErMVs showed a significant positive correlation with plasma glucose, whereas PMVs significantly correlated with plasma glucose and HbA1c. Of note, no association was found between MVs and AGEs. In T2DM patients, Feng et al. 43 showed that PMVs positively correlated with postprandial blood glucose (p = 0.031) but not HbA1c, whereas in another study, Sabatier et al. 19 found no correlation between MVs and fasting glycemia or HbA1c. However, in both studies, patients had long-lasting T2DM. Our finding of a positive correlation of PMVs and ErMVs with glycemic profile (FBG or HbA1c) in patients with newly diagnosed T2DM suggests that at such an early stage of the disease, hyperglycemia may trigger the atherothrombotic tendency described in DM.
Finally, no correlation was observed between PMVs, ErMVs and AGEs. AGEs represent an heterogeneous group of compounds formed in T2DM by oxidative and non-oxidative reactions between proteins and sugar residues. They have multiple deleterious effects since they form cross-links on extracellular matrix proteins, lipids and nucleic acids proteins and disrupt their normal functions or react with their specific receptors (RAGE), resulting in oxidative stress, proinflammatory signalling and thus vascular inflammatory responses.44–46 Levels of AGEs are also influenced by factors other than glycemia such as smoking and common diet. Production of AGEs has been linked with long-standing, significant hyperglycemia and as such, AGEs have been suggested as being major contributors to diabetic complications.47,48 However, our patients had a very recent diagnosis of T2DM and a very early stage of the disease as evidenced by the lack of diabetes-related complications.
The strengths of our study include the study sample which consisted of a meticulously selected group of newly diagnosed patients with T2DM who are rarely studied and very difficult to recruit. These patients were carefully matched with subjects sharing similar medical history apart from T2DM. Another strength of our study is the method used to measure MVs. MVs quantification and identification were performed with flow cytometry, the most established method according to guidelines. The limitations of our study include, first, the relatively small sample size. However, studies in patients with newly diagnosed T2DM are extremely rare suffering from methodological problems, namely in defining this very difficult to recruit population. In addition, no causative relationships can be drawn from this cross-sectional analysis.
Conclusion
In conclusion, in a population of newly diagnosed patients with T2DM free of long-term diabetes-related cardiovascular complications, levels of PMVs and ErMVs were significantly increased. ErMVs predict, independently, the presence of T2DM and thus are directly linked with the pathogenesis of the disease. Finally, the correlation between these two novel markers (ErMVs and PMVs) with the patient’s glycemic profile underlines the need for earlier and prompt diagnosis and treatment of hyperglycemia.
Footnotes
Acknowledgements
E.G. and B.N. contributed equally to this work.
Author contributions
E.G. and B.N. designed the study, actively participated in subjects’ enrollment and wrote the manuscript. E.l.G. and A.L. analysed and interpreted the data. E.Y. and D.M. performed cytometric measurements and edited the final manuscript. P.A. and I.Z. enrolled patients and edited the final manuscript. S.D. participated in study design and final approval of the manuscript. All authors read and approved the final manuscript.
Declaration of conflicting interests
The author(s) declared no potential conflicts of interest with respect to the research, authorship and/or publication of this article.
Funding
The author(s) received no financial support for the research, authorship and/or publication of this article.