
Abstract
Aims:
In type 2 diabetes, we aimed at clarifying the role of glycated haemoglobin variability and other risk factors in the development of the main micro-vascular complications: peripheral neuropathy, nephropathy and retinopathy.
Methods:
In a single-centre cohort of 900 patients, glycated haemoglobin variability was evaluated as intra-individual standard deviation, adjusted standard deviation and coefficient of variation of serially measured glycated haemoglobin in the 2-year period before a randomly selected index visit. We devised four models considering different aspects of glycated haemoglobin evolution. Multivariate stepwise logistic regression analysis was performed including the following covariates at the index visit: age, disease duration, body mass index, total cholesterol, high-density lipoprotein cholesterol, triglycerides, sex, smoking habit, hypertension, dyslipidemia, treatment with anti-diabetic drugs, occurrence of macro-vascular events and the presence of another micro-vascular complication.
Results:
Males with high mean glycated haemoglobin, long duration of diabetes, presence of macro-vascular events and retinopathy emerged at higher risk for peripheral neuropathy. Development of nephropathy was independently associated with higher glycated haemoglobin variability, older age, male sex, current smoking status, presence of retinopathy, of peripheral neuropathy and of hypertension. Higher mean glycated haemoglobin, younger age, longer duration of diabetes, reduced estimated glomerular filtration rate and the presence of peripheral neuropathy were significantly associated with increased incidence of retinopathy.
Conclusion:
Glycated haemoglobin variability was associated with increased incidence of nephropathy, while mean glycated haemoglobin emerged as independent risk factor for the development of retinopathy and peripheral neuropathy. The presence of macro-vascular events was positively correlated with peripheral neuropathy. Finally, the occurrence of another micro-vascular complication was found to be a stronger risk factor for developing another micro-vascular complication than the mean or variability of glycated haemoglobin.
Keywords
Introduction
Several studies suggest that, among other risk factors, glucose variability is associated with the onset of chronic complications of diabetes mellitus (DM).1–4 Evidence from the literature supports the concept that glucose fluctuations produce oxidative stress, endothelial dysfunction and inflammation, factors traditionally associated with the development of vascular damage.5–7 Glucose variability has been linked with macro-vascular disease in some studies, but the association with micro-vascular diseases still remains controversial.8–10 Glucose fluctuations can be evaluated both as short-term and long-term variability. Short-term glucose variability refers to within- or between-day fluctuations in an individual. Several parameters (especially standard deviation, SD) were analysed as a measure of short-term glucose variability, calculated from self-monitored blood glucose measurements or from continuous glucose monitoring (CGM). Previous studies indicated a correlation between short-term glucose variability and retinopathy in type 1 11 and/or type 2 12 DM. Although not univocal, a correlation with other micro-vascular complications was also suggested. 13 Glycated haemoglobin (HbA1c) has been used for decades as a measure of diabetes control. Its oscillations over a period of years can express long-term glucose variability. A recent meta-analysis investigated the effects of this variability on micro-vascular complications and mortality: for type 1 diabetes, seven studies showed an association between HbA1c variability and renal disease, retinopathy and cardiovascular events. Moving to type 2 DM, 13 studies indicated that HbA1c variability is associated with a higher risk of both renal disease and macro-vascular events. 14 However, comparison between these studies is not straightforward because a standardized measure to calculate HbA1c variability does not exist, resulting in a statistical heterogeneity in the methods used to measure HbA1c variability in the different studies. HbA1c variability can be calculated in a single patient as intra-individual standard deviation (HbA1c-SD). To overcome the problem of inter-individual differences in the number of HbA1c assessments (a few values would make the SD apparently greater than many values), HbA1c variability can also be expressed as adjusted standard deviation (ADJ-HbA1c-SD). Finally, to correct for larger SDs due to higher absolute values of average HbA1c (HbA1c-MEAN), it is possible to consider a normalized measure of HbA1c variability as the coefficient of variation of HbA1c (HbA1c-CV), calculated as the ratio between HbA1c-SD and the HbA1c-MEAN in a specific period.
In 2013, an Italian observational, prospective cohort study on 8260 patients with type 2 DM evaluated the role of HbA1c variability in the development of diabetic nephropathy (DN) and retinopathy (DR). 15 In this study, known with the Renal Insufficiency And Cardiovascular Events (RIACE), the variability of HbA1c was calculated as HbA1c-SD, ADJ-HbA1c-SD and as HbA1c-CV. RIACE analysis revealed that HbA1c variability affects albuminuria and albuminuric chronic kidney disease independently of HbA1c-MEAN. On the contrary, HbA1c variability had no effect on the development of DR, which was mainly dependent on HbA1c-MEAN. More recently, Foo et al. 16 found that both high HbA1c-MEAN levels and systolic blood pressure (SBP), but not their variability, were associated with moderate DR. A recent Asiatic study confirmed the role of HbA1c variability as a risk factor for the development and progression of DN in patients with type 2 DM and DR. Yun et al. 17 suggested a strong correlation between DN and advanced DR. In addition, triglyceride/high-density lipoprotein cholesterol (HDL-C) ratio was positively associated with increased incidence and progression of DN. HbA1c variability, computed as HbA1c-SD, ADJ-HbA1c-SD and HbA1c-CV in the last 2 years, was found to be associated with cardiac autonomic neuropathy (CAN) in a study by Jun et al. 18 Recently, an Australian study performed in adolescents with type 1 DM found a correlation between HbA1c-SD and the development of DN, DR and CAN, but not of diabetic peripheral neuropathy (DPN). 19
To the best of our knowledge, no study has yet evaluated the role of HbA1c variability in the development of DPN in type 2 DM. The aim of our study was to clarify, in patients with type 2 DM, the correlation between HbA1c variability and other risk factors on the main diabetic micro-vascular complications: DN, DR and DPN.
Materials and methods
Study design and subjects
A single-centre retrospective observational study was performed using an ambulatory electronic medical record (EMR). We evaluated 1020 individuals with type 2 DM, who attended our clinic at the Istituti Clinici Scientifici (ICS) Maugeri located in Pavia, Italy. The study conformed to the Declaration of Helsinki and was approved by the local Ethical committee. During routine ambulatory practice, clinical data about periodic follow-up encounters were collected. Moreover, information on patients’ drugs purchase and on the time of disease diagnosis was obtained from the data-warehouse of the Local Health Care Agency (LHCA), which traces the accesses to national health-care services of all citizens living in the Pavia area. We identified an enrolment visit (index visit), which was randomly selected during the follow-up at least 2 years after the first visit at our diabetes clinic. Our data set included patients treated between February 1999 and September 2016. To be enrolled in the study, patients were required to have undergone at least three outpatient consultations and at least three HbA1c measurements in the 2-year period preceding the index visit. Inclusion criteria were met in 900 patients with type 2 DM. At the time of the index visit, the following variables were collected: age, sex, body mass index (BMI), diabetes duration, smoking habit, serum HbA1c, low-density lipoprotein cholesterol (LDL-C), HDL-C, total cholesterol and triglycerides values, pharmacological treatment for diabetes (oral anti-diabetes drugs and insulin), lipid-lowering treatment and treatment for hypertension. Estimated glomerular filtration rate (eGFR) was calculated using the Chronic Kidney Disease Epidemiology Collaboration (CKD-EPI) equation. 20
The following comorbidities were also recorded: hypertension, dyslipidemia and macro-vascular events. The diagnosis of hypertension was obtained from patients’ medical history and/or by the official disease status provided by LHCA. Dyslipidemia was defined as high serum LDL-C (⩾2.50 mmol/L) and/or ongoing lipid-lowering treatment. The concentration of LDL-C was estimated by the Friedewald’s formula. The occurrence of macro-vascular events was defined by the following previously documented major acute events: myocardial infarction, coronary artery procedures (by-pass surgery or angioplasty), stroke (ischaemic or haemorrhagic), limb amputation, peripheral artery procedures (lower limb revascularization), foot ulcer or gangrene, carotid revascularization and surgery for aortic aneurysm.
Regarding micro-vascular complications, the patient was considered as having DN when his or her renal function was reduced, as assessed by a low eGFR (<60 mL/min/1.73 m²), when micro-albuminuria (urine albumin-to-creatinine ratio = 30–299 mg/g) was present in at least two spot morning urine samples or when a previous diagnosis of DN was rendered by a nephrologist consultation. Patients were considered to have DR when any of the following lesions were detected at dilated fundoscopy: micro-aneurysms, haemorrhages, cotton wool spots, intra-retinal micro-vascular abnormalities, hard exudates, venous beading and new vessels. As recommended by the American Diabetes Association (ADA) guidelines, DPN was screened by symptoms (pain and dysesthesias) and physical examination (pinprick and temperature sensation, 10 g monofilament, 128 Hz tuning fork and ankle reflexes). In all patients, other causes of neuropathy were excluded. The diagnosis was confirmed by electromyography and/or nerve conduction study. 21
Assessment of serum HbA1c (mean and variability)
Recently the International Federation of Clinical Chemistry (IFCC) 22 recommended a change from percent to mmol/mol in the reporting units for HbA1c. Due to the retrospective design of the study (data collection spanned from February 1999 to September 2016), HbA1c expressed in percentage unit was converted in the IFCC-recommended unit. Values were reported as percentage, followed by the mmol/mol equivalent. In the 2-year period before the index visit, exposure to hyperglycaemia was evaluated both as HbA1c-MEAN calculated as intra-individual HbA1c-MEAN and as HbA1c variability, the latter being expressed as the intra-individual HbA1c-SD, ADJ-HbA1c-SD and HbA1c-CV of serially measured HbA1c. In detail, for each patient, five parameters were calculated as follows: (1) number of HbA1c (HbA1c N) measures in the 2 years before the index visit; (2) HbA1c-MEAN in the observed period; (3) HbA1c-SD in the observed period; (4) HbA1c-CV = HbA1c-SD/HbA1c-MEAN; and (5) ADJ-HbA1c-SD = HbA1c-SD/sqrt (HbA1c.N/(HbA1c.N-1)), HbA1c-SD adjusted for the number of measurements. A mean number of five HbA1c measurements were available for each patient during the 2-year follow-up period.
Statistical analysis
The descriptive analyses report continuous variables as mean (±SD) and categorical variables as number of cases and percentage over the population. Continuous variables of our cohort were compared using Wilcoxon rank-sum test for two groups and Kruskall–Wallis test for multiple groups. Categorical variables were assessed using Pearson’s chi-square test.
For each investigated micro-vascular complication (DR, DN and DPN), we built four models, each considering different aspects of HbA1c evolution: (1) HbA1c-MEAN; (2) HbA1c-MEAN and HbA1c-SD; (3) HbA1c-MEAN and ADJ-HbA1c-SD and (4) HbA1c-CV.
Logistic regression analysis with backward stepwise variable selection was applied. In all regression models, independent continuous covariates were demographic data (age and diabetes duration at the index visit) and clinical/laboratory parameters (BMI, total cholesterol, HDL-C and triglycerides, all considered at the index visit). Categorical variables were: sex, smoking habit (categorized in three levels: current, former or never smoking), hypertension, dyslipidemia, macro-vascular events and treatment with anti-diabetic drugs in the 6 months before the index visit.
We also included in the analyses, the presence of another micro-vascular complication at the index visit: (1) eGFR (as a marker of DN) and the presence of DPN in the model for DR; (2) the presence of DPN and the presence of DR in the model for DN; and (3) eGFR (as a marker of DN) and the presence of DR in the model for DPN.
Results of these models were expressed as odds ratios (ODs) with their confidence interval (CI) stated at 95%. All two-sided p-values less than 0.05 were considered statistically significant. Statistical analyses were performed using SPSS, version 13.0 and R, version 3.1
Results
Clinical characteristics
A total of 900 patients (515 males and 385 females) were included in the study. Table 1 summarizes the demographic, clinical and laboratory features of our cohort, as assessed at the index visit. Overall, our patients’ population consisted of elderly (66.96 ± 10.00 years) overweight (BMI = 29.6 ± 5.28 kg/m2) people. Their mean duration of type 2 DM was 10.35 ± 8.37 years. The patients’ HbA1c-MEAN indicated an acceptable metabolic control (7.0 ± 0.9% equivalent to 53 ± 9 mmol/mol). When stratified by sex, female patients were older and with higher BMI. Male patients more frequently were smokers (current or former). At the index visit, 48.33% of patients showed a slightly reduced renal function (eGFR = 60–89 mL/min/1.73 m²). The prevalence of DPN, DR and DN was 13.66%, 12.00% and 18.33%, respectively. With the exception of DR, micro-vascular complications were more prevalent in male than in female patients. Regarding macro-vascular events, male patients were more complicated than the female ones. The mean lipid profile of the whole patients’ cohort was fairly good (HDL-C = 1.29 ± 0.35 mmol/L, triglycerides = 1.49 ± 0.98 mmol/L, LDL-C = 2.55 ± 0.75 mmol/L, total cholesterol = 4.52 ± 0.85 mmol/L), but was more at target in male than in female patients. Although no sex difference emerged in the percentage of patients receiving lipid-lowering treatment, the better lipid profile of male patients was probably a result of the lower target of LDL-C due to their higher rate of macro-vascular events and cardiovascular risk.
Demographic, clinical and laboratory features at the index visit of our study population, stratified by sex. P-values are referred to the comparison between the male and female patients.
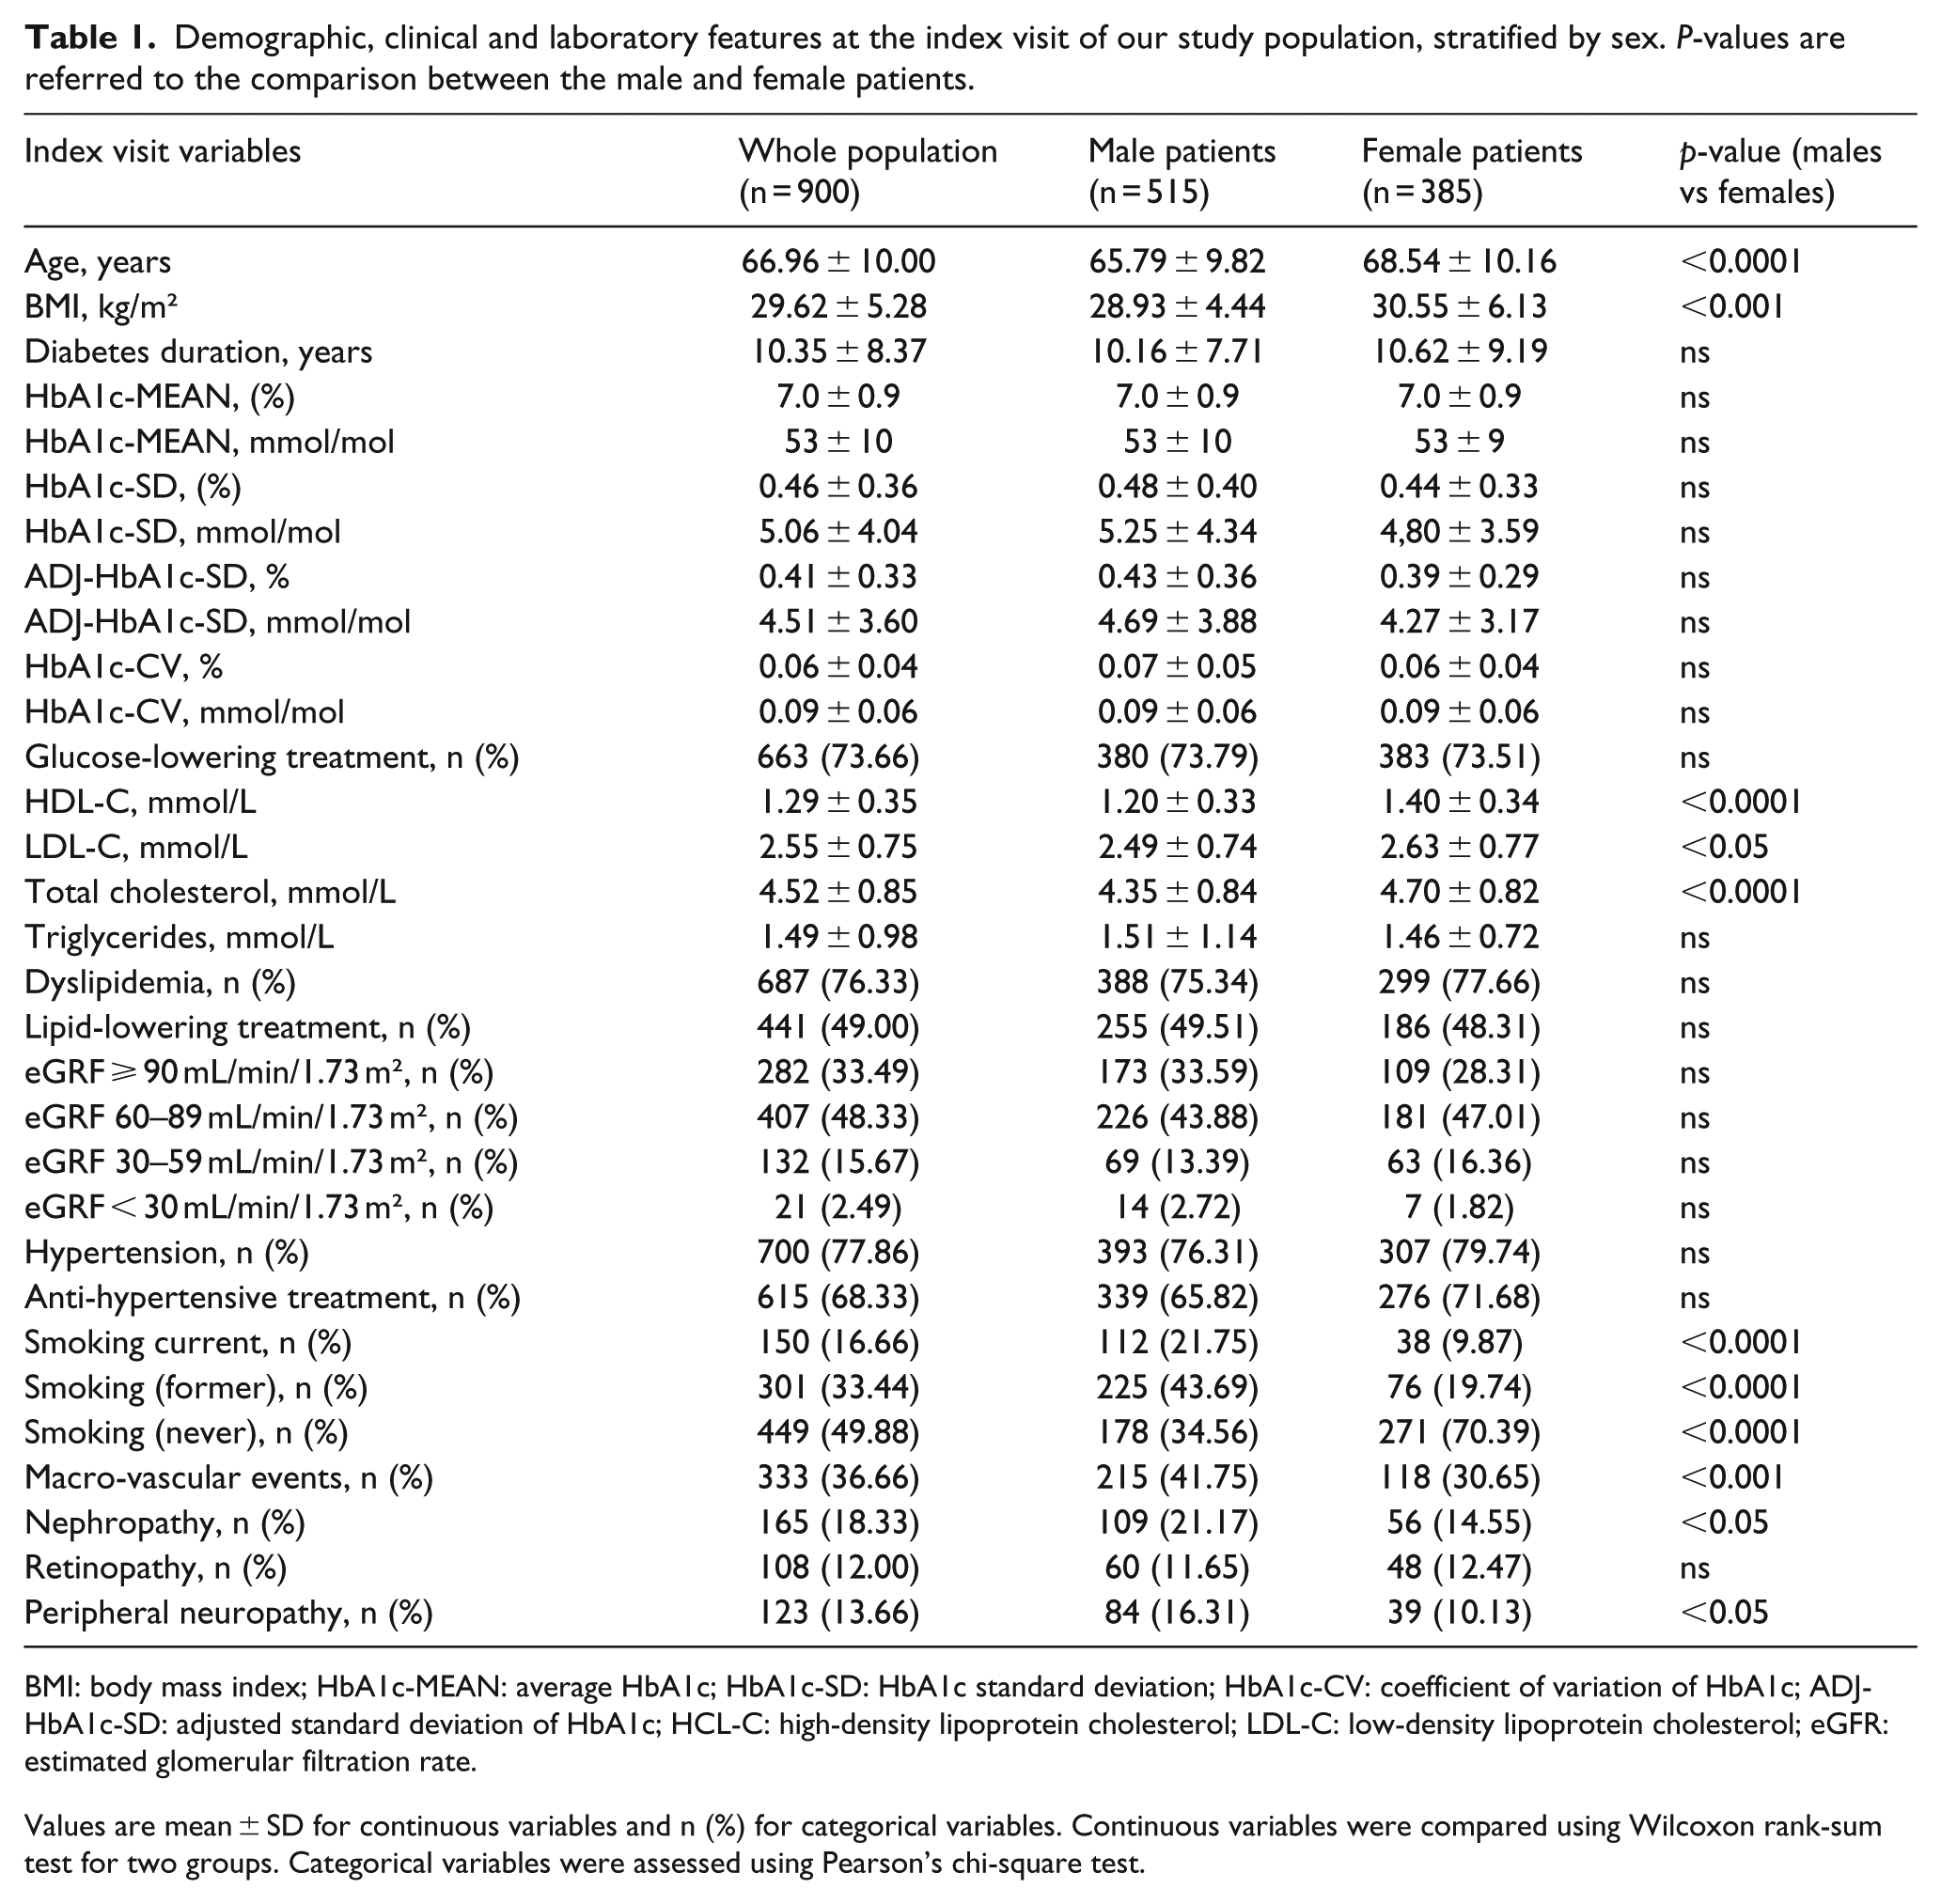
BMI: body mass index; HbA1c-MEAN: average HbA1c; HbA1c-SD: HbA1c standard deviation; HbA1c-CV: coefficient of variation of HbA1c; ADJ-HbA1c-SD: adjusted standard deviation of HbA1c; HCL-C: high-density lipoprotein cholesterol; LDL-C: low-density lipoprotein cholesterol; eGFR: estimated glomerular filtration rate.
Values are mean ± SD for continuous variables and n (%) for categorical variables. Continuous variables were compared using Wilcoxon rank-sum test for two groups. Categorical variables were assessed using Pearson’s chi-square test.
Risk factors for micro-vascular complications
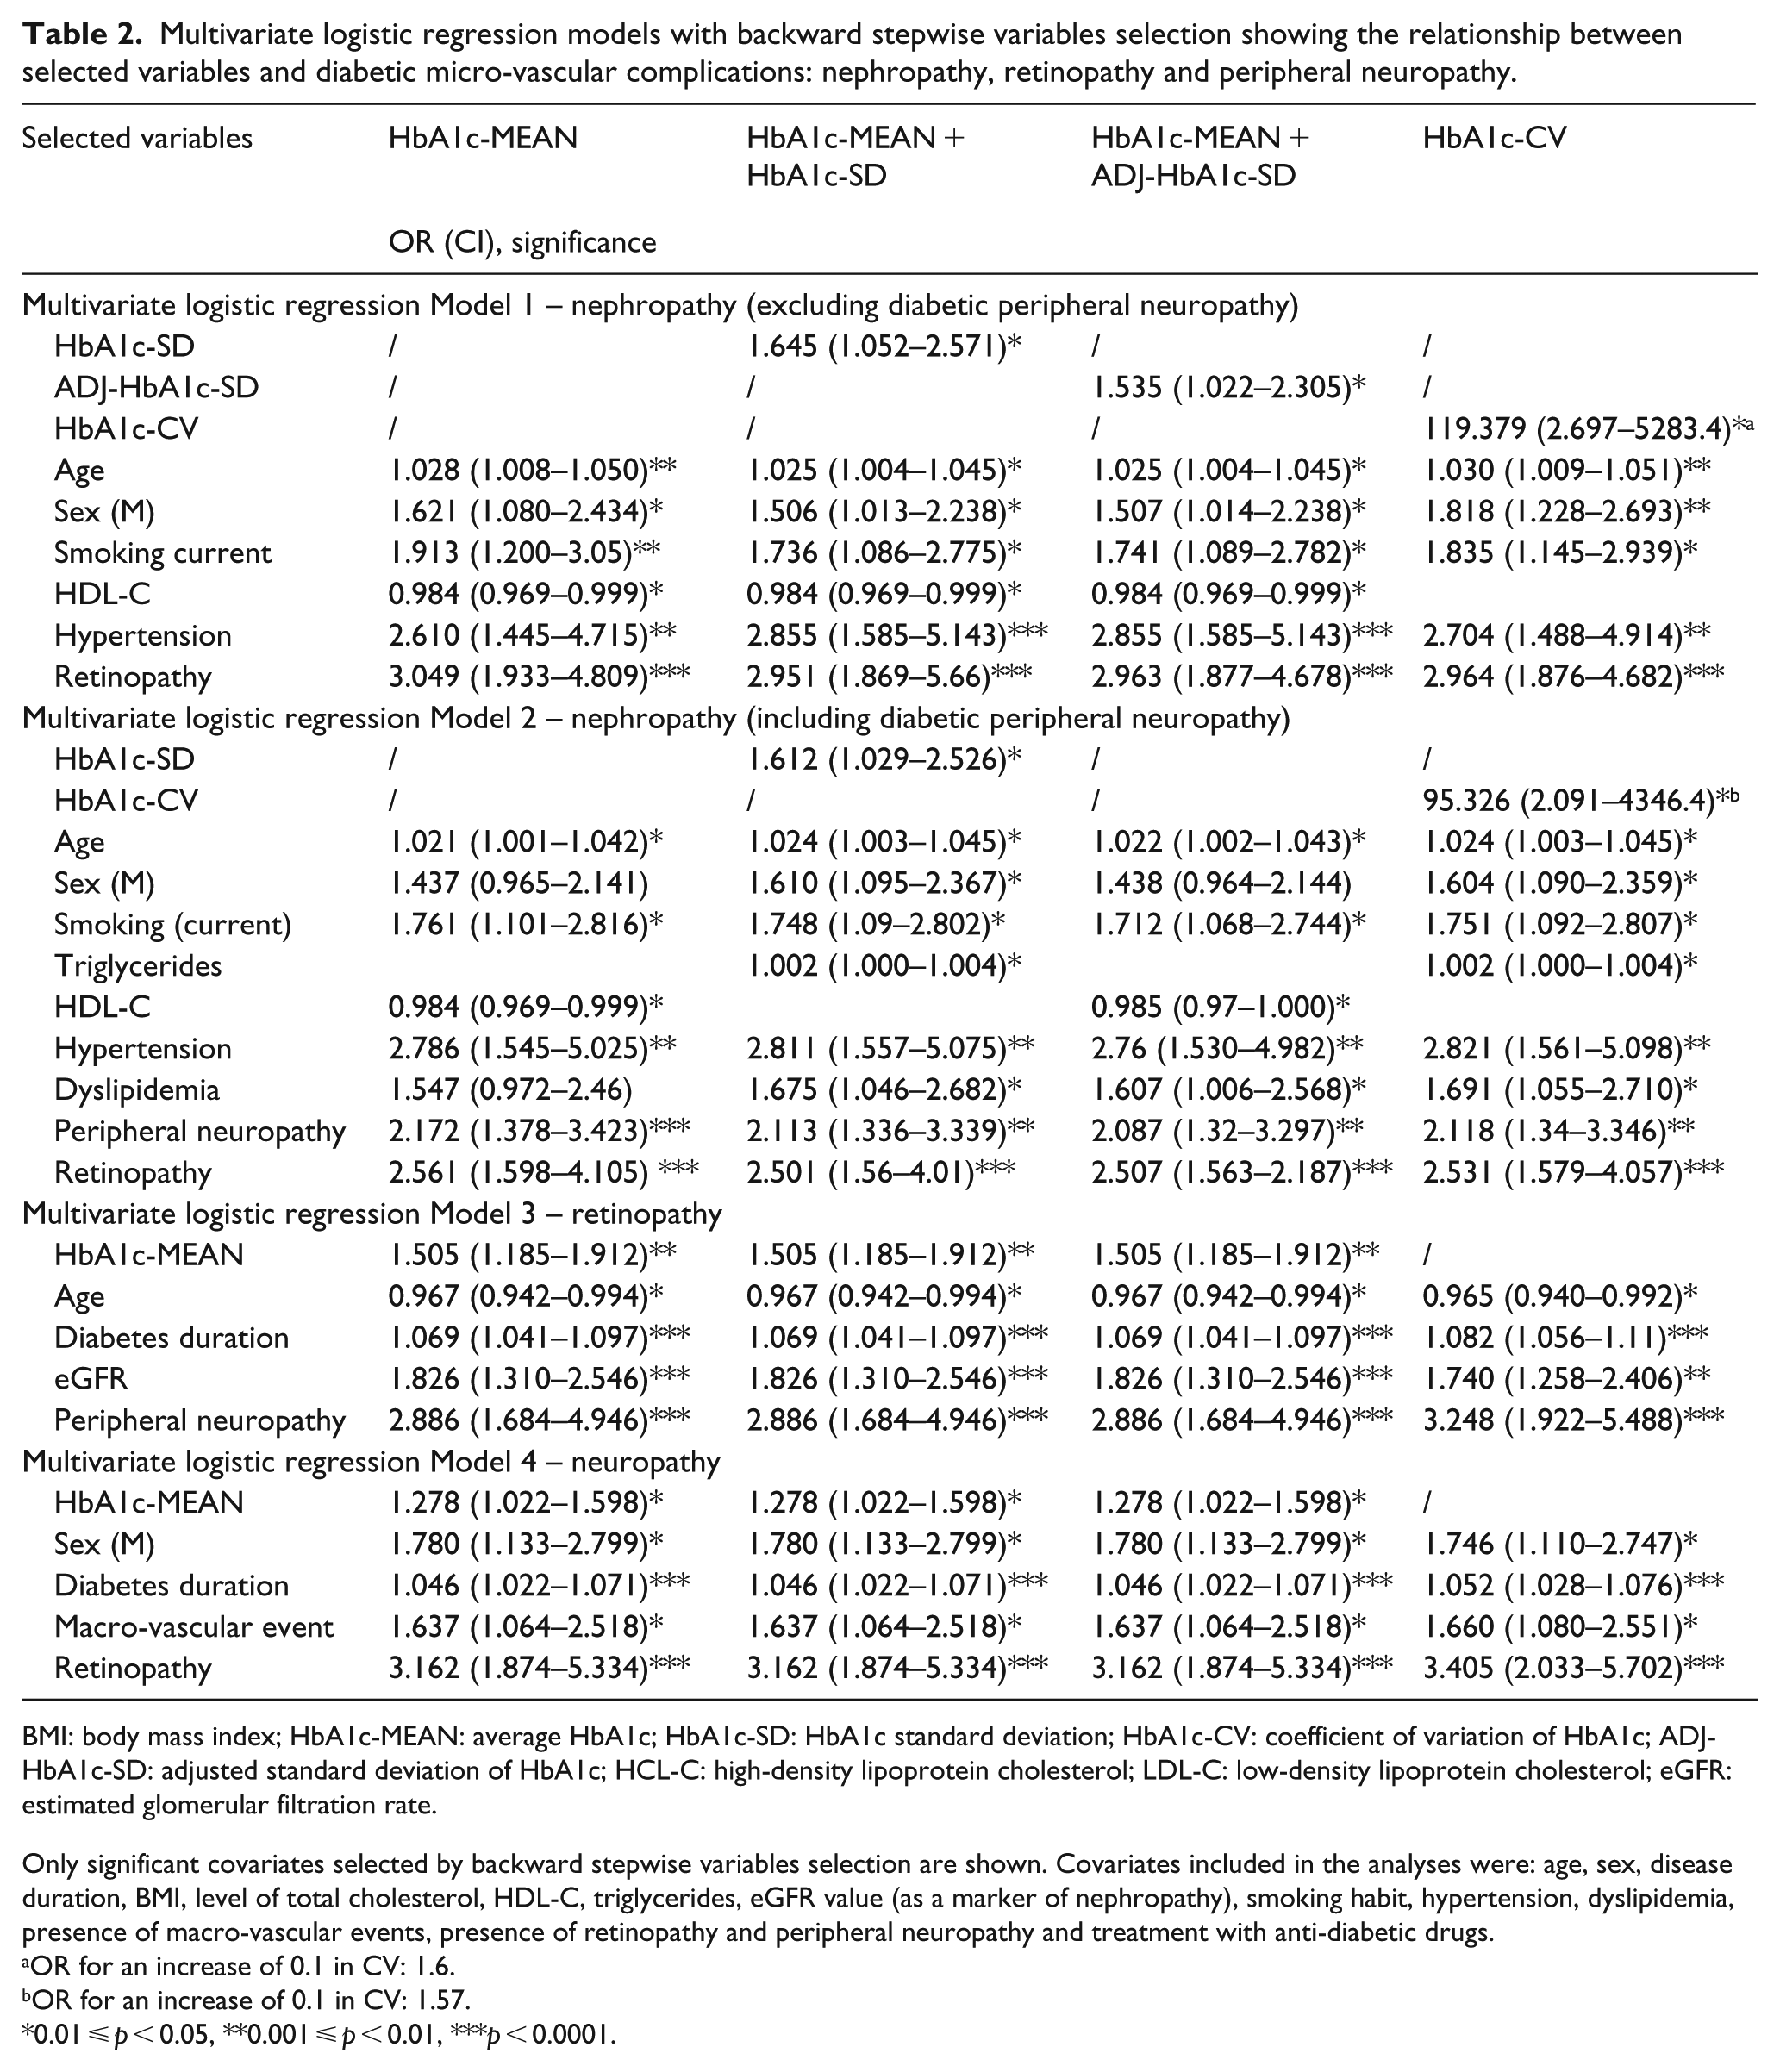
Multivariate logistic regression analyses were performed to examine risk factors for micro-vascular complications (Table 2). Excluding DPN as covariate in the model, higher HbA1c-SD, ADJ-HbA1c-SD and HbA1c-CV were statistically significant risk factors for DN (Model 1). When DPN was included in the multivariate analysis (Model 2), a significant association was found only for HbA1c-SD and HbA1c-CV. DPN was strongly associated with DN. In both models, the following variables were independently associated with the development of DN: older age, male sex, current smoker status, presence of DR and hypertension. In the model including DPN, dyslipidemia was a significant risk factor for DN.
Multivariate logistic regression models with backward stepwise variables selection showing the relationship between selected variables and diabetic micro-vascular complications: nephropathy, retinopathy and peripheral neuropathy.
BMI: body mass index; HbA1c-MEAN: average HbA1c; HbA1c-SD: HbA1c standard deviation; HbA1c-CV: coefficient of variation of HbA1c; ADJ-HbA1c-SD: adjusted standard deviation of HbA1c; HCL-C: high-density lipoprotein cholesterol; LDL-C: low-density lipoprotein cholesterol; eGFR: estimated glomerular filtration rate.
Only significant covariates selected by backward stepwise variables selection are shown. Covariates included in the analyses were: age, sex, disease duration, BMI, level of total cholesterol, HDL-C, triglycerides, eGFR value (as a marker of nephropathy), smoking habit, hypertension, dyslipidemia, presence of macro-vascular events, presence of retinopathy and peripheral neuropathy and treatment with anti-diabetic drugs.
OR for an increase of 0.1 in CV: 1.6.
OR for an increase of 0.1 in CV: 1.57.
0.01 ⩽ p < 0.05, **0.001 ⩽ p < 0.01, ***p < 0.0001.
Higher HbA1c-MEAN, younger age, longer duration of diabetes, reduced eGFR and the presence of DPN were significantly associated with the development of DR (Model 3).
Higher HbA1c-MEAN, male sex, longer duration of diabetes and the presence of macro-vascular complications and DR were independently associated with increased incidence of DPN (Model 4).
In the development of DPN and DR, no significant positive association was found with HbA1c-SD, ADJ-HbA1c-SD and HbA1c-CV by multivariate analysis. Overall, the presence of another micro-vascular complication turned out to be a stronger risk factor for the development of a specific micro-vascular complication than the mean HbA1c or HbA1c variability.
Table 2 summarizes multivariate logistic regression models for each investigated micro-vascular complication.
Discussion
Recent studies suggested that, besides high HbA1c levels, the variability of HbA1c (assessing long-term glucose fluctuations) also predicts the development of some micro-vascular complications in patients with type 2 DM.1,23–26 In a large Italian multicenter study of 8260 patients with type 2 DM, Penno et al. 15 reported that HbA1c variability is a major predictor of macro-albuminuria and reduced eGFR in patients with advanced stages of DN. They also identified a distinct, but equally significant, role of mean HbA1c and HbA1c-SD on the development of micro-albuminuria. Moving from this information, our study evaluated the role of HbA1c variability on the development of the three main micro-vascular complications of diabetes, also including peripheral neuropathy, which, to the best of our knowledge, was never previously investigated.
Confirming data of the RIACE’s study, 15 our single-centre investigation found a significant association between HbA1c variability (expressed as HbA1c-SD, ADJ-HbA1c-SD and HbA1c-CV) and the development of DN, independently of the mean levels of HbA1c. Several medium-sized observational studies reported similar results when investigating the effect of HbA1c variability on DN. In a 6.2-year-long study performed in Taiwan on 821 patients and in the 4.3-year-long Tsukuba Kawai Diabetes Registry of 812 patients, both mean HbA1c and HbA1c variability were found to be independently associated with the development of micro-albuminuria.27,28 In accordance with these findings, Rodríguez-Segade et al. 29 reported that the risk of progression of DN increased significantly with HbA1c variability, independently of the influence of updated HbA1c-MEAN. A similar association was also reported with short-term glucose variability. 13 As a novel observation, we found that the occurrence of DPN was a strong risk factor for the development of nephropathy.
Only the RIACE study and the investigation by Foo et al. 16 evaluated the role of HbA1c variability as a risk factor for the development of DR 15 in type 2 DM. In both investigations, high HbA1c-MEAN levels, but not high HbA1c variability, were associated with retinopathy. In agreement with these studies, we found that HbA1c variability was not an independent risk factor for retinopathy, while a high HbA1c-MEAN was associated with an increased risk for developing this complication. At variance with these findings, a correlation between short-term glucose variability and retinopathy was reported in type 1 11 and or type 2 12 DM. This, however, was not the case in the Verona study in which no association between fasting glucose variability and onset/progression of retinopathy was found. 30 As a novel observation, we demonstrated a strong correlation between the presence of DPN and the development of retinopathy.
This study investigated for the first time the role of mean HbA1c and long-term HbA1c variability as predictors of DPN in patients with type 2 DM. We found that only mean HbA1c was an independent risk factor for this micro-vascular complication.
Referring to other risk factors analysed in various models, this study confirmed the importance of diabetes duration (increased incidence of DR and peripheral neuropathy) and of high blood pressure and smoking status (increased incidence of DN) in the development of micro-vascular complications.31–35 Similar to the RIACE study, younger age at the onset of type 2 DM was a risk factor for developing retinopathy. This could suggest that, in young patients with type 2 DM, genetic factors may account for the susceptibility to develop retinopathy. Environmental factors, such as smoking and hypertension, were found to strongly increase the risk of DN. Finally, the presence of macro-vascular events turned out to be a risk factor for the development of DPN, but not of DN or DR.
Our study has several strengths including the availability of an adequate number of HbA1c measurements in the examined 2-year follow-up period. Indeed, a mean number of five HbA1c measurements (Figure 1) for each patient allowed an accurate evaluation of both mean HbA1c and of its variability. HbA1c variability is not a reliable indicator in clinical practice if the data collection period is too long. At the same time, a 1-year follow-up series of HbA1c measurements is probably inadequate to evaluate the pattern of glycemic control. In view of these considerations, Hsu et al. 28 and the RIACE study agreed to consider 2 years as an optimal follow-up period for assessing HbA1c variability as a risk factor. 15 A second strength derives from the use of three calculation methods to express HbA1c variability: HbA1c-SD, ADJ-HbA1c-SD and HbA1c-CV. This is at variance with some previous studies, which used only one or two indexes to investigate HbA1c variability.16,27 In our study, the use of three calculation methods allowed a comparison between our models and the majority of other studies in the literature. A third strength resides in the fact that our study investigated, in the same population of diabetic patients, all the three main micro-vascular complications of diabetes. This allowed discovering that besides glycemic control (assessed by mean HbA1c or by HbA1c variability), the presence of peripheral neuropathy is a risk factor for the development of retinopathy and nephropathy. A fourth strength regards the diagnosis of DPN. In order to avoid over-diagnosis or misdiagnosis, any suspected peripheral neurologic impairment was confirmed in our patients’ cohort by electromyography and/or by nerve conduction studies. This is at variance with most studies in the literature, which identified DPN based only on neurological examination.
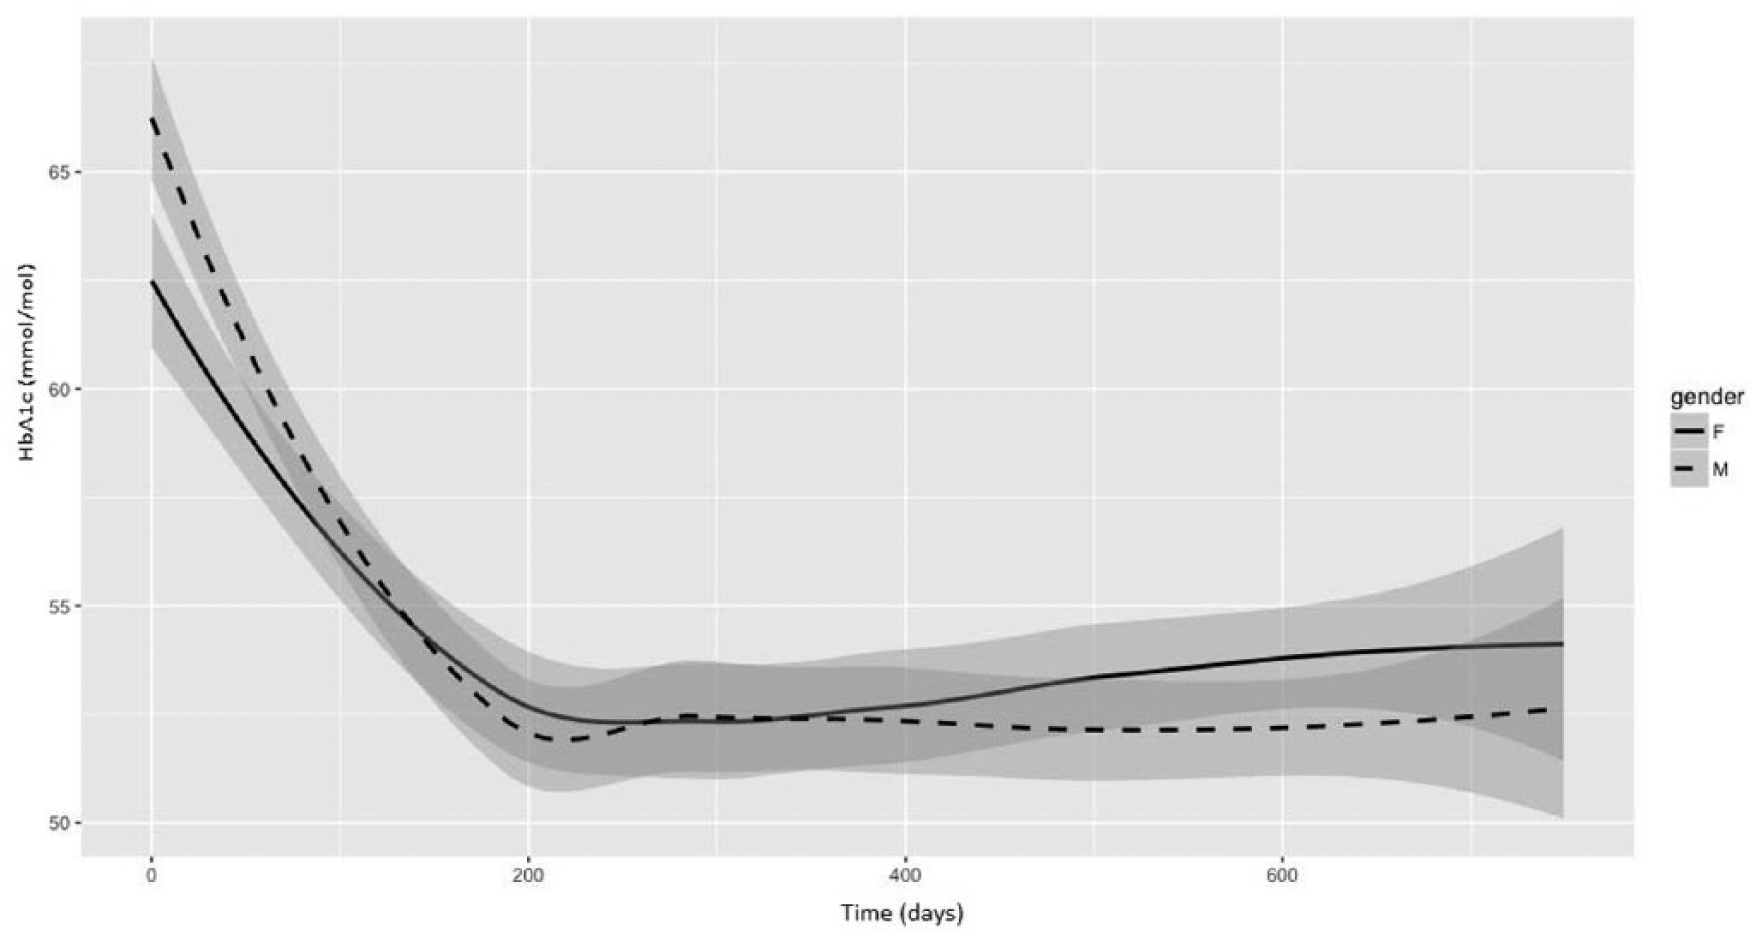
HbA1c values during the 2-year follow-up period after the index visit in male and female patients with type 2 DM. Single HbA1c values are integrated in plot lines smoothed using the locally weighted scatter plot smoothing method (LOESS). Shaded areas represent the 0.95 confidence interval in males and females.
Compared with other studies in the literature, our population had a lower prevalence of micro-vascular complications.35–37 This discrepancy may be due to differences in disease duration, 38 to different methods used to diagnose the complication and to differences in the investigated population. Indeed, some studies did not treat type 1 and type 2 DM separately, or they considered multiethnic cohorts. Different ethnic groups usually diverge for genetic susceptibility, socio-economic status, level of and access to diabetes healthcare. Different health-care systems can also justify the discrepancy between the high prevalence of micro-vascular complications in the United States, where most office visits for diabetes are made by primary care physicians and the low prevalence in countries where, similarly to Italy, diabetic patients are treated in specialized diabetes care centre. 39 In this regard, it is important to note that in our study the observed prevalence of DR (12%) is similar to that reported in Northern Italy (data from the Italian National Institute of Health) 40 and in the Republic of Ireland (14.8%). 41 Higher figures were reported in the United States (28%) 42 and in global prevalence estimates (34.6%). 35
Similar to the RIACE investigation, a limitation of this study resides in the fact that the onset time of a specific complication was not considered, but only its presence or absence at the time of the enrolment visit was recorded. Therefore, at the time of the index visit, the patient could have been affected by the complication since a few days or since several years. A further limitation is represented by the relatively short (2 year) follow-up period. This short observation time might justify the fact that no association was found in our cohort of type 2 DM patients between DPN and glycemic variability. This is in contrast with previous studies investigating the role of short-term glycemic variability both in type 143–45 and type 2 DM. 46 On the other hand, our finding on the lack of association between DPN and long-term glucose variability is in line with that of an Australian study in adolescents with type 1 DM who were followed for a median period of 8.1 years. 19 Although we had available information about patients’ drugs purchase and their current therapies, the retrospective design of the study did not allow a correct evaluation of the role of anti-diabetic drugs, lipid-lowering treatment and anti-hypertensive drugs in the development of micro-vascular complications. Another potential weakness of our study is its single-centre design. However, our findings about the role of HbA1c variability and the development of DN and DR are in line with the correspondent ones in the multi-centre RIACE study.
In summary, we confirmed that HbA1c variability is a risk factor for the development of DN, independently of the HbA1c-MEAN level; while the latter parameter of glycemic control is important for the development of DR. As a novel finding, we demonstrated that the HbA1c-MEAN, but not its variability, is an independent risk factor for the development of DPN. We also found that the occurrence of DPN is a strong risk factor for the development of DN and DR. Finally, the presence of macro-vascular events emerged as a risk factor for the development of DPN, but not of DN or DR. Overall, our findings provide a comprehensive view of the multiple factors involved in the development of three main micro-vascular complications of type 2 DM, which might be useful in the clinical practice to stratify patients according to the individual burden of risk factors.
Footnotes
Acknowledgements
The authors would like to thank the Pavia Local Health Care Agency (LHCA) for providing information on patients’ drugs purchase and on the date of disease diagnosis. M.T. and G.C. contributed equally to the study.
Declaration of conflicting interests
R.B. is a shareholder and member of the board of Biomeris s.r.l., a spin-off company of the University of Pavia working in IT solutions for healthcare.
Funding
This work was partially funded by MOSAIC, an EU-supported project carried out within the 7th Framework Programme under grant agreement no. FP7-600914. The funder had no role in the design and the conduct of the study.