
Abstract
Type 2 diabetes mellitus and pre-diabetes are risk factors for atherosclerosis and are highly prevalent in patients with coronary artery disease. However, the prevalence of impaired glucose metabolism in patients with peripheral artery disease is not as well elucidated. We aimed at comparing prevalence rates of type 2 diabetes mellitus and pre-diabetes, which were diagnosed according to the current American Diabetes Association criteria, among 364 patients with peripheral artery disease, 529 patients with coronary artery disease and 383 controls. The prevalence of type 2 diabetes mellitus in peripheral artery disease patients was 49.7%. It was significantly higher in these patients than in coronary artery disease patients (34.4%; p < 0.001) and controls (21.4%; p < 0.001). Adjusted for sex, age and body mass index, odds ratios for type 2 diabetes mellitus were 2.0 (95% confidence interval 1.5–2.6) comparing the peripheral artery disease group with the coronary artery disease group (p < 0.001) and 4.0 (2.8–5.8) comparing the peripheral artery disease group with controls (p < 0.001). The prevalence of pre-diabetes among non-diabetic subjects was high in all three study groups (64.5% in peripheral artery disease patients, 63.4% in coronary artery disease patients and 61.8% in controls), without significant between-group differences. In conclusion, the prevalence of type 2 diabetes mellitus is even higher in peripheral artery disease patients than in coronary artery disease patients. This observation underlines the need to consider impaired glucose regulation in the management of peripheral artery disease.
Keywords
Introduction
Type 2 diabetes mellitus (T2DM) and pre-diabetes are highly prevalent in patients with coronary artery disease (CAD). 1 However, the prevalence of impaired glucose metabolism in patients with peripheral artery disease (PAD) is not as well elucidated. In particular, no data on the prevalence of T2DM and pre-diabetes defined according to current American Diabetes Association 2 criteria are available. The present investigation aimed at comparing prevalence rates of T2DM and pre-diabetes among patients with PAD, patients with CAD and controls using, besides fasting and post-challenge glucose, also glycated haemoglobin (HbA1c) for the diagnosis of impaired glucose metabolism.
Research design and methods
Patients
Two cohort studies were used for the present analyses: The first included patients from the Academic Teaching Hospital Feldkirch, Feldkirch, Austria, who were referred to hospital for the evaluation of established or suspected stable CAD by coronary angiography. The second study included patients from the Academic Teaching Hospital Feldkirch and from the Department of Angiology at the Swiss Cardiovascular Center, Inselspital, Bern, Switzerland, who were referred to hospital for the evaluation of suspected or established PAD. The study performed in Feldkirch on patients, who were referred to hospital for the evaluation of established or suspected stable CAD, and the study performed in Feldkirch and Bern on patients, who were referred to hospital for the evaluation of suspected or established PAD, were approved by the local ethics committees, and all patients gave written informed consent.
Significant CAD was diagnosed in case of coronary artery stenoses with luminal narrowing ⩾ 50% at coronary angiography. PAD was diagnosed if there were symptoms consistent with PAD in combination with Duplex-sonographically proven atherosclerosis of lower extremity peripheral arteries.
T2DM was diagnosed according to the 2013 criteria of the American Diabetes Association. 2 According to this definition, people with HbA1c ⩾ 6.5% and/or fasting plasma glucose ⩾ 126 mg/dL and/or post-challenge plasma glucose ⩾200 mg/dL were considered diabetic. Furthermore, participants were categorized as having T2DM in case of a known history of the disease. Pre-diabetes was diagnosed in patients without T2DM if fasting glucose was ⩾100 and <126 mg/dL and/or post-challenge glucose was ⩾140 and <200 mg/dL, and/or HbA1c was ⩾5.7 and <6.5 %. Standard oral glucose tolerance tests (OGTTs) (75 mg) were performed in all participants without a previous diagnosis of T2DM and fasting glucose <126 mg/dL.
Laboratory analyses
Blood samples were taken after an overnight fast of 12 h at inclusion into the study. Glucose was measured enzymatically from venous fluoride plasma by the hexokinase method (Roche, Basel, Switzerland) on a Hitachi 717 or 911 analyser. HbA1c was measured with high-performance liquid chromatography on a Menarini-Arkray KDKHA8140 analyser (Arkray, Kyoto, Japan).
Statistical methods
Patient characteristics are given as numbers (percentages) in case of categorical variables and as means ± standard deviations in case of continuous data. Three groups of patients were used for the analyses: (1) patients referred for diagnostic evaluation of PAD in whom PAD was confirmed, (2) patients referred for coronary angiography in whom significant CAD was confirmed and (3) control subjects referred for coronary angiography in whom significant CAD was ruled out angiographically and who did not have any signs or symptoms of PAD. Differences between groups were tested for statistical significance with χ2-tests and t-tests for categorical and continuous parameters, respectively. To compare prevalence rates of T2DM between the study groups, we also performed logistic regression analyses with adjustment for gender, age and body mass index. The Shapiro–Wilk test was used to test whether continuous variables were normally distributed. Variables that were not normally distributed were transformed logarithmically (base e). All tests were two-sided and p-values < 0.05 were considered statistically significant. The SPSS Version 20 (SPSS inc., Chicago, USA) statistical package was used.
Results
The 1276 study participants (865 males and 411 females) had a mean ± standard deviation age of 66.0 ± 10.4 years and a body mass index of 27.6 ± 4.4 kg/m2. Patient characteristics for the PAD group (n = 364), for the CAD group (n = 529) and for controls (n = 383) are shown in Table 1. The proportion of males was higher in the PAD and CAD groups than in the control group (Table 1). The PAD group was significantly older than the CAD and control groups, and the CAD group was older than the control group (Table 1). The proportion of past or current smokers was highest in the PAD group and higher in the CAD group than in the control group (Table 1). In contrast, body mass index and waist circumference were lower in the PAD and CAD groups than in the control group (Table 1).
Characteristics of the participants according to atherosclerotic vascular disease group.
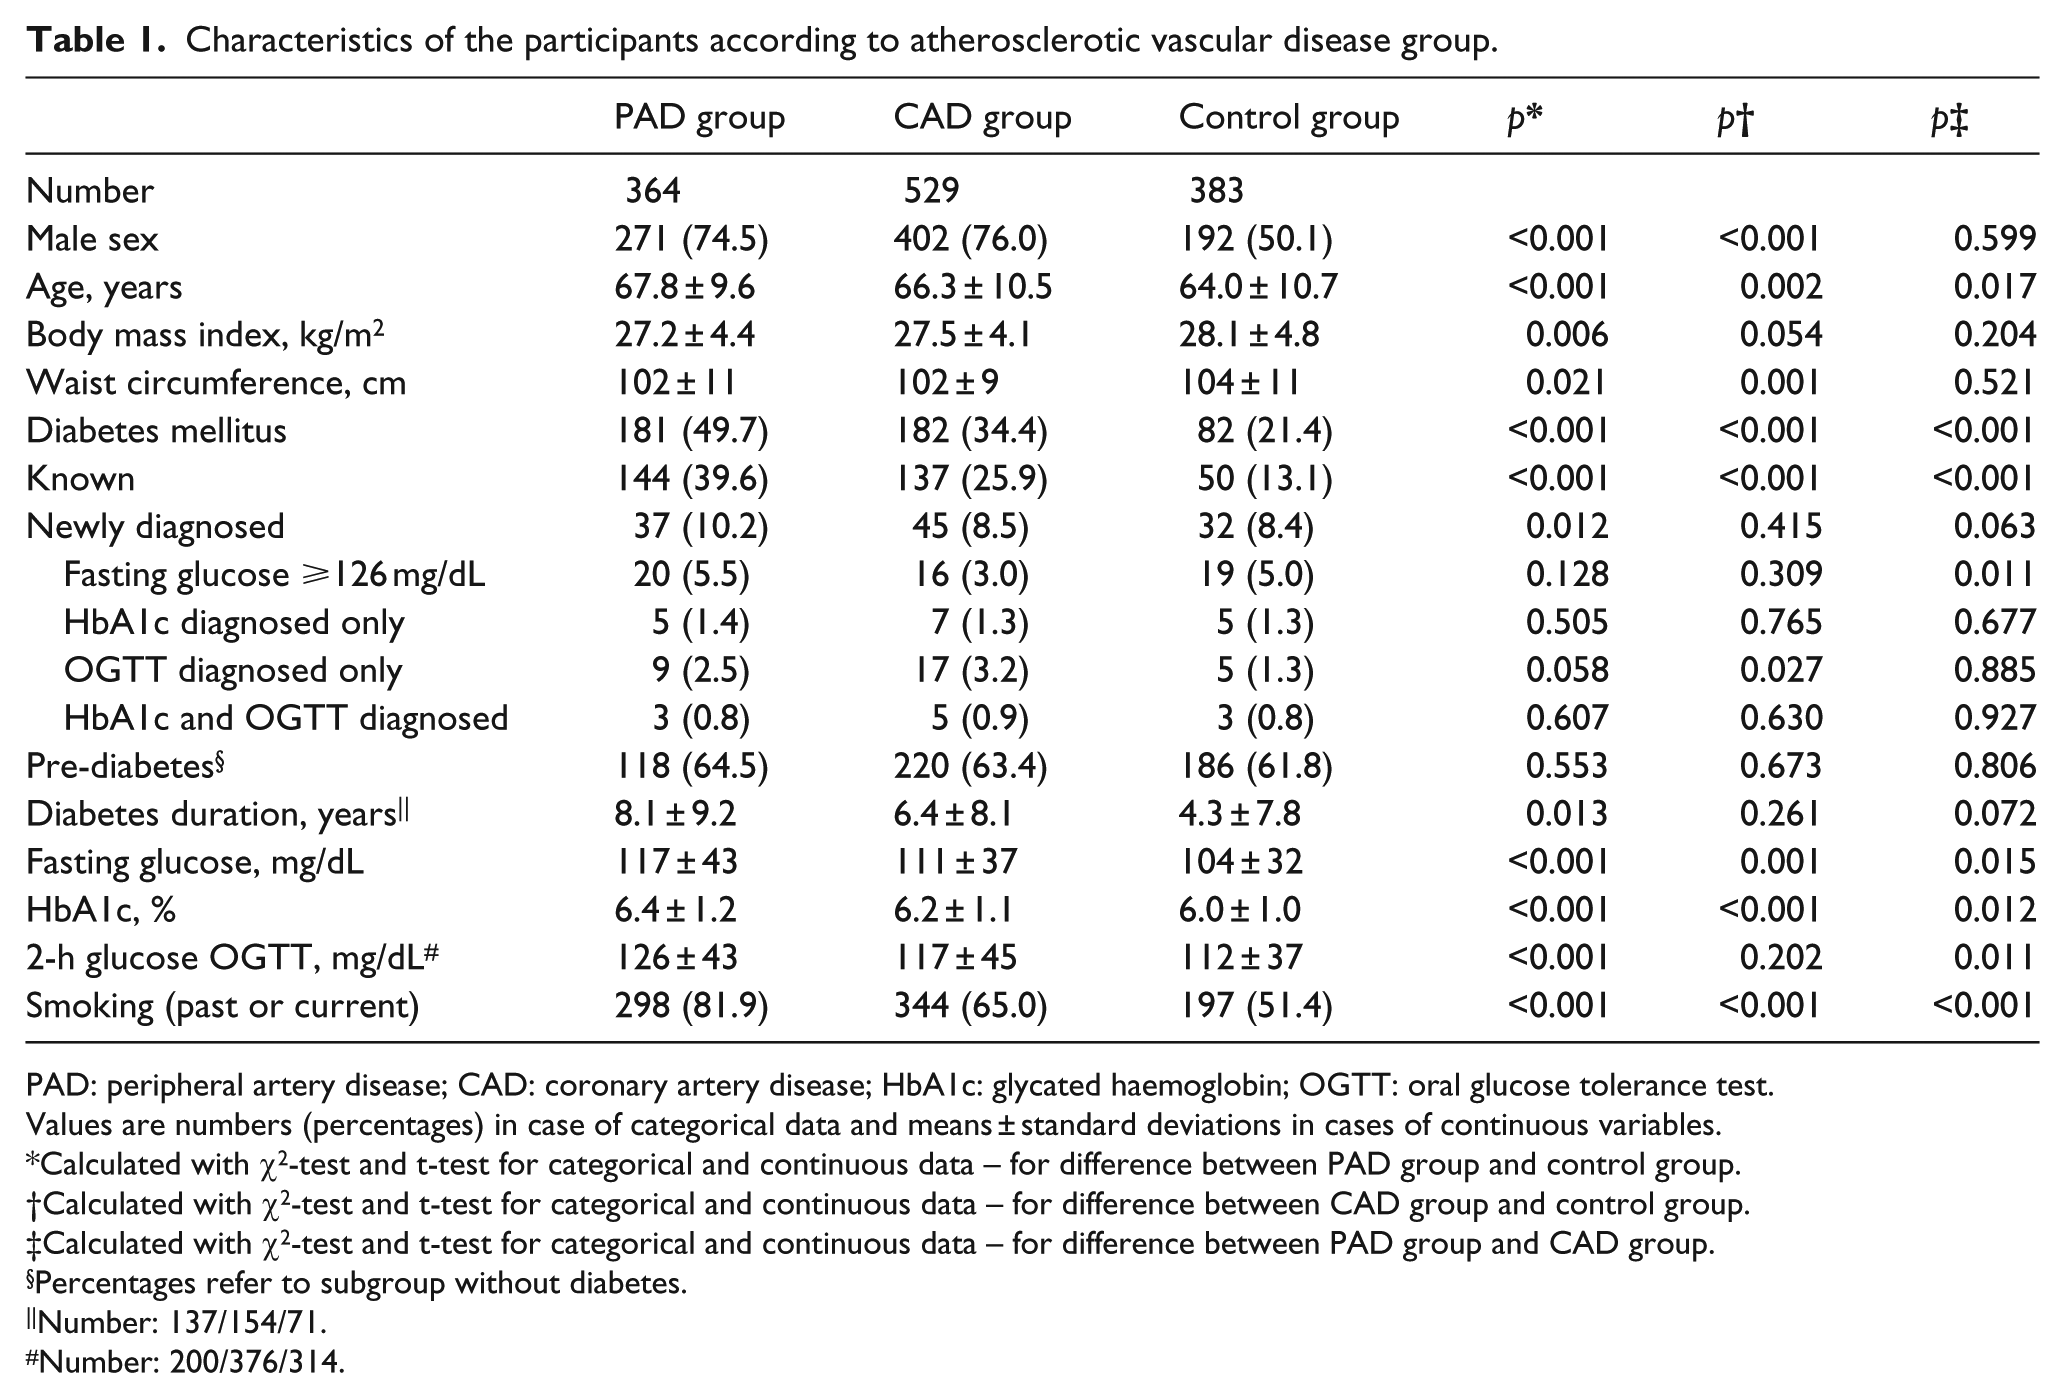
PAD: peripheral artery disease; CAD: coronary artery disease; HbA1c: glycated haemoglobin; OGTT: oral glucose tolerance test.
Values are numbers (percentages) in case of categorical data and means ± standard deviations in cases of continuous variables.
Calculated with χ2-test and t-test for categorical and continuous data – for difference between PAD group and control group.
Calculated with χ2-test and t-test for categorical and continuous data – for difference between CAD group and control group.
Calculated with χ2-test and t-test for categorical and continuous data – for difference between PAD group and CAD group.
Percentages refer to subgroup without diabetes.
Number: 137/154/71.
Number: 200/376/314.
A total of 445 patients were diagnosed with T2DM (331 with a known history of diabetes and 114 newly diagnosed). T2DM prevalence was significantly higher in PAD patients than in controls. This difference was primarily due to a higher prevalence of known T2DM in PAD patients. However, the prevalence of newly diagnosed T2DM was also significantly higher in the PAD group (Table 1). Moreover, diabetes duration was significantly longer in PAD patients than in controls (Table 1). Not surprisingly, T2DM prevalence was also significantly higher in CAD patients than in controls (Table 1). Of relevance, however, T2DM prevalence was significantly higher in PAD patients than in CAD patients. This difference was due to a higher prevalence of known T2DM in PAD patients (Table 1). The results obtained from crude models were confirmed by logistic regression analyses adjusted for gender, age and body mass index. Compared to control subjects, odds ratios (95% confidence intervals) for prevalent T2DM were 4.0 (2.8–5.8), p < 0.001 for PAD patients and 2.1 (1.5–2.9), p < 0.001 for CAD patients. For PAD versus CAD patients, the adjusted odds ratio (95% confidence intervals) was 2.0 (1.5–2.6); p < 0.001. The prevalence of pre-diabetes was very high in all three study groups, without significant between-group differences (Table 1).
Conclusion
In this large cohort of patients with Duplex-sonographically verified PAD, we found a very high prevalence of T2DM and pre-diabetes. Indeed, almost one in two PAD patients had T2DM, and among non-diabetic patients, more than 60% had pre-diabetes. Thus, only a minority of PAD patients had normal glucose metabolism.
A high prevalence of T2DM and pre-diabetes in patients with CAD is well established.3,4 However, data on the prevalence of impaired glucose metabolism in PAD patients are scarce. 5 We found that T2DM prevalence in PAD patients was significantly higher than in controls and even higher than in patients with angiographically verified CAD. Although the majority of the T2DM cases in our PAD patients was already known at study entry, a considerable proportion of the PAD patients were newly diagnosed with T2DM. This is in line with the high prevalence of undiagnosed T2DM among CAD patients.1,4 This study therefore strongly supports that screening for T2DM is important in elderly patients, particularly in those with vascular disease. 6 It is also relevant to detect people with pre-diabetes, because they may profit from lifestyle intervention programmes to reduce diabetes incidence and duration.7,8
This is the first study investigating T2DM prevalence in PAD patients based on the current American Diabetes Association criteria for the diagnosis of diabetes. Of note, a considerable percentage of our patients were newly diagnosed with T2DM only on the basis of the HbA1c and/or post-challenge glucose criteria and not on the basis of fasting glucose. This is of relevance since both isolated elevation of HbA1c and isolated elevation of post-challenge glucose are associated with increased cardiovascular mortality.9,10 In addition, we confirm in a PAD cohort that elevated HbA1c and post-challenge glucose values do not identify the same patients as having diabetes. 11 Finally, diabetes duration, a major predictor of diabetes complications,12,13 was significantly longer in the PAD patients than in controls and also trended to be longer than in CAD patients.
The study has strengths and limitations: Like in most epidemiologic investigations, the parameters of glucose metabolism were measured once only and not repeatedly. Moreover, our patients were derived from clinical patient cohorts and not from the general population. This may somewhat limit the generalizability of our data. In addition, systematic evaluation for CAD was not performed in the PAD group and systematic evaluation for PAD was not performed in the CAD group, which may cause some impreciseness in the results. It is a strength of our study that we did not only use the ankle-brachial-index as a screening parameter for PAD but also performed Duplex-sonography. The number of participants in our study was also relatively large, and glucose tolerance tests were performed in all patients without a previous diagnosis of T2DM.
In conclusion, we found that the prevalence of T2DM and pre-diabetes is extremely high in patients with PAD. Previously, much attention has been directed towards the important co-morbidity of T2DM and CAD. We here show that T2DM prevalence is even higher in PAD than in CAD patients which confirms the need for interdisciplinary treatment of complex PAD patients. 14
Footnotes
Acknowledgements
The authors extend appreciation to the study participants; without their collaboration this article would not have been written. Furthermore, we thank Helene Fankhauser and Fabienne Flach for excellent technical assistance.
Author’s contributions
I.B. and H.D. designed the study. G.S. and P.R. performed the statistical analysis. G.S. and C.H.S. wrote the manuscript. C.H.S., D.-D.D., I.B., H.D., N.K., P.R., R.P.E., and T.W. contributed to the discussion and reviewed and edited the manuscript. All authors had full access to the data, have read, approved, and take full responsibility for the manuscript as submitted.
Declaration of conflicting interests
The authors have no conflict of interest to declare.
Funding
The study was financially supported by the Jubiläumsfonds of the Austrian National Bank (Vienna, Austria), the Dr Karl Josef Hier and the Peter Goop Stiftung (Vaduz, Liechtenstein), the Fachhochschule Dornbirn (Dornbirn, Austria), and the Institute for Clinical Chemistry at the Academic Teaching Hospital Feldkirch (Feldkirch, Austria).