
Abstract
Introduction:
We compared test performance and cost per case for strategies detecting diabetes on the oral glucose tolerance test (OGTT) using either (a) glycated haemoglobin (HbA1c) ≥ 6.5% (48 mmol/mol) or (b) two HbA1c thresholds where the first cut-point ‘rules out’ and the second ‘rules in’ diabetes. HbA1c values in between the thresholds require confirmatory glucose testing for diagnosis.
Materials and methods:
We conducted an analysis of adults aged 40–75 years from the Leicester Ethnic Atherosclerosis and Diabetes Risk (LEADER) cohort (Leicester, UK), from 2002 to 2008, who underwent oral glucose tolerance testing (OGTT) and HbA1c testing.
Results:
From 8696 individuals (mean age 57.3 years, 73% white Europeans (WE) and 27% South Asians (SA)), HbA1c ≥ 6.5% produced sensitivity of 62.1% for detecting diabetes in WE and 78.9% in SA. Using two selected thresholds, HbA1c ≤ 5.8% (rule-in, 40 mmol/mol) and HbA1c ≥ 6.8% (rule-out, 51 mmol/mol) produced high sensitivity/specificity (> 91.0%) for detecting diabetes, however, 28.8% of the cohort with HbA1c 5.9%–6.7% required a subsequent glucose test. The two cut-point threshold produced a lower cost per case of diabetes detected in WE, compared to HbA1c≥ 6.5% of £38.53 (1.89 to 86.81) per case, but was more expensive in SA by £84.50 (69.72 to 100.92) per case. Using a risk score to determine HbA1c testing, the same costs per case became £63.33 (23.33 to 113.26) in WE and £69.21 (55.60 to 82.41) in SA.
Conclusion:
Using a two-threshold strategy may have some benefits over a single cut-point; however, 28.8% of individuals required two blood tests.
Introduction
There are recommendations to use HbA1c ≥ 6.5% (48 mmol/mol) as a diagnostic tool to detect type 2 diabetes based on the International Expert Committee (IEC) in 2009, the American Diabetes Association (ADA) in 2010 and the World Health Organization (WHO) in 2011.1–3 This cut-point represents the approximate level above which prevalent retinopathy begins to increase, in a similar fashion to fasting plasma glucose (FPG) ≥ 7.0mmol/l and two-hour plasma glucose ≥ 11.1mmol/l.1–3 However, there are concerns about using HbA1c for diagnosis or at the selected threshold.4,5 An HbA1c of ≥ 6.5% identifies a different population from those detected with diabetes by using a traditional oral glucose tolerance test (OGTT) or fasting plasma glucose (FPG).6–10 The specificity of using HbA1c ≥ 6.5% to detect diabetes on an OGTT is generally high (>88%), however, the sensitivity varies between 17.0% to 72.8%, which may reflect different methods for diagnosis and ethnicity of populations studied as well as HbA1c assays. 11 Furthermore, the HbA1c cut-points above which prevalent retinopathy increases can vary from HbA1c ≥ 5.5% (37 mmol/mol) to ≥ 6.5%-6.9% (48 mmol/mol to 52 mmol/mol).1,12–14 Therefore, various studies have investigated or proposed using different HbA1c diagnostic thresholds for diabetes, including ≥ 6.0% (42 mmol/mol) or ≥ 7.0% (53 mmol/mol).15–17
An alternative strategy has been suggested which uses two HbA1c cut-points to either exclude (‘rule out’) or diagnose (‘rule in’) the disease. 18 The first threshold of HbA1c ≤ 5.5% would ‘rule out’ diabetes, while the second cut-point of ≥ 7.0% would ‘rule in’ diabetes, based on the 2.5th and 97.5th percentiles for diabetes and non-diabetes populations, respectively. 18 It is suggested the remaining individuals (5.6% to 6.9%, 38 mmol/mol to 52 mmol/mol) have ‘intermediate HbA1c’ and will consist of a mixture of people with either normal or abnormal glucose tolerance. Alternate definitions of intermediate HbA1c have been suggested by the American Association of Clinical Endocrinologists/American College of Endocrinology (AACE/ACE) of 5.5% to 6.4% (37 mmol/mol to 46 mmol/mol) and the Association of British Clinical Diabetologists (ABCD) of 5.8% to 7.2% (40 mmol/mol to 55 mmol/mol).19,20 These organisations recommend further glucose testing to establish a diagnosis of diabetes for anyone with intermediate HbA1c.
The aim of this study was to establish how a two-threshold strategy for detection or exclusion of diabetes compared with using a single HbA1c cut-point in a multi-ethnic cohort formed from combining two diabetes screening programmes (a population-based and an at-risk cohort). Furthermore, we investigated cost per single case of diabetes detected according to each strategy.
Methods
The study was conducted using an analysis of the Leicester Ethnic Atherosclerosis and Diabetes Risk (LEADER) cohort, UK. This consisted of a combination of two systematic screening programmes which had similar standardised operating procedures. The first and larger programme invited people irrespective of diabetes risk, whilst the second and smaller program only screened people at risk of diabetes.21,22 Methods and data collection has been described previously.8,21–23 In summary, primary care individuals without prior diabetes were invited to a screening appointment. All participants underwent an OGTT (75 g oral load) and had an HbA1c measurement in either a specialist hospital, general practice or on a mobile screening unit. All asymptomatic individuals with a positive OGTT underwent a confirmatory OGTT within one week; only two OGTTs were performed in total. The results of the OGTTs were classified according to WHO 1999 criteria. 24 Participants provided written informed consent, and ethical approval was granted by a local ethics committee. The relatively high number of South Asians screened (people of Indian, Pakistani or Bangladeshi origin: 22.7% of cohort) is representative of the Leicester City region. 25 Leicestershire lies in the East Midlands region, which has a similar probability of survival to age 75 years compared to the rest of England and therefore may be considered as healthy as the rest of the nation. 26
Laboratory assays
Glucose samples were collected in fluoride oxalate tubes and measured within a maximum of two hours using an Abbott Aeroset clinical chemistry analyser (Abbott laboratories, Maidenhead, UK). This instrument has an imprecision coefficient of variation of 1.61% at 6.8 mmol/l. HbA1c samples were measured on the same day using the Biorad Variant HPLC II system (Bio-Rad Laboratories, Hemel Hempstead, UK), which is suitable for diagnosis of diabetes. 1 This Diabetes Control and Complications Trial (DCCT)-aligned assay has an imprecision coefficient of variation of 1.88% and 1.06% at mean HbA1cs of 5.3% and 9.4%, respectively (34 mmol/mol and 79 mmol/mol), and is valid for carriers of variant Hb S and C.
Statistical methods and data analysis
We tested various strategies for detection of diabetes compared to the standard diagnosis of WHO 1999 24 criteria diagnosis of diabetes using an OGTT (Figure 1, add WHO reference).
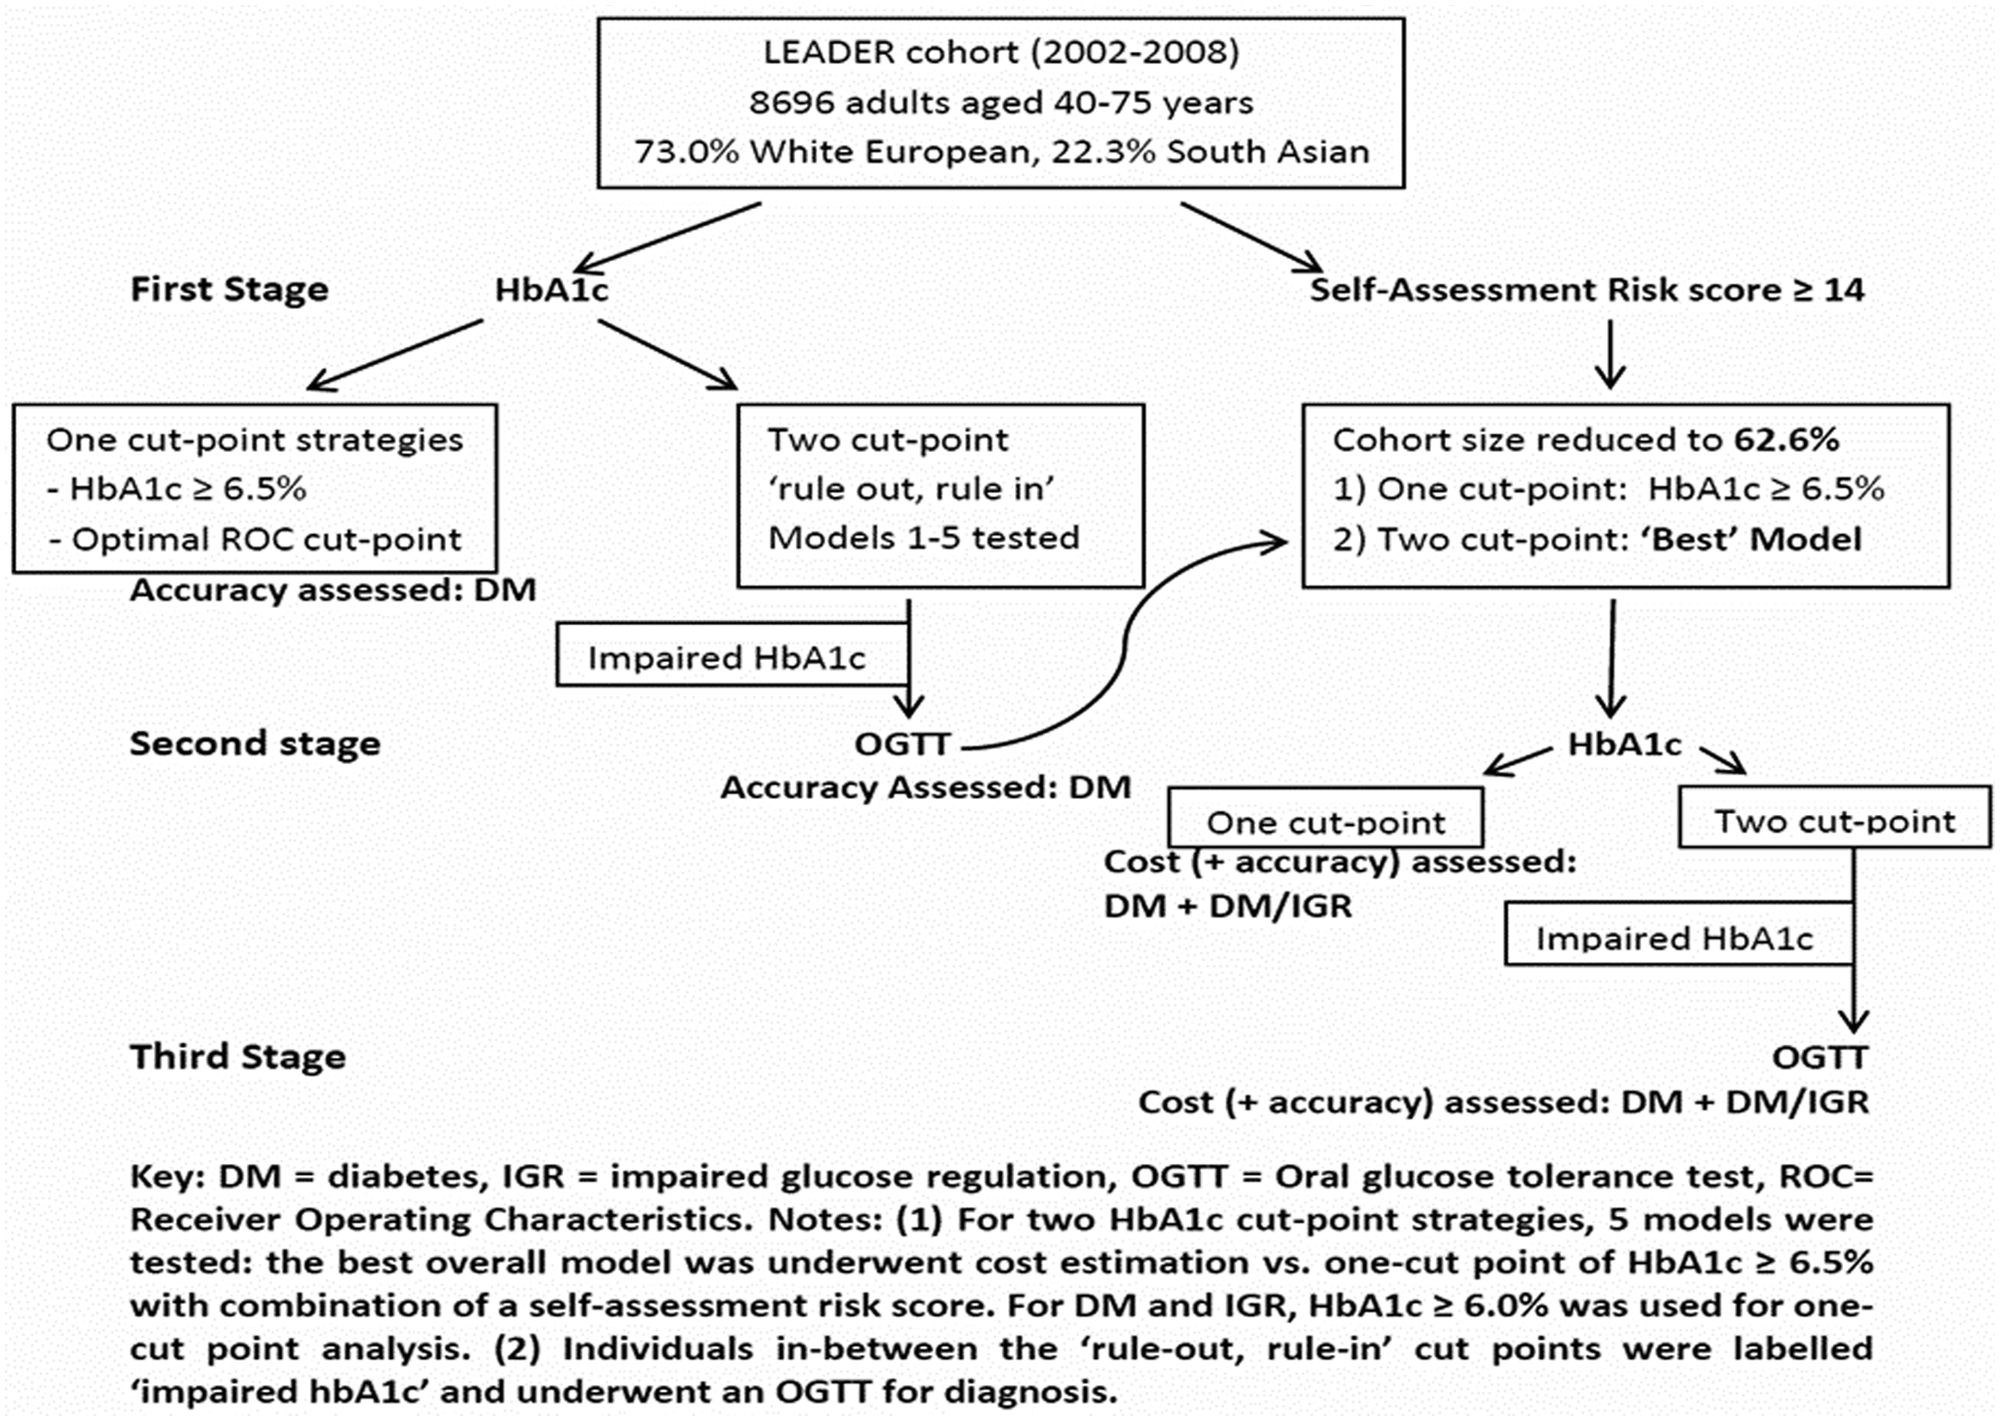
Flow diagram describing various strategies tested in this study.
XLSTAT version 2011.5 (Addinsoft, Paris, France) was used to compare diagnostic indices with 95% confidence intervals (CI) at various HbA1c cut-points. The indices were sensitivity, specificity, positive predictive value (PPV) and negative predictive value (NPV). For the one-cut-point strategy, we analysed performance of HbA1c ≥ 6.5% based on recent recommendations.1–3 Furthermore, receiver operating characteristic (ROC) curves were plotted and used to determine the optimal HbA1c cut-point defined as the best balance between sensitivity and specificity. An area under the ROC curve (AUROC) was also calculated.
Regarding the two-threshold strategy, we investigated five different models where individuals underwent an HbA1c measurement at stage 1 using different ‘rule-in’ and ‘rule-out’ cut-points. Any individual placed in between the two cut-points (intermediate HbA1c) was considered to require a subsequent glucose test for diagnosis at Stage 2, which was an OGTT in this study. Models 1, 2 and 3 used ‘rule-out’ cut-points of HbA1c ≤ 5.5%, ≤ 5.4% and ≤5.7%, respectively, reflecting recommendations from an Australian study, AACE/ACE and the ABCD, respectively.18–20 Models 1 and 2 used HbA1c ≥ 7.0% as the ‘rule in’ cut-point, whereas Model 3 used HbA1c ≥ 7.3% based on the same recommendations.18–20 Model 4 selected HbA1c cut-points based on the 2.5th and 97.5th percentiles HbA1c percentiles for people with and without diabetes, respectively, derived from the LEADER cohort. Model 5 determined the broadest range of a two-HbA1c cut-point strategy, allowing high diagnostic accuracy but simultaneously keeping the number of people requiring a second test as low as possible.
Cost analysis
Cost per case was defined as the total cost of screening the cohort using a particular strategy divided by the number of diabetes cases detected from that strategy. The cost per case of diabetes was estimated for a single cut-point strategy of HbA1c ≥ 6.5% compared to a two-cut-point strategy from the best model described above (balancing diagnostic ability and numbers requiring a second test). Furthermore, costs were re-evaluated with prior application of a validated non-invasive self-assessment risk score at stage 1, with a score ≥ 14 proceeding to an HbA1c measurement at Stage 2, before an OGTT for those with ‘intermediate HbA1c’ at Stage 3. 27 All strategies assume 60% uptake at Stage 1 based on previous literature. 28 Costs of strategies were derived from different sources. Screening laboratory blood tests were based on local prices and are reasonably representative of the UK (£0.47 per glucose sample and £2.66 per HbA1c sample). 29 Health care professionals’ time for performing screening tests were approximated at £18 per hour and assumed to take 10 minutes per single blood test and 30 minutes per oral glucose tolerance test. 30 Administrative costs were estimated at £5.32 for blood tests and £2.71 for a risk score. 31
Results
We analysed results from 8696 people aged 40–75 years old. The mean cohort age was 57.3 years (SD 9.7) and mean HbA1c was 5.7% (SD 0.61). White Europeans and South Asians formed 73.0% and 22.3% of the cohort, respectively.
Use of a single HbA1c cut-point to diagnose diabetes
Using either HbA1c ≥ 6.0%, 6.5% or 7.0% produced significantly lower sensitivity in white Europeans compared to South Asians; for HbA1c ≥ 6.5% these were 62.1% and 78.9%, respectively (all diagnostic indices and 95% CI are shown in Table 1).
Comparison of diagnostic indices of HbA1c for screen–detected undiagnosed type 2 diabetes mellitus according to 1999 WHO diagnostic criteria.
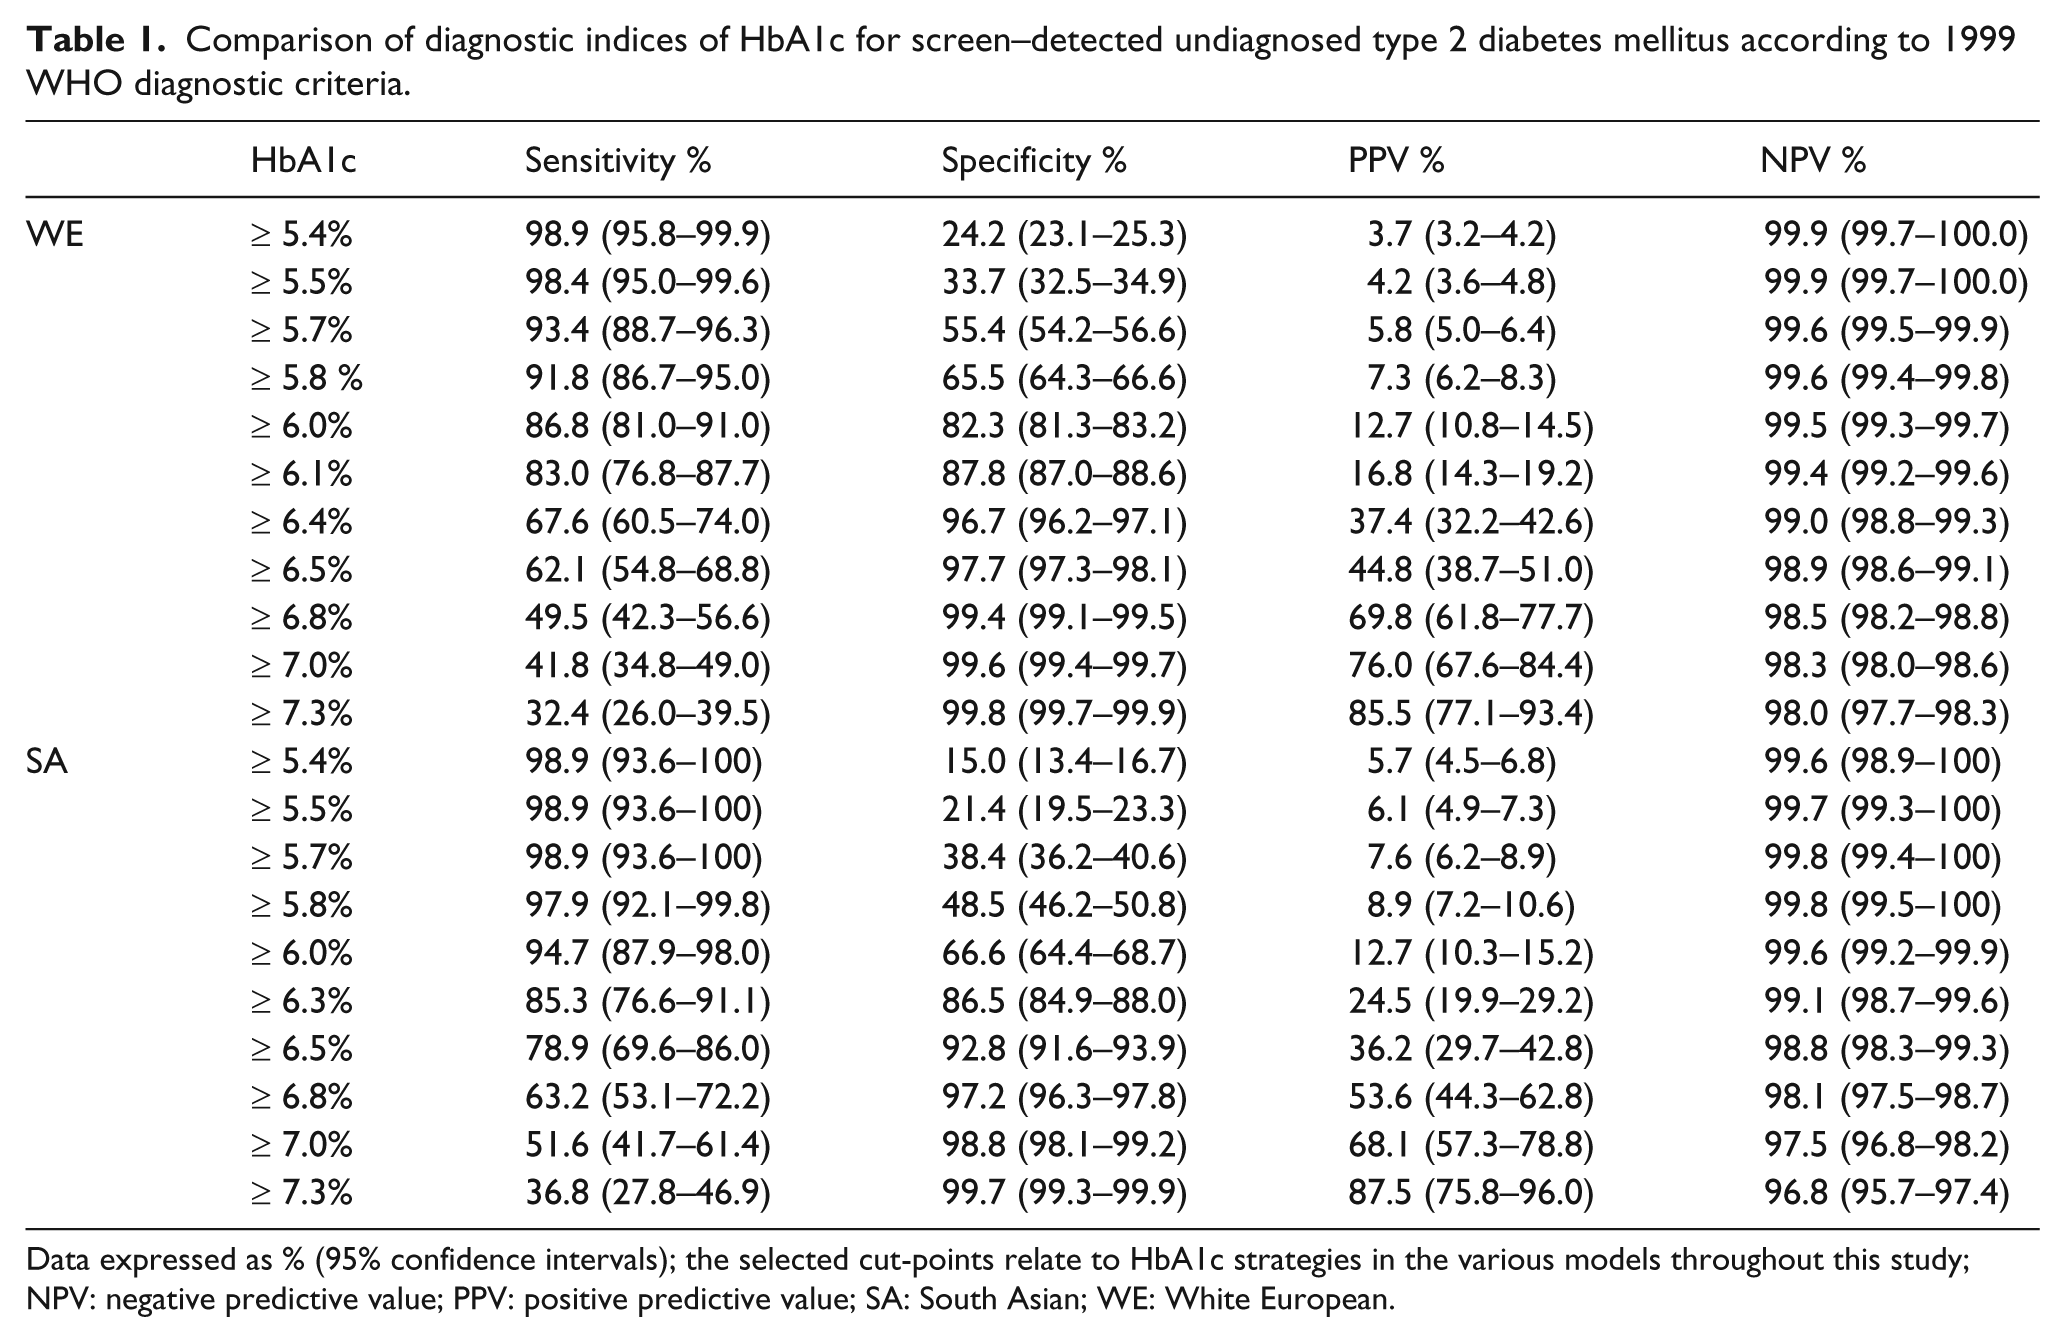
Data expressed as % (95% confidence intervals); the selected cut-points relate to HbA1c strategies in the various models throughout this study; NPV: negative predictive value; PPV: positive predictive value; SA: South Asian; WE: White European.
The AUROC for HbA1c detecting diabetes in white Europeans and South Asians were 0.92 (CI 0.89–0.94) and 0.93 (CI 0.91–0.96), respectively. The optimal ROC curve-derived HbA1c cut-point for detecting diabetes in white Europeans was ≥ 6.1% (sensitivity 83.0%/specificity 87.8%) and in South Asians was HbA1c ≥ 6.3% (sensitivity 87.9%/specificity 85.5%).
Regarding the actual numbers of people detected, use of an OGTT detected 291 (3.3%) people with diabetes. There were 198 people (2.3%) who had diabetes revealed by both OGTT and an HbA1c ≥ 6.5%. In contrast, the number of people with diabetes revealed by OGTT and the two-cut-points strategies Models 1 to 5 were 287 (3.3%), 283 (3.2%), 274 (3.1%), 268 (3.0%) and 270 (3.1%), respectively.
Performance of two-cut-point strategies to diagnose diabetes
The five models investigated are shown in Table 2; associated diagnostic indices and 95% CI for HbA1c cut-points are in Table 1.
Detection of diabetes and impaired glucose regulation (IGR) using various two HbA1c cut-point thresholds.
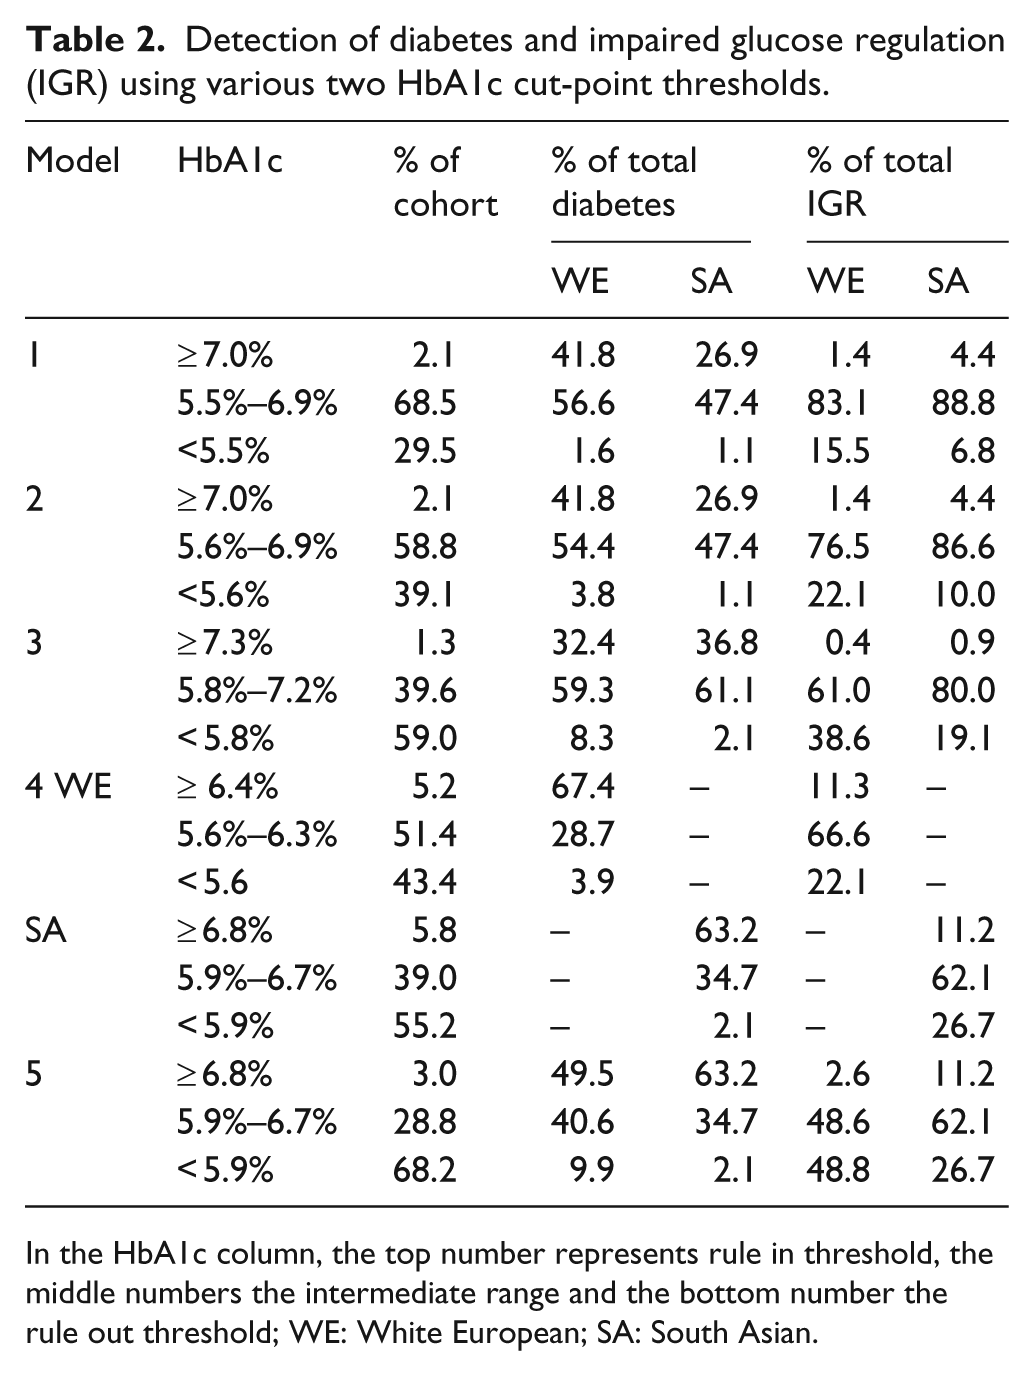
In the HbA1c column, the top number represents rule in threshold, the middle numbers the intermediate range and the bottom number the rule out threshold; WE: White European; SA: South Asian.
Within Model 1, using thresholds of HbA1c ≤ 5.5% and ≥ 7.0% produced high sensitivity, specificity and NPV greater than 98.0% in both ethnic groups (but moderate PPV of 76.0% in white Europeans and 68.1% in South Asians). However, a potential disadvantage was that there were 5115 (58.8%) people with intermediate HbA1c of 5.6% to 6.9% who would require a second test. A similar problem was found with Models 2 and 3, where the intermediate HbA1c group also consisted of many individuals using 5.5% to 6.9% (n = 6133, 70.5%) and 5.8% to 7.2% (n = 3447, 39.6%), respectively. Within Model 5, use of HbA1c ≤ 5.8% and ≥ 6.8% (40 mmol/mol and 51 mmol/mol) for ‘rule in’ and ‘rule out’ respectively produced an intermediate HbA1c group of 2504 (28.8%) people. Using these narrower thresholds maintained a similar high sensitivity, specificity and negative predictive value of greater than 91.0% in both ethnic groups (with a moderate PPV of 69.8% in white Europeans and 53.6% in South Asians). Therefore, Model 5 was considered the most efficient overall two-cut point strategy as it balanced the highest diagnostic performance with the lowest numbers requiring a second test in a trade-off between these two factors.
Cost analysis
Using a two cut-point strategy of HbA1c ≤ 5.8% and ≥ 6.8% (Model 5) in white Europeans, a lower cost per case of diabetes was produced compared to using HbA1c ≥ 6.5% of £38.53 (95% CI 1.89–86.81) (Table 3).
Comparison of cost estimations for one and two HbA1c cut-point strategies.
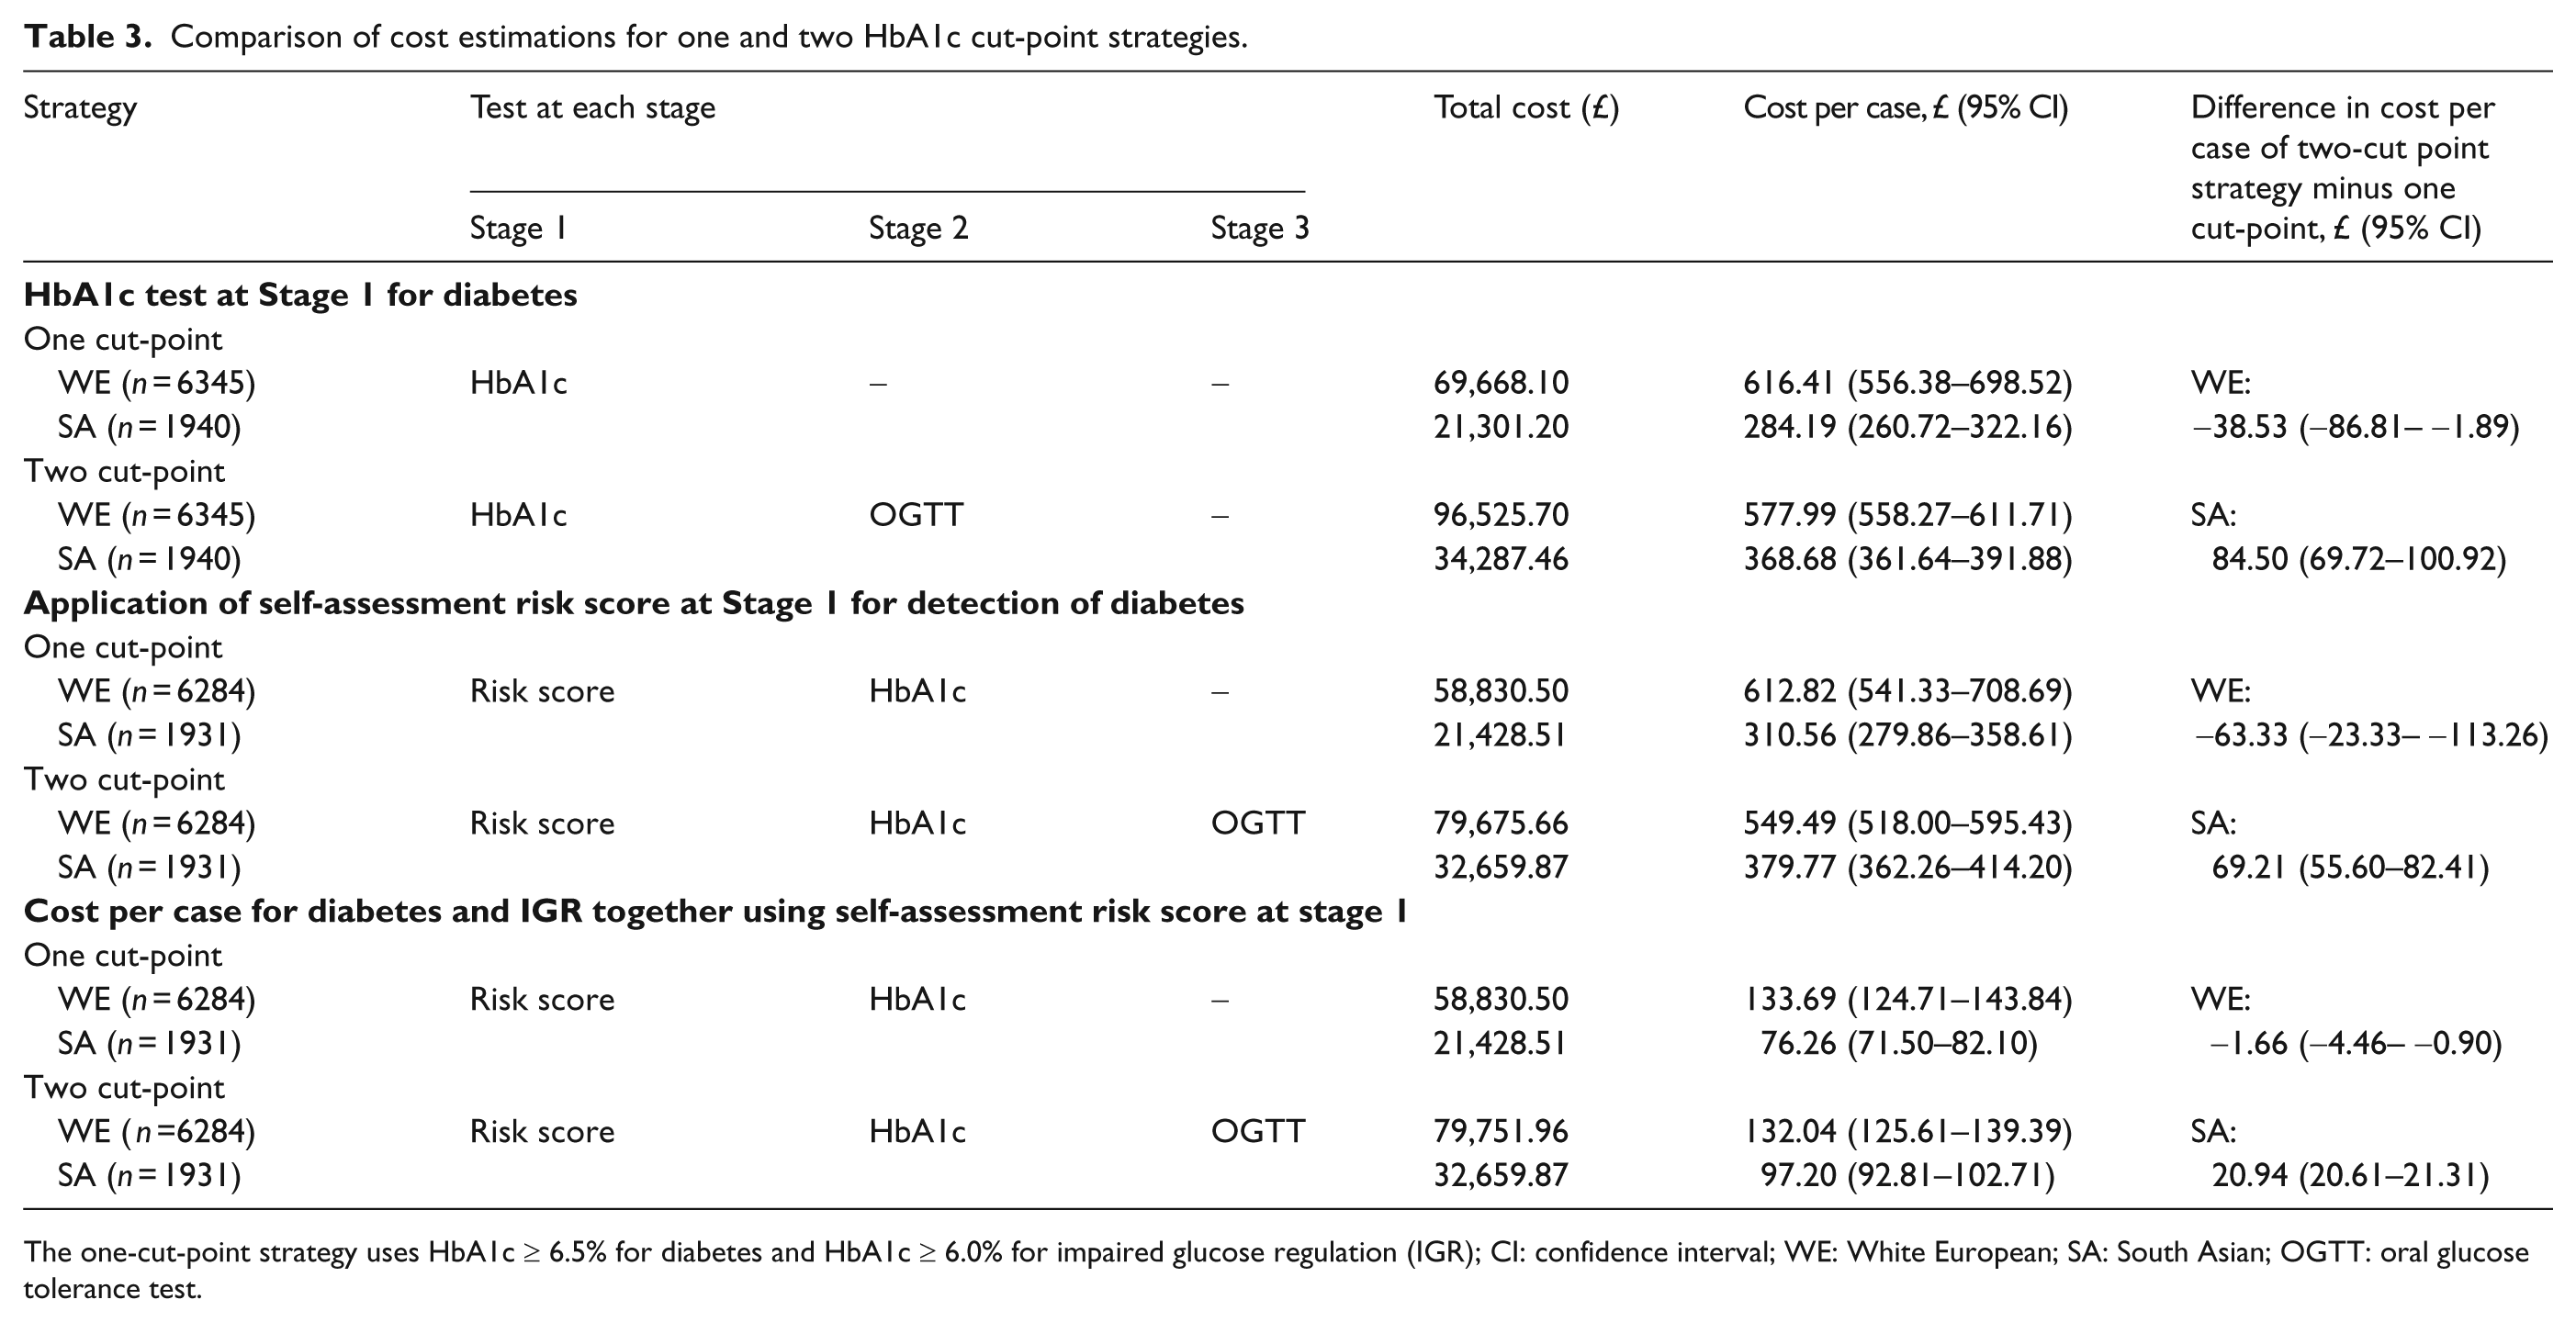
The one-cut-point strategy uses HbA1c ≥ 6.5% for diabetes and HbA1c ≥ 6.0% for impaired glucose regulation (IGR); CI: confidence interval; WE: White European; SA: South Asian; OGTT: oral glucose tolerance test.
However, the same two cut-point strategy was more expensive in South Asians by £84.50 (69.72–100.92) per case of diabetes. When a self-assessment risk score ≥ 14 was applied at Stage 1, the same two-cut-point strategy demonstrated a cost reduction in white Europeans of £63.33 (23.33–113.26) in comparison to HbA1c ≥ 6.5%. In comparison to standard diagnostic tests, when OGTT was used to diagnose diabetes (WHO 1999 criteria), the cost per case for diabetes was £547.26 (547.26–569.47) in white Europeans and £326.89 (326.89 to 333.90) in South Asians. If FPG ≥ 7.0 mmol/l only was used to diagnose diabetes, the cost per case for diabetes was £498.89 (450.98–562.92) in white Europeans and £365.05 (306.66–451.53) in South Asians.
Discussion
The main findings of this study demonstrated the improved sensitivity of detecting diabetes by using a two-cut-point strategy compared to a single cut-point of HbA1c ≥ 6.5%. However, the main disadvantage was the high number of people requiring a subsequent test, more than 50% in some models, suggesting the clinical utility of using a two-cut-point strategy was low, in this population at least. To reduce the number of people in the intermediate HbA1c group undergoing a second test, we found using narrower HbA1c cut-points of ≤ 5.8% and ≥ 6.8% (Model 5) still detected 28.8% of the cohort as requiring a second test. However, this two-cut-point strategy produced a lower cost per case of diabetes than using HbA1c ≥ 6.5% in white Europeans.
Previous studies have analysed the diagnostic performance of a single HbA1c cut-point to detect diabetes, but only isolated studies have investigated using a two-cut-point strategy.18,32 The present study is the first to compare performance of various recommended two-HbA1c cut-point strategies against each other and to include a cost per case analysis. Other strengths of our study included the ability to test each strategy in a large cohort, with high numbers of different ethnic groups reflecting much of the UK and Northern Europe. Furthermore, all individuals underwent an OGTT, which allowed detection of diabetes developed through post-prandial and fasting hyperglycaemia. Regarding limitations, the various HbA1c cut-points and strategies were analysed for detection of diabetes from a standard definition of an OGTT. Second, although the cost estimations produced a lower cost per case of diabetes using the two-cut-point strategies in white Europeans, the 95% CIs were large in most cases. Third, our HbA1c analyser was able to detect Hb S and C, therefore, such values were not reported in the present study, but in theory no other Hb variants were excluded for people with iron deficiency anaemia. Haemoglobinopathies may increase or decrease HbA1c as they represent factors affecting HbA1c other than glycaemia. Iron and vitamin B12 deficiency, hyperbilirubinaemia, carbamylated haemoglobin and splenectomy are other examples of conditions which can increase HbA1c. In contrast, administration of erythropoietin, chronic liver disease and hypertriglyceridaemia can decrease HbA1c. 3 Furthermore, there are some suggestions of normal haematological variation in HbA1c and these may impact more on using a single HbA1c cut-point than a two-cut-point strategy, as the latter introduces glucose tests for people in the intermediate range. 33
The ethnic differences in detection rates of diabetes using HbA1c were higher in South Asians than in white Europeans. A possible explanation may be because South Asians have higher levels of insulin resistance. 34 As HbA1c incorporates a 24-hour glucose profile for the previous two to three months, it will be able to account for more of the insulin resistance. Second, our standard diagnostic tool was an OGTT including two-hour plasma glucose, which is more closely related to insulin resistance. Theoretically, if FPG had been the standard diagnostic tool only, then results may have been different. However, test performance of HbA1c to detect diabetes on OGTT or on FPG only was not significantly different in each ethnic group (data not shown).
Implications for clinicians and policy makers
HbA1c may become the preferred diagnostic tool to detect diabetes in clinical practice. However, using a single cut-point of HbA1c ≥ 6.5% lacked some degree of sensitivity (62.1%) for detecting diabetes in white Europeans, suggesting that some caution is required. Despite an overall low clinical utility in the present study, the two-cut-point strategy increased sensitivity to 91.8% using a ‘rule out’ cut-point of HbA1c ≤ 5.8% (Model 5). Therefore, despite a higher total cost of the two-cut-point strategy than HbA1c ≥ 6.5%, the extra number of diabetes cases detected reduced the overall cost per case by £38.53. In contrast, there was no associated cost benefit within South Asians as the total number of extra diabetes cases detected from using the two-cut-point strategy compared to HbA1c ≥ 6.5% was relatively smaller (sensitivity 78.9% vs. 97.9%, respectively).
Our study found the most efficient ‘rule out, rule in’ strategy (i.e. a trade-off between high diagnostic performance and low numbers requiring a second test) used narrower HbA1c cut-points of ≤ 5.8% and ≥ 6.8% than those recommended by international organisations. These selected cut-points reduced the size of the intermediate HbA1c group and remain within the range that predicts the onset of retinopathy.1,12–14 However, whether using narrower or broader HbA1c cut-points should be employed is likely to vary between populations. To understand how many people require a subsequent test, the key influence is to observe the distribution of HbA1c values throughout a given population (i.e. the mean cohort HbA1c and its standard deviation) which determines the number of people shifted into the intermediate HbA1c group. A simple hypothesis would suggest populations with a higher mean cohort HbA1c (for example, ≥ 5.7%) require narrower intermediate HbA1c cut-points to reduce the size of the group, such as those suggested in Model 5. In contrast, populations with lower mean cohort HbA1c (for example, ≤ 5.3%) can use broader intermediate HbA1c cut-points, such as 5.6% to 6.9%, as fewer people are shifted into this range. Our cohort had a relatively high mean cohort HbA1c (5.71%, SD 0.62), which resulted in a large spread of HbA1c values throughout the 5.6% to 6.9% intermediate HbA1c range, reducing potential clinical application. Other populations, however, may not experience this problem as other population-based cohorts show mean HbA1c ranging from 5.1% to 5.9%.6,10,35 Therefore, separate regions or populations may have to define their own optimal two-cut-points strategy and determine any clinical utility. Other organisations have suggested alternate methods of incorporating HbA1c into the diagnosis of diabetes. In the US, the Veterans Affairs/Department of Defense have suggested a single HbA1c cut-point for diabetes diagnosis which is higher than other organisations, at HbA1c ≥ 7.0%, or both an HbA1c ≥ 6.5% together with FPG ≥ 7.0 mmol/l. 36 They also recommend impaired glucose regulation (IGR) as HbA1c 5.7%–6.4% and FPG between 5.6 mmol/l and 6.9 mmol/l. 36 The WHO have suggested an HbA1c ≥ 6.5% should be used for diagnosis of diabetes, however, a value less than 6.5% does not exclude diabetes diagnosed using glucose tests, which is also endorsed by UK expert groups. 37 Future research should focus on the value of using a two-HbA1c cut-point strategy and other suggested strategies.
Footnotes
Acknowledgements
We would like to acknowledge Steve Hiles, Joe Henson, Nick Taub, Janet Jarvis, Su Sehmi, Jennifer Tringham, Sudesna Chatterjee and all other members of the ADDITION-Leicester and Screening Those At Risk (STAR) teams and the participants for their contributions, as well as support from National Institute of Health Research Collaboration for Leadership in Applied Health Research and Care Leicestershire, Northamptonshire and Rutland (NIHR CLAHRC LNR) and National Institute of Health Research Leicester – Loughborough Diet, Lifestyle and Physical Activity Biomedical Research Unit.
Abbreviations
AACE/ACE = American Association of Clinical Endocrinologists/ American College of Endocrinology, ABCD = Association of British Clinical Diabetologists, ADA = American Diabetes Association, AUROC = Area under ROC Curve, CI= 95% confidence interval, FPG = fasting plasma glucose, IEC = International Expert Committee, OGTT = oral glucose tolerance test, ROC = receiver operator characteristic, SA = South Asian, SD = standard deviation, WE = White European, WHO = World Health Organization
Funding
The ADDITION-Leicester study was funded by Department of Health (Trial Registration number: NCT00318032) and STAR was funded by Leicester Lord Mayor’s Diabetes Appeal. KK and MJD obtained funding for ADDITION-Leicester/STAR and provided administrative, technical and material support.
Conflict of interest statement
MJD and KK are advisors to the UK Department Health for the NHS Health Checks Programme. KK (chair) and MJD are members of the National Institute for Health and Clinical Excellence Public Health Guidance on prevention of Type 2 diabetes among people with prediabetes. MJD has received funds for research and honoraria for speaking at meetings and has served on advisory boards for Lilly, Sanofi Aventis, MSD, Novo Nordisk, BMS, BI and Roche. KK has received funds for research and honoraria for speaking at meetings and/or served on advisory boards for Astra Zeneca, GSK, Lilly, Novartis, Pfizer, Servier, Sanofi Aventis, MSD and Novo Nordisk. SAM, KK, MJD and ESK attended a UK expert meeting on HbA1c for diagnosis in the UK (June 2010). SAM and DW have received a research training fellowship from Novo Nordisk Research Foundation UK.