
Abstract
This study examined the relationship between cardiorespiratory fitness determined by a non-exercise testing method for estimating fitness and predicted risk of developing type 2 diabetes mellitus using five risk assessments/questionnaires (Leicester Diabetes Risk Score, QDiabetes, Cambridge Risk Score, Finnish Diabetes Risk Score and American Diabetes Association Diabetes Risk Test). Retrospective analysis was performed on 330 female individuals with no prior diagnosis of cardiovascular disease or type 2 diabetes mellitus who participated in the Prosiect Sir Gâr workplace initiative in Carmarthenshire, South Wales. Non-exercise testing method for estimating fitness (expressed as metabolic equivalents) was calculated using a validated algorithm, and females were grouped accordingly into fitness quintiles <6.8 metabolic equivalents (Quintile 1), 6.8–7.6 metabolic equivalents (Quintile 2), 7.6–8.6 metabolic equivalents (Quintile 3), 8.6–9.5 metabolic equivalents (Quintile 4), >9.5 metabolic equivalents (Quintile 5). Body mass index, waist circumference, and HbA1c all decreased between increasing non-exercise testing method for estimating fitness quintiles (p < 0.05), as did risk prediction scores in each of the five assessments/questionnaires (p < 0.05). The proportion of females in Quintile 1 predicted at ‘high risk’ was between 20.9% and 81.4%, depending on diabetes risk assessment used, compared to none of the females in Quintile 5. A calculated non-exercise testing method for estimating fitness <6.8 metabolic equivalents could help to identify females at ‘high risk’ of developing type 2 diabetes mellitus as predicted using five risk assessments/questionnaires.
Introduction
Cardiorespiratory fitness (CRF) remains underutilised and overlooked in clinical practice 1 despite evidence demonstrating CRF to be an independent risk factor for glycaemic control, 2 insulin resistance 3 and, ultimately, type 2 diabetes mellitus (T2DM).4,5 The main reason for the lack of translation into the clinical setting is likely a result of the practical implications of CRF assessments. In comparison to other clinical measurements, CRF testing requires specialist equipment, trained staff, is often costly and can be time-consuming to perform. 6 Additionally, there is an absence of guidance and/or consensus on interpreting health-related CRF values. 7
However, the measurement of CRF need not be time-consuming and a simple measure of resting heart rate (RHR) has been shown to be a good indicator of CRF. 8 In fact, RHR in combination with a number of routinely collected clinical variables [age, gender, body mass index (BMI) and self-reported physical activity] have been included in the development of two calculations to estimate CRF without the need for exercise.6,7 When compared directly to objectively measured CRF, the non-exercise testing of CRF has demonstrated multiple correlation coefficient r values of between 0.76 and 0.81 and standard error estimates of between 1.45 and 1.97 metabolic equivalents (METS). 7 Evidence also suggests that these non-exercise testing methods for estimating fitness (NET-F) equations are as accurate as some submaximal methods to estimate CRF. 9 In addition, the NET-F equations provide both a low-risk and low-cost alternative to conventional methods of assessing CRF. 9
From a clinical perspective, the NET-F equations have demonstrated strong associations with all-cause and cardiovascular mortality6,10 and also non-fatal cardiovascular events. 10 Grouping individuals by NET-F values into quintiles resulted in a fair calibration between observed and predicted cardiovascular disease (CVD) mortality, with the lowest NET-F threshold quintile values (and therefore highest CVD risk) calculated to be 9.5 and 6.8 METS in males and females, respectively. 6 In addition, for every 1.6–1.7 METS increase in NET-F, there was a 25% (10%–33%) and 27% (8%–40%) decrease in CVD mortality risk in males and females, respectively. 6 Furthermore, the discriminative ability of NET-F in predicting CVD mortality (c-statistic: 0.73–0.75) is comparable to that of the globally used Framingham risk prediction model (c-statistic: 0.74–0.776).
While it appears that there is an established association between NET-F values and risk of CVD, the relationship between NET-F and T2DM has not yet been explored either as individual NET-F values or by quintile groupings. The global burden of T2DM is projected to grow substantially by 2035, 11 and identifying individuals at ‘high risk’ is an important consideration to facilitate pharmacological and/or lifestyle interventions to prevent development in these individuals to T2DM. 12 Screening tools such as validated risk assessments and questionnaires are recommended and common approaches to identify ‘high risk’ individuals.13,14 It would be of merit to investigate whether the associations surrounding CVD and predictive capabilities of the NET-F equations are also observed in T2DM risk factors and risk prediction scores.
Therefore, the aim of this study was to examine any relationship between estimated CRF calculated by NET-F and the predicted risk of T2DM assessed by five validated risk assessments/questionnaires.
Methods
Study population
Retrospective analysis was performed on a sample of 330 female health board employees who participated in the Prosiect Sir Gâr 15 workplace initiative in Carmarthenshire, South Wales. All employees aged ⩾40 years (Caucasian) or ⩾25 years (South Asian) with no prior history of CVD or T2DM were invited to attend a risk assessment.
Risk assessment and baseline measurements
During normal working hours, individuals attended the occupational health department for an appointment lasting 30–40 min. During the visit, demographic (date of birth, gender, postcode of residence and ethnicity) and anthropometric (body mass, height and waist circumference) data were collected. Systolic and diastolic blood pressure, RHR, smoking status, dietary habits (fruit and vegetable consumption), family and medical histories were recorded. Blood samples were obtained via capillary puncture and analysed immediately for HbA1c (DCA 2000; Siemens Healthcare Diagnostics Ltd, Frimley, UK). In addition, current physical activity levels were assessed by the General Practice Physical Activity Questionnaire (GPPAQ). Full details of the risk appointment have been published extensively, elsewhere. 15
Calculation of NET-F
The estimation of CRF (expressed as a maximal rate of METS) was calculated using a validated algorithm that includes age, gender, BMI, RHR and self-reported physical activity in the equation. 6 The calculation is as follows: NET-F = [sex coefficient × 2.78 − (age × 0.11) − (BMI × 0.17) − (RHR × 0.05) + (physical activity level coefficient) + 21.41]; there are five physical activity level coefficients and full details are provided elsewhere. 6 NET-F values were grouped accordingly into the following quintiles: <6.8 METS (Quintile 1), 6.8–7.6 METS (Quintile 2), 7.6–8.6 METS (Quintile 3), 8.6–9.5 METS (Quintile 4) and >9.5 METS (Quintile 5). These quintiles were chosen as these were the cut-offs that demonstrated the most accurate calibration between observed and predicted all-cause and CVD mortality in the study carried out by Stamatakis et al. 6
T2DM risk prediction
In this study, the risk of T2DM was predicted using the following five risk assessments: Leicester Diabetes Risk Score (LDRS), 16 QDiabetes, 17 Cambridge Risk Score (CRS), 18 Finnish Diabetes Risk Score (FINDRISC) 19 and American Diabetes Association (ADA) Diabetes Risk Test. 20 These five assessments, although indicative of T2DM risk, were all developed with different clinical outcomes. The QDiabetes and FINDRISC models for predicting 10-year risk of developing T2DM, the CRS and ADA tools for undiagnosed T2DM and the LDRS predicts both 10-year and current risk of T2DM. The LDRS, QDiabetes, FINDRISC and CRS are all included as example assessments in UK guidance to identify individuals at high risk of T2DM. 13 The LDRS is also available on the Diabetes UK website. The ADA risk tool is the American equivalent, available on the ADA website, and unlike many of the available risk tools includes physical activity as a risk factor.
Statistical analysis
Statistical analysis was performed using IBM SPSS Statistics software (version 20; SPSS Inc., Chicago, USA) with statistical significance set at p < 0.05. Normality of data was assessed by one-sample Kolmogorov–Smirnov tests. QDiabetes data were normally distributed following log transformation and represented as geometric mean and approximate standard deviations. Analysis of variance (ANOVA) with post hoc Bonferroni correction factor was used to compare any differences between groups in QDiabetes data. All other data were not normally distributed following log transformation; these datasets are represented as median and interquartile ranges. Mann–Whitney and Kruskal–Wallis tests were used to investigate any between-group differences. Discrete variables are represented as numbers with percentages in brackets; these data were examined using chi-squared analysis again with Bonferroni correction factor applied. Relationships between individual NET-F values and risk prediction scores were assessed using Pearson’s correlation.
Ethical approval
The Prosiect Sir Gâr initiative was approved by Dyfed Powys Local Research Ethics Committee (reference number: 11/WA/0101), and subsequently deemed to be a service-based delivery project.
Results
Baseline variables
The baseline characteristics and diabetes-specific risk factors of the female individuals categorised by NET-F are detailed in Table 1. Of the 330 females, 43 (13.0%), 56 (17.0%), 101 (30.6%), 67 (20.3%) and 63 (19.1%) were calculated to be in Quintiles 1–5, respectively. The age of the female individuals decreased with an increase in NET-F value and across NET-F quintiles. There were also decreases in diabetes-specific risk factors (BMI, waist circumference, blood pressure and HbA1c) with increases in NET-F and associated quintiles. Of interest, with regard to physical activity, one-quarter (25.6%) of females in the lowest NET-F quintile (Quintile 1) and two-fifths (42.9%) of female individuals in Quintile 2 self-reported to be either physically active or moderately active. No differences between NET-F quintiles were observed in the ethnicity of the female individuals (predominantly Caucasian) or in those with a positive family history of diabetes.
Baseline characteristics and diabetes risk factors of females categorised by non-exercise testing cardiorespiratory fitness (NET-F) quintiles.
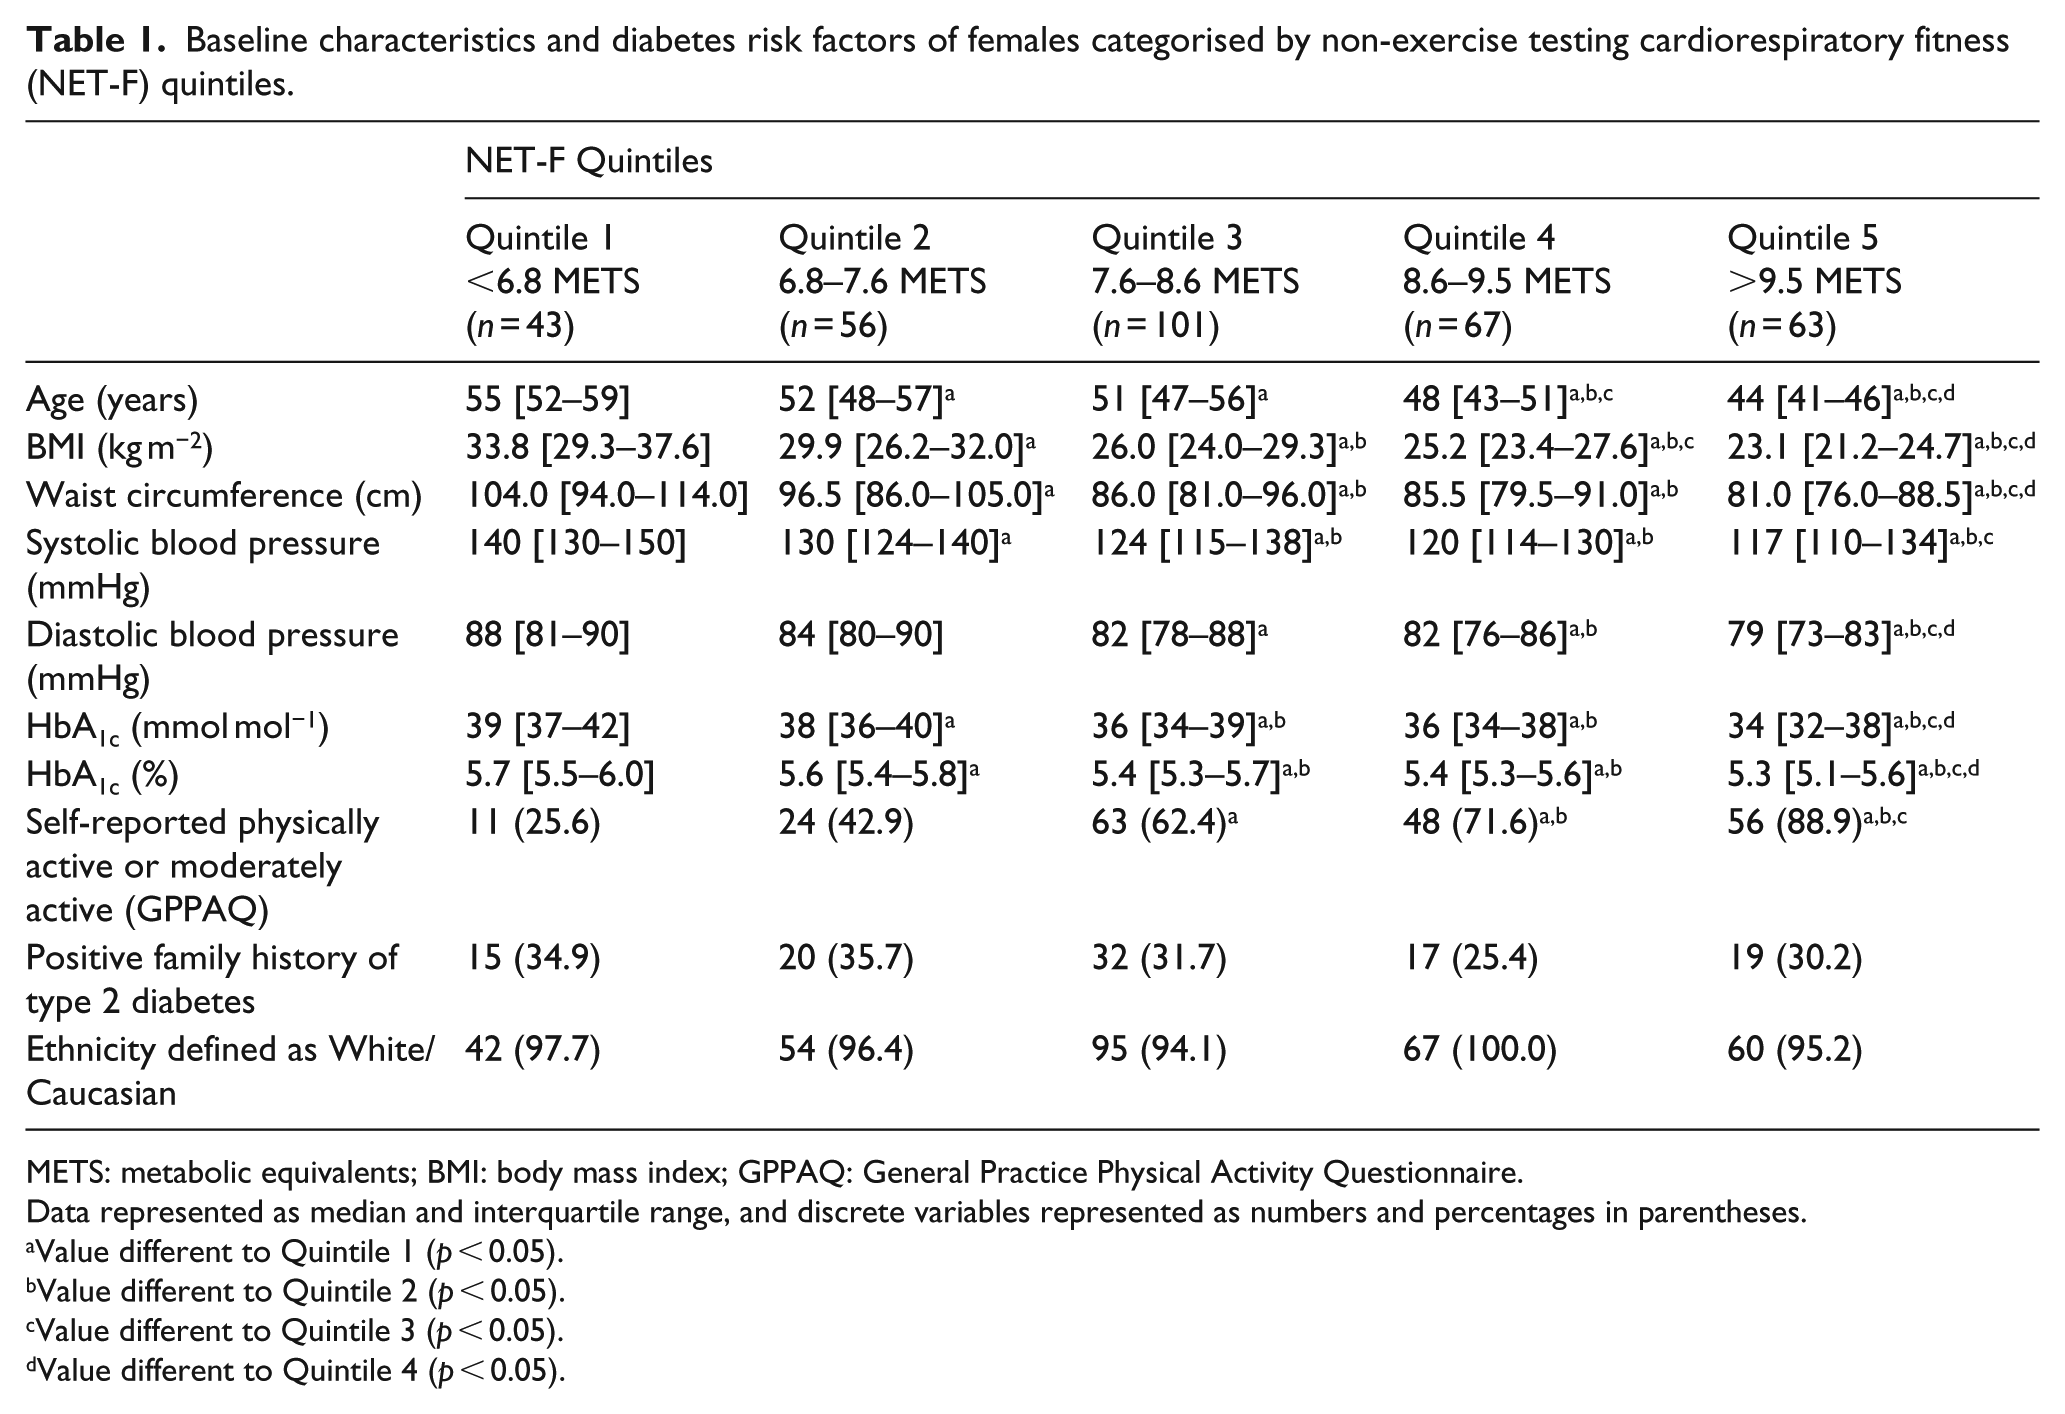
METS: metabolic equivalents; BMI: body mass index; GPPAQ: General Practice Physical Activity Questionnaire.
Data represented as median and interquartile range, and discrete variables represented as numbers and percentages in parentheses.
Value different to Quintile 1 (p < 0.05).
Value different to Quintile 2 (p < 0.05).
Value different to Quintile 3 (p < 0.05).
Value different to Quintile 4 (p < 0.05).
Risk prediction
The differences in diabetes-specific risk factors with increases in NET-F were translated into risk prediction scores; the highest risk scores were observed in the lowest NET-F quintile and vice versa (Table 2). The values in the lowest NET-F quintile (Quintile 1) corresponded to the following categories: ‘High’ (LDRS), ‘Moderate’ (FINDRISC), ‘Intermediate’ (QDiabetes), ‘Higher’ (ADA) and in the second highest quintile of the CRS assessment. In comparison, the risk prediction values of the highest NET-F quintile (Quintile 5) were categorised as ‘Low’ [Leicester Practice Risk Score (LPRS); FINDRISC and QDiabetes], ‘Lower’ (ADA) and in the lowest risk quintile of the CRS. The relationship between individual NET-F values and risk prediction scores was all observed to be negatively correlated and significant (p < 0.05; Figure 1(a) to (e)). The strength of the correlations as reflected by their values varied by risk prediction model: −0.761 (LDRS; Figure 1(a)), −0.510 (FINDRISC; Figure 1(b)), −0.641 (QDiabetes; Figure 1(c)), −0.635 (CRS; Figure 1(d)) and −0.801 (ADA; Figure 1(e)).
Risk prediction scores of females categorised by non-exercise testing cardiorespiratory fitness (NET-F) quartiles.
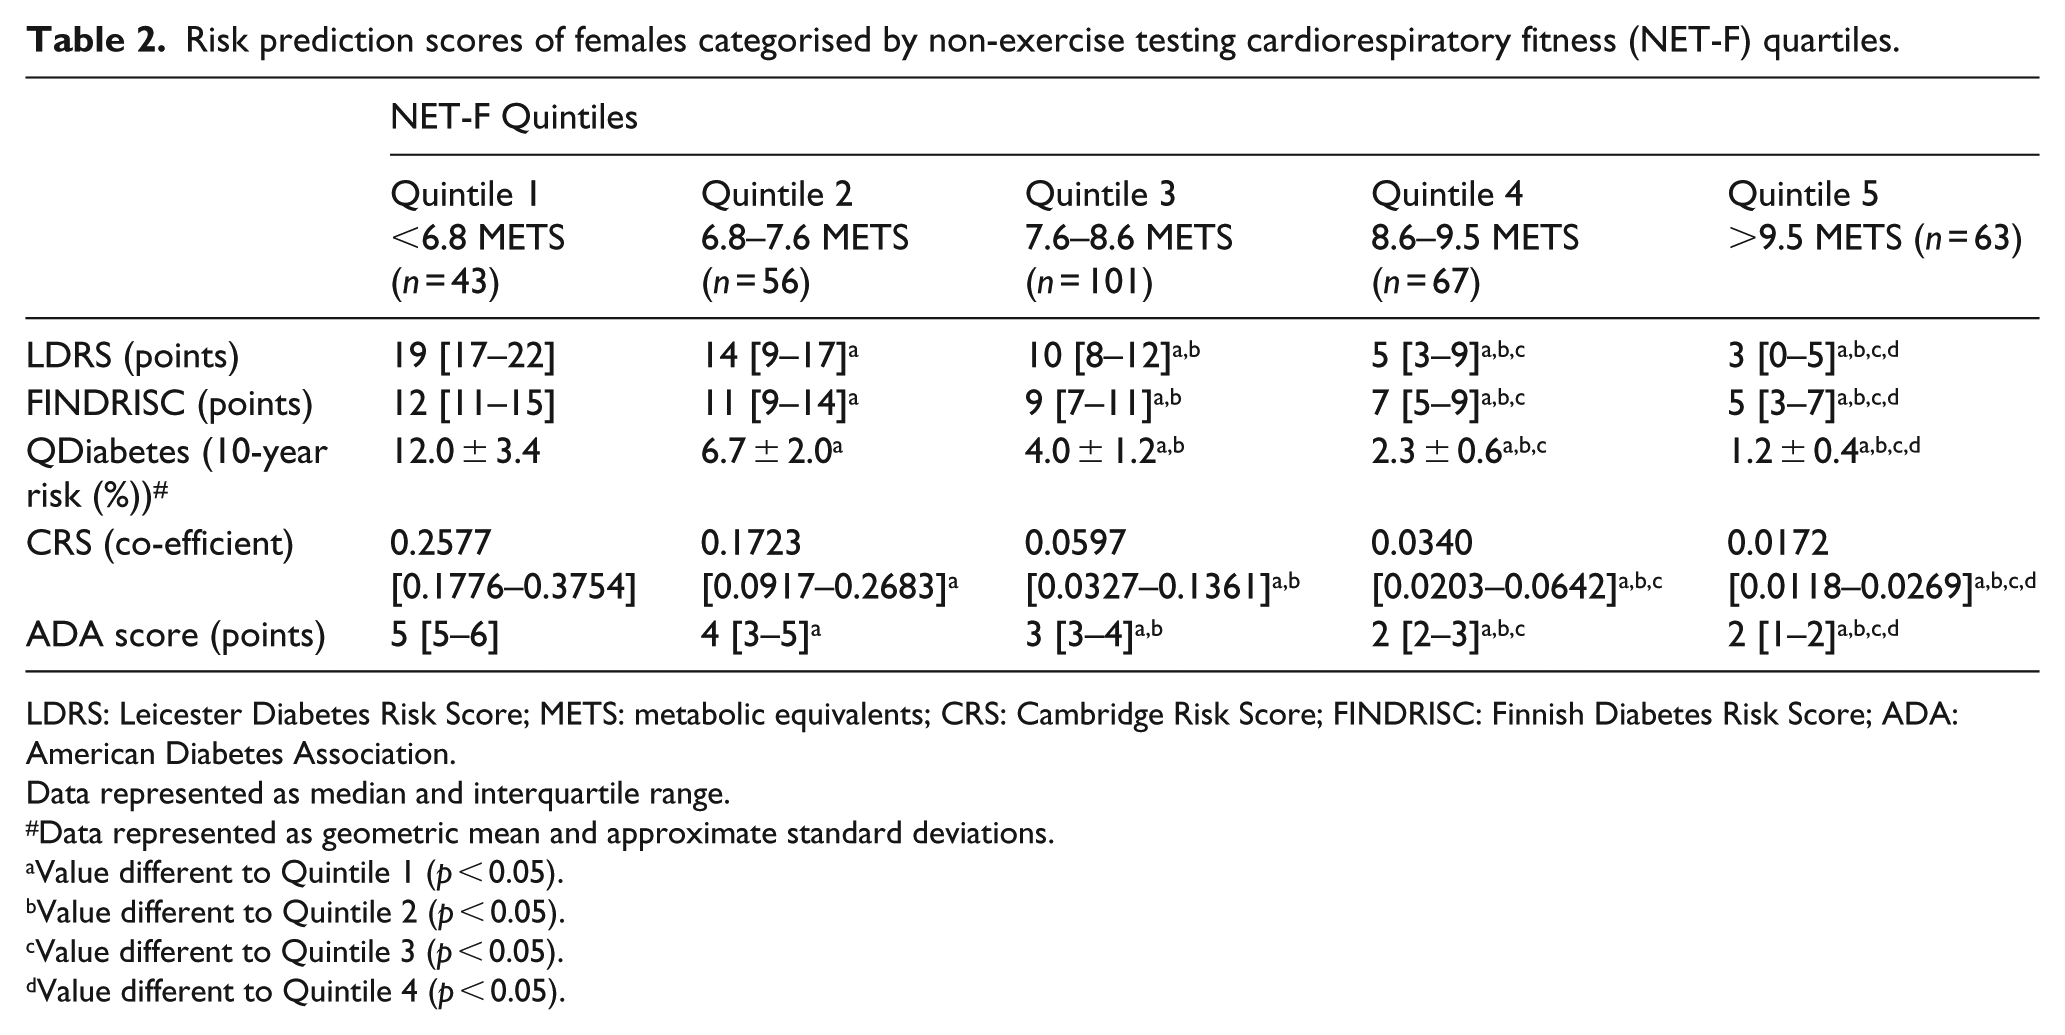
LDRS: Leicester Diabetes Risk Score; METS: metabolic equivalents; CRS: Cambridge Risk Score; FINDRISC: Finnish Diabetes Risk Score; ADA: American Diabetes Association.
Data represented as median and interquartile range.
Data represented as geometric mean and approximate standard deviations.
Value different to Quintile 1 (p < 0.05).
Value different to Quintile 2 (p < 0.05).
Value different to Quintile 3 (p < 0.05).
Value different to Quintile 4 (p < 0.05).
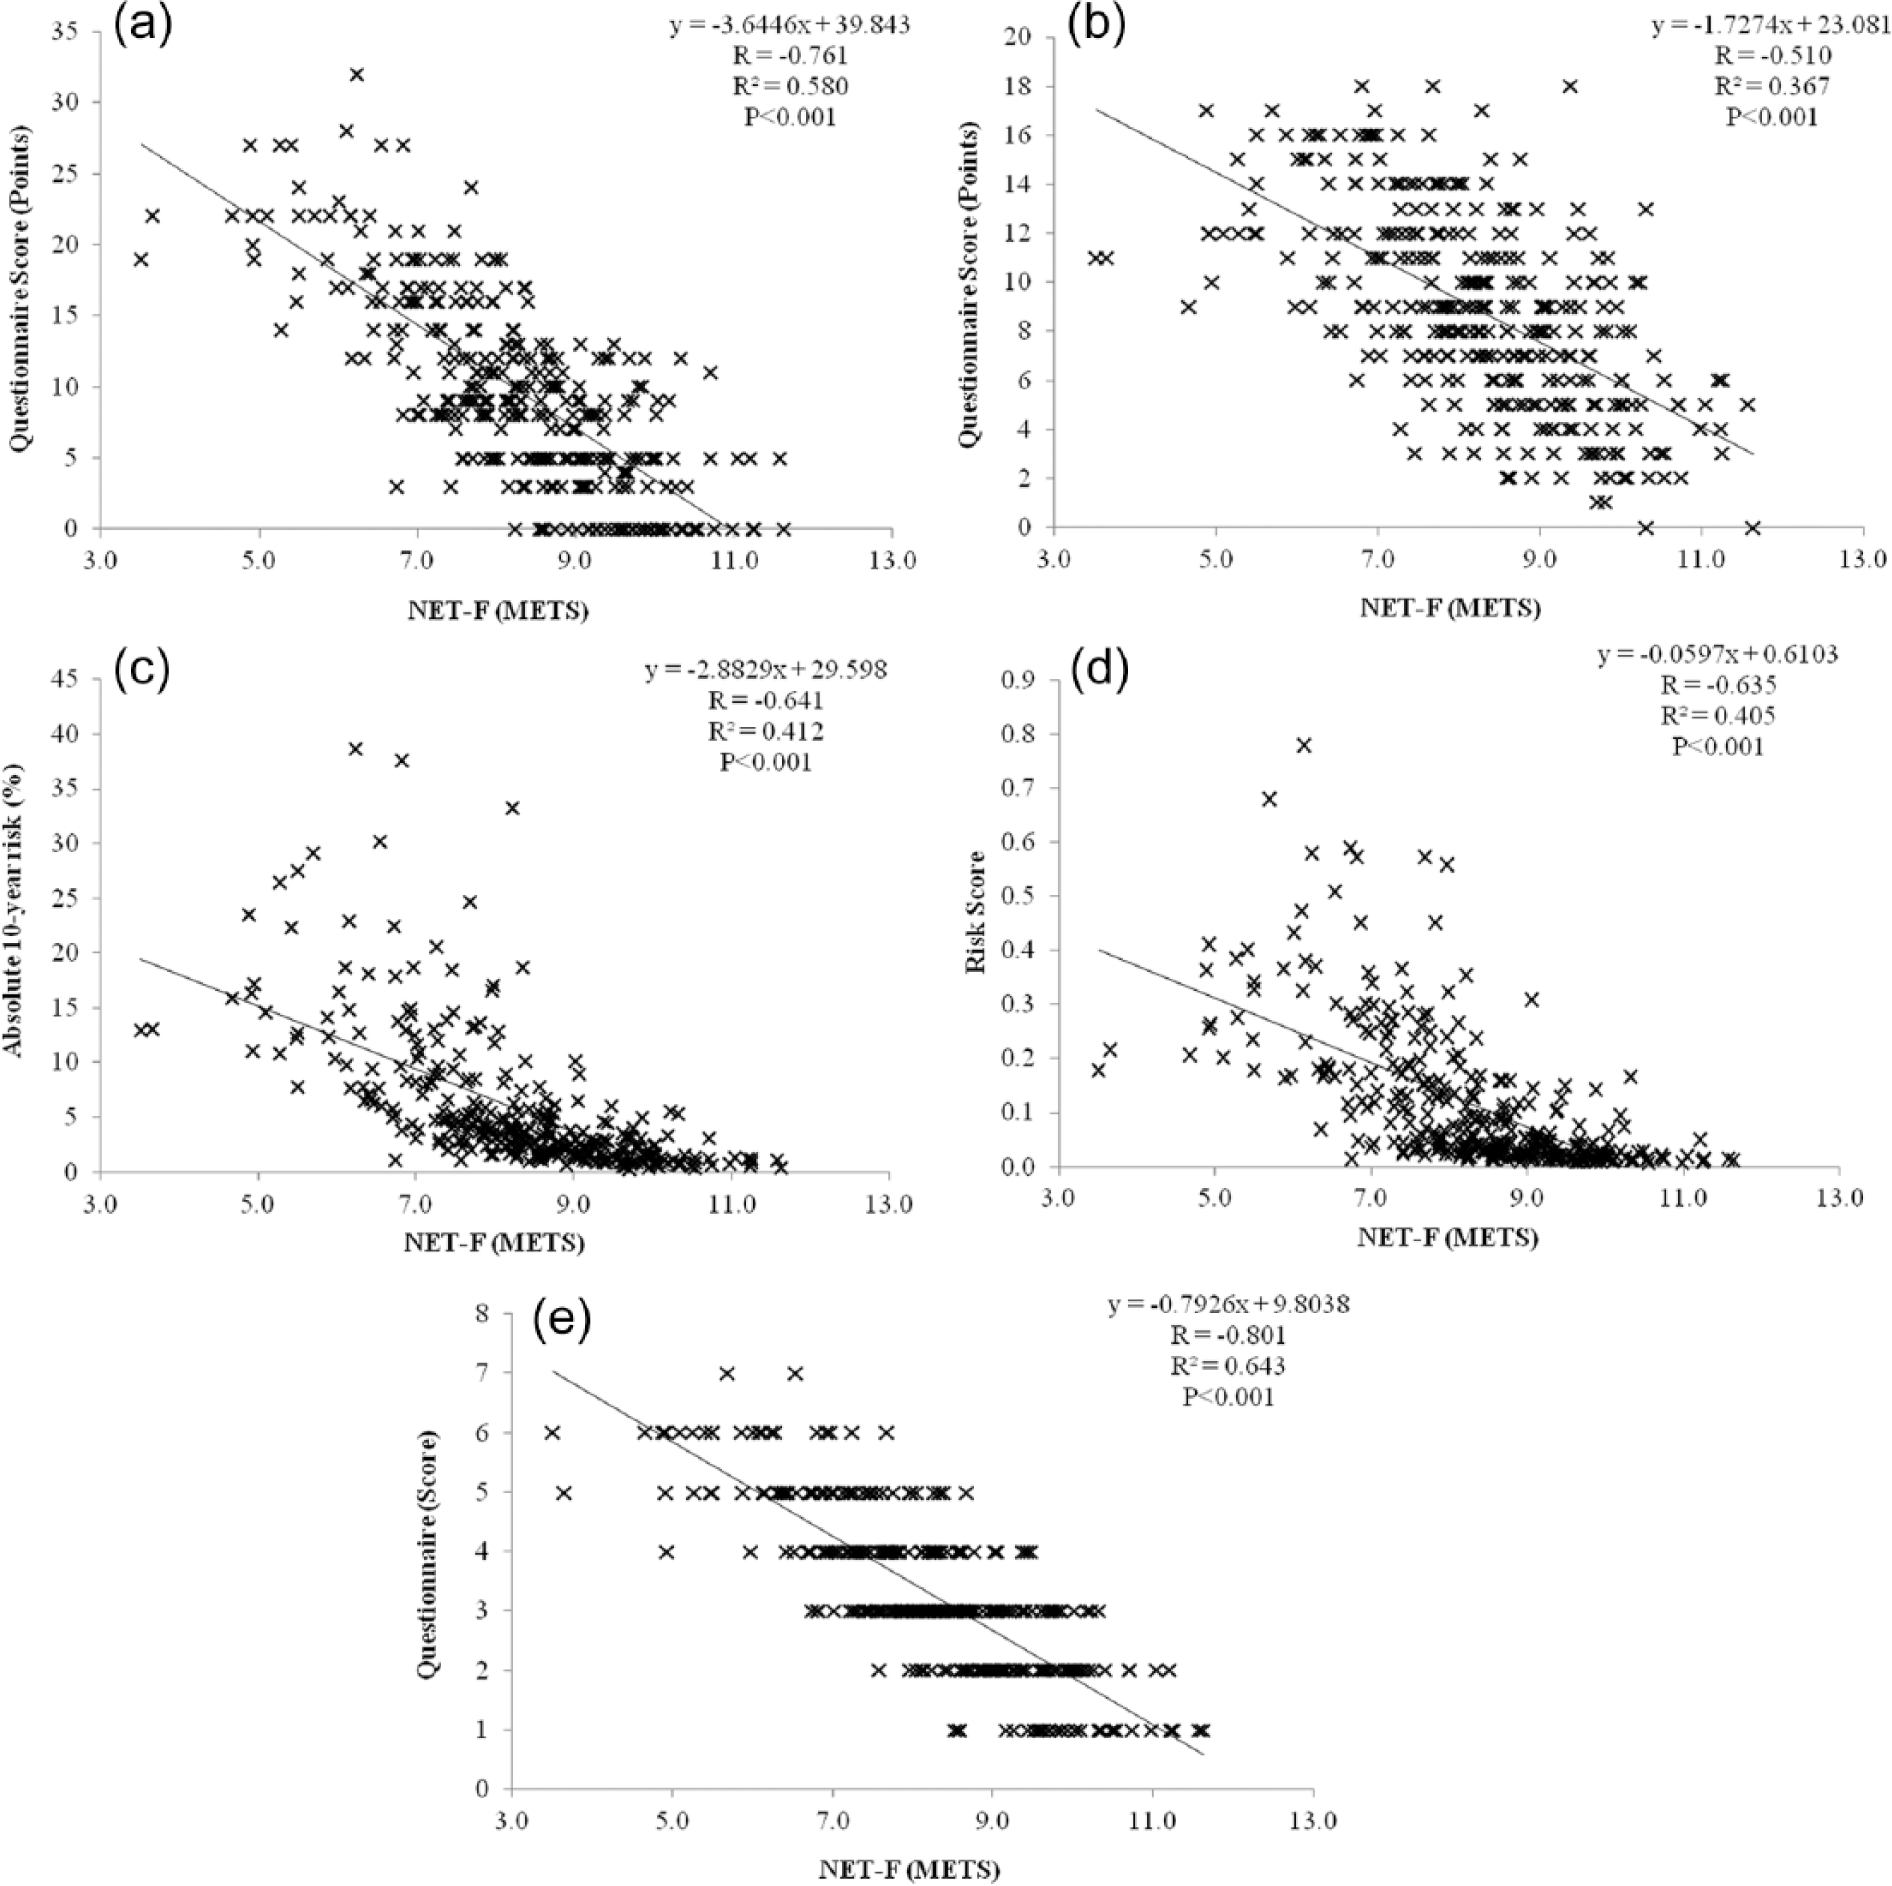
Individual relationships between non-exercise testing cardiorespiratory fitness (NET-F) defined by metabolic equivalents (METS) and risk of developing type 2 diabetes assessed by the (a) Leicester Diabetes Risk Score, (b) FINDRISC, (c) QDiabetes, (d) Cambridge Risk Score and (e) ADA Risk Score assessments/questionnaires.
NET-F and T2DM risk categories
The proportion of females in each NET-F quintiles and the associated categories of the risk assessments are illustrated in Figure 2(a) to (e). The number of risk categories in each assessment differed in number from two (ADA; Figure 2(e)), three (QDiabetes; Figure 2(c)), four (LPRS; FINDRISC; Figure 2(a) and (b), respectively) up to five in the CRS (Figure 2(d)). However, despite the differences in numbers of risk categories, the proportion of females in the lowest NET-F quintile (Quintile 1) in the ‘highest’ risk category was significantly greater than the three upper NET-F quintiles (Quintiles 3–5; p < 0.05). The proportion of females in the lowest NET-F quintile (Quintile 1) ranged from 81.4% (ADA), 32.6% (FINDRISC), 27.9% (CRS), 20.9% (QDiabetes) down to 14.0% (LPRS). It should be considered that in the case of the LDRS, this 14.0% corresponded to the ‘Very High’ risk category; the proportion of females predicted at ‘High’ risk was calculated to be 67.4% (Figure 2(a)). A substantial number of females in Quintile 2 were also predicted to be ‘High’ (42.9%) or ‘Higher’ (37.5%) risk by the LDRS and ADA models, respectively (Figure 2(a) and (e)). In contrast, the proportion of females in the upper two quintiles (Quintiles 4 and 5) predicted in the most ‘at risk’ categories was minimal. None of the females in Quintile 5 were predicted at ‘high risk’, while only the FINDRISC and ADA models predicted 3.0% and 1.5%, respectively, of females in Quartile 4 at ‘high risk’.
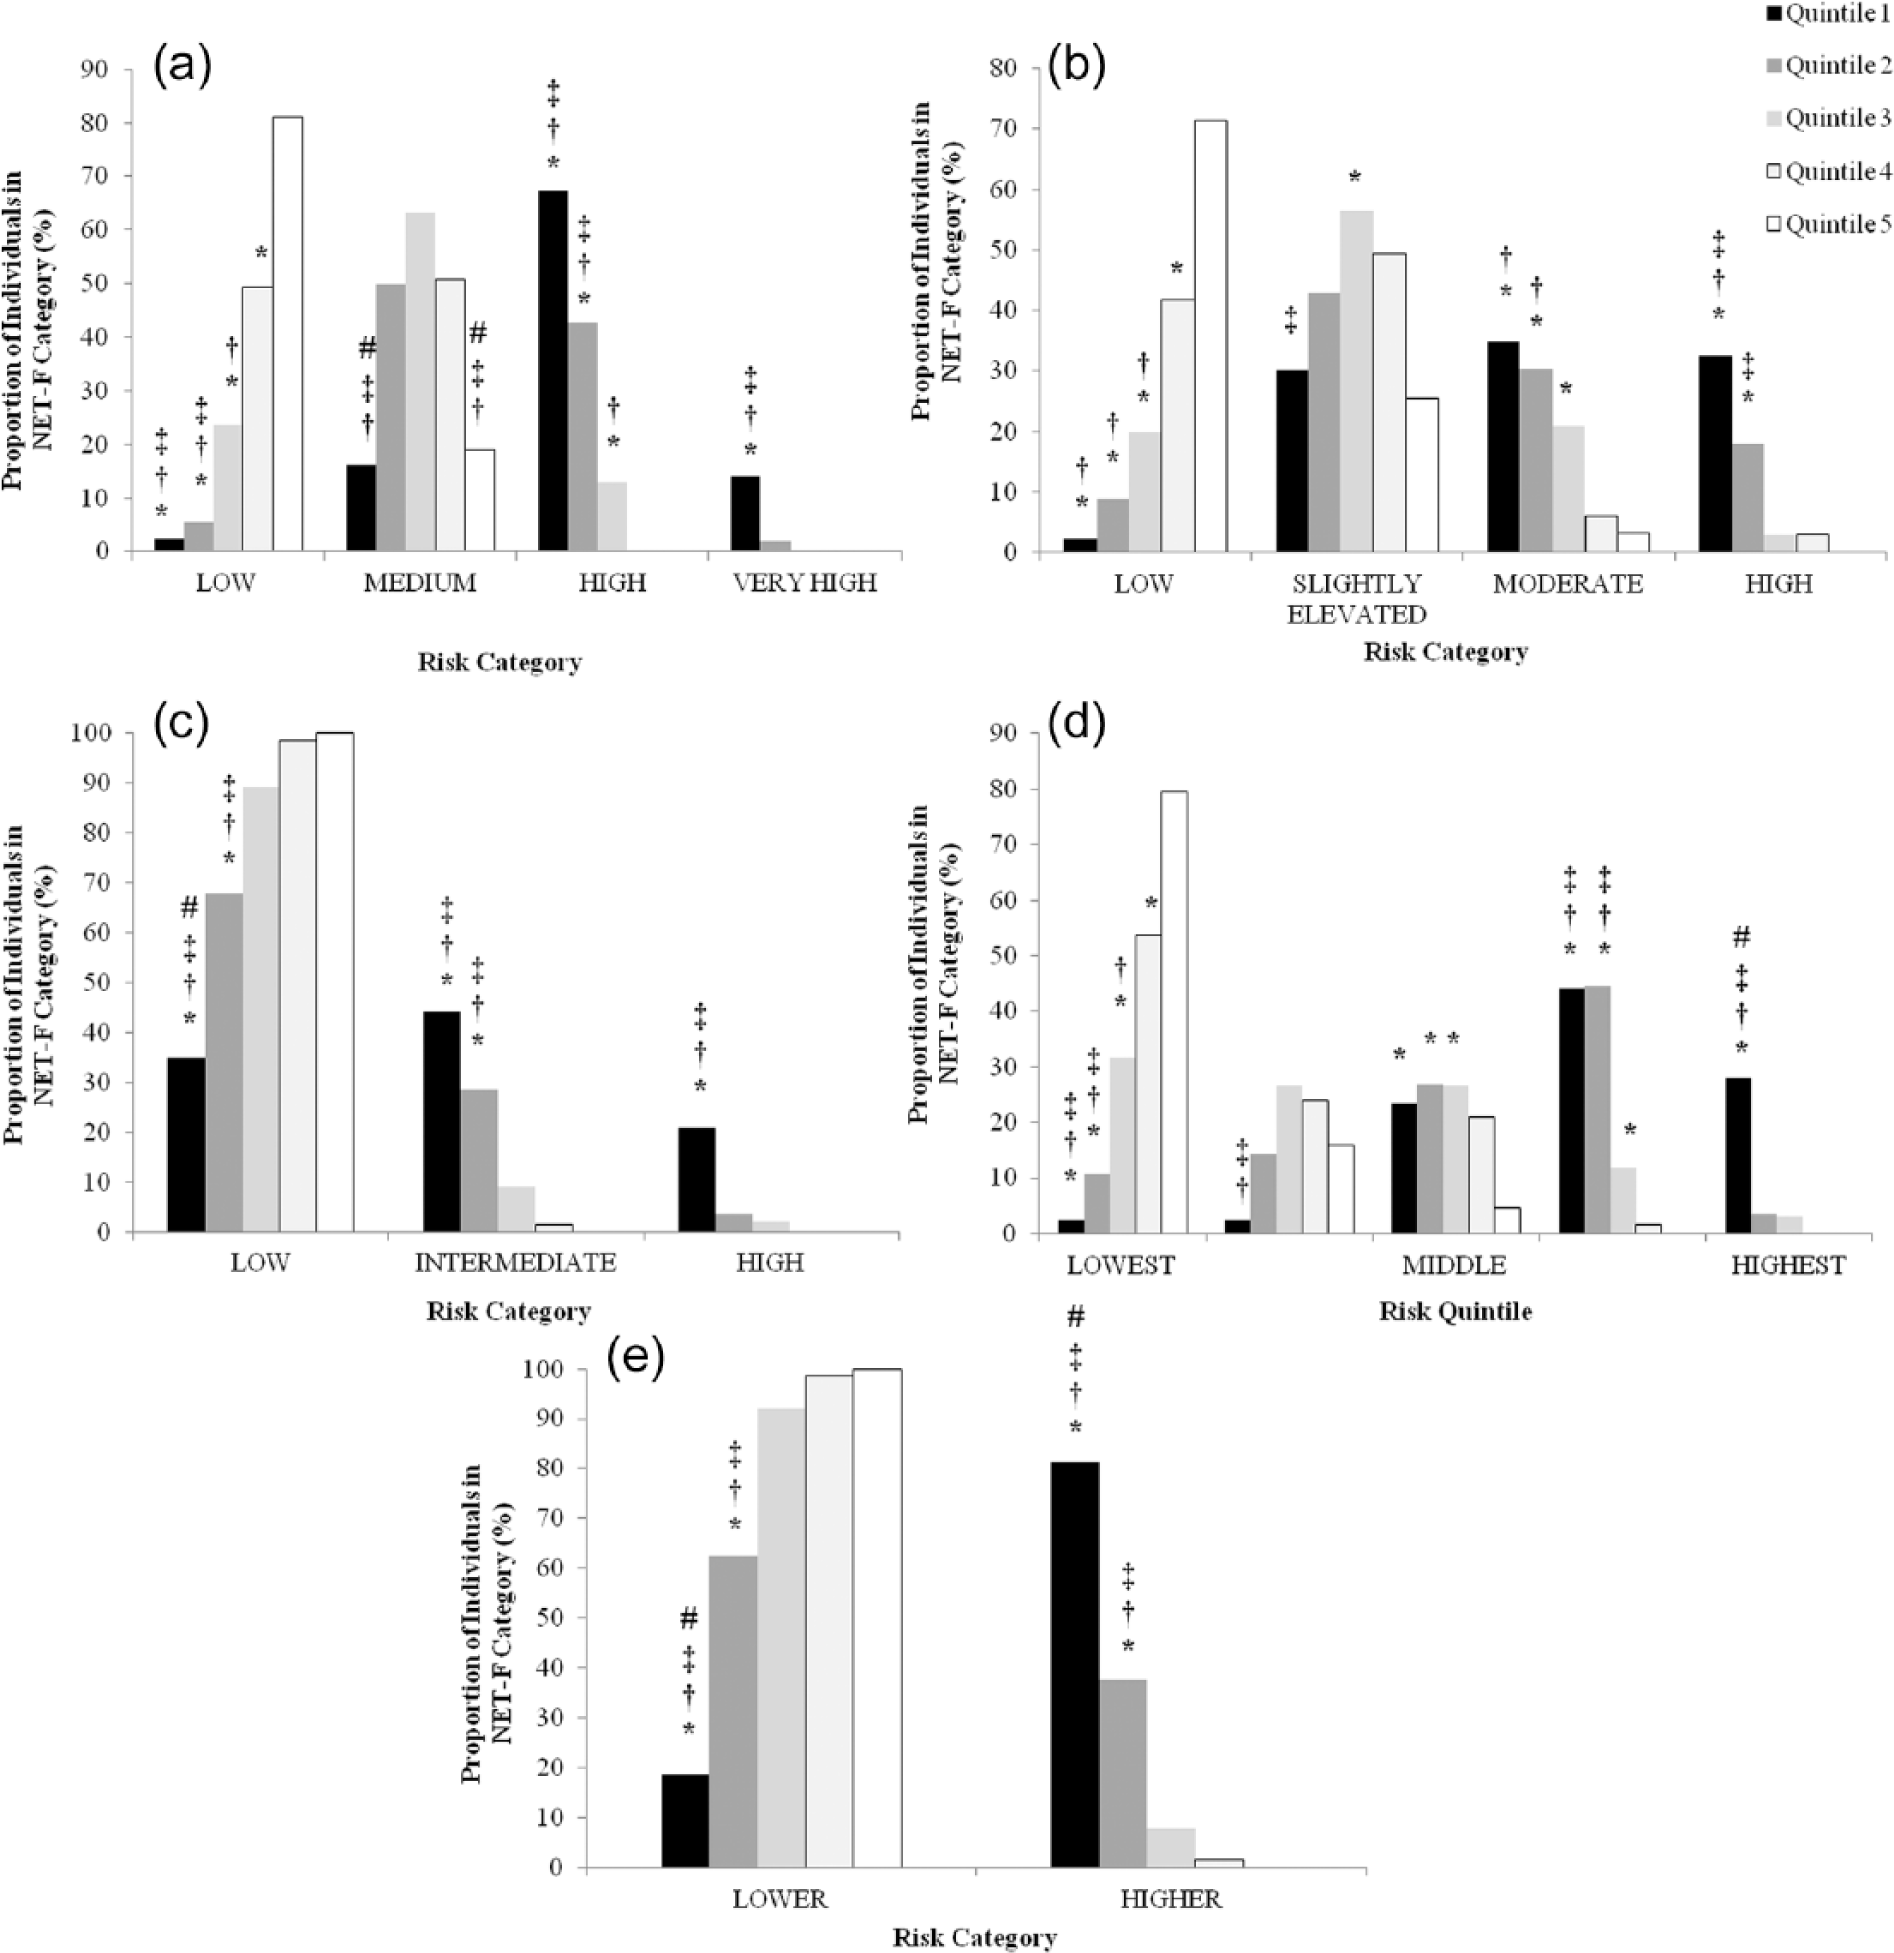
Proportions of individuals in each of the non-exercise testing cardiorespiratory fitness (NET-F) categories and corresponding risk categories/quintiles. Risk of developing type 2 diabetes assessed by the (a) Leicester Diabetes Risk Score, (b) FINDRISC, (c) QDiabetes, (d) Cambridge Risk Score and (e) ADA Risk Score assessments/questionnaires.
Discussion
This study examined the potential relationship(s) between CRF when calculated using a non-exercise method and the risk of T2DM as predicted by five risk assessments. An increase in NET-F value resulted in differences in diabetes-specific risk factors and consequently a decrease in risk prediction scores in each of the five risk assessments. Thus, individual NET-F values and risk prediction scores were all observed to be negatively correlated. In addition, a greater proportion of female individuals in the lowest NET-F quartile (Quintile 1) were predicted to be at ‘high risk’ compared to the four other NET-F quintiles (Quintiles 2–5).
One suggestion for the observed relationships between NET-F and diabetes risk prediction scores could be that the NET-F calculation and risk prediction models share at least three risk factors (age, gender and BMI), and this increases to four when considering self-reported physical activity is included in both the FINDRISC and ADA models. A significant risk factor included in the risk assessment models but not NET-F is positive family history of T2DM. There were no differences in positive family history between the five NET-F quintiles; however, risk prediction scores did change with increases in NET-F and, therefore, CRF. Thus, the observations in this study are reflective of those in the previous research conducted by Goodrich et al. 21 who concluded that being fit reduced T2DM risk, regardless of parental history. These observed negative relationships between individual NET-F and risk prediction scores are comparable to a similar investigation that objectively measured CRF and cardiometabolic risk prediction in males. 22
As previously discussed, the risk prediction models in this study were all developed for different clinical outcomes [10-year risk of T2DM, undiagnosed T2DM or undiagnosed impaired glucose regulation (IGR)]; however, we feel these are all indicative of T2DM risk. These subtle differences in clinical outcomes may offer some suggestion as to why varying proportions of females (20.9%–81.4%) were predicted at ‘high risk’ in the lowest NET-F quintile (Quintile 1). The observations also complement previous research which highlighted that different numbers of individuals were predicted at ‘high risk’ of T2DM depending on which risk assessment was used. 23 Regardless of clinical outcome, the identification of ‘high risk’ individuals by risk assessments is nationally recommended 13 and of paramount importance to prevent the development of T2DM. The clinical significance of this is demonstrated by a meta-analysis performed by Gillies et al. 24 which evidently showed that lifestyle and/or pharmacological interventions can prevent the development to T2DM in ‘high risk’ individuals. The determined ‘high risk’ individuals in these previous interventions were those with impaired glucose tolerance (IGT), a clinical population at an increased risk of developing T2DM compared to their normoglycaemic counterparts. 25
Existing research 7 alluded to the lack of guidance and/or consensus on interpreting CRF values as a barrier to the risk variable being fully utilised in clinical practice. Rather than introducing new CRF values to interpret, we used the same quintile thresholds that had been adopted previously which demonstrated the most accurate prediction of cardiovascular risk and mortality. 6 The findings of our study suggest that the same NET-F cut-off value that identified the greatest risk of CVD risk could also highlight those female individuals at ‘high risk’ of T2DM, as identified both by diabetes risk scores and in terms of HbA1c values. Therefore, an NET-F value of 6.8 METS or below would potentially identify females at risk of both CVD and T2DM. The clinical implications of CRF and the risk of T2DM are evidential2–5 and through the implementation of a simple measurement tool and threshold value, in this instance <6.8 METS, the significance of this relationship can possibly be utilised and transitioned into clinical practice. For example, this NET-F threshold value could aid in the identification of female individual models who can prevent their development of T2DM through lifestyle or pharmacological intervention12,13,24 without the need for consulting diabetes risk prediction models. The NET-F equations also provide an easy-to-calculate tangible value which could act as a possible motivator for those individuals engaged in a lifestyle intervention which includes physical activity.
We do recognise the apparent limitations of this study. The study is only focussed on females and the NET-F value of <6.8 METS would not likely be applicable to males; in all likelihood, the NET-F value in males would be higher. In addition, the cut-off value is only appropriate to CRF calculated using the NET-F equation; objectively measured CRF may result in a different cut-off value due to the standard error estimates between the two measures. With regards to ethnicity, the females in this study were all predominantly Caucasian and there is the possibility that the <6.8 METS value would not be relevant to Black and minority ethnic populations. However, there is an emerging suggestion that a ‘one size fits all’ threshold of CRF and physical activity in terms of cardiometabolic risk may not be the correct approach, and ethnic-specific guidelines are now required. 26 It should also be acknowledged that this study was cross-sectional in nature and not longitudinal; therefore, the findings from this study although interesting are observational. Further research is warranted to fully understand the role of NET-F in predicting T2DM, similar to the research undertaken by Artero et al. 10 examining CVD and NET-F algorithms.
In conclusion, this study provides a number of useful observations between NET-F and diabetes risk. An association was revealed between CRF calculated using a non-exercise method and diabetes-specific risk factors and risk prediction scores. There were also significant and negative correlations between individual increases in NET-F values and diabetes risk prediction scores. Furthermore, a NET-F cut-off value which had previously been demonstrated to indicate risk of CVD also revealed a substantial proportion of females predicted to be at ‘high risk’ by five diabetes risk assessment models. Thus, a NET-F value of <6.8 METS could identify female Caucasian individuals at ‘high risk’ of T2DM and who would reduce their risk of developing T2DM through lifestyle or pharmacological intervention.
Footnotes
Acknowledgements
The members of the Prosiect Sir Gâr Group are as follows: Kerry Morgan, Chris Cottrell, Vanessa Davies, Liz Newbury-Davies, Michael Thomas, Enzo M Di Battista, Lesley Street, Fiona Judd, Cindy Evans, Jo James, Claire Jones, Carolyn Williams, Susan Smith, James Thornton, Sally P Williams, Rhys Williams, Sam Rice, Jeffrey W Stephens and Meurig Williams.
Declaration of conflicting interests
Prosiect Sir Gâr received funding contributions from TATA Steel, Hywel Dda Health Board (Diabetes Charitable Fund and Carmarthenshire Charitable Fund), Carmarthenshire County Council and the following pharmaceutical companies: Takada, Lilly, Sanofi-Aventis, Boehringer-Ingelheim, Pfizer and AstraZeneca.
Funding
This work was partly funded by the European Social Fund (ESF) through the European Union’s Convergence programme administered by the Welsh Government.