
Abstract
Introduction
The dramatic increase in the incidence of type 2 diabetes mellitus (T2DM) is a significant burden on global healthcare. Patients who develop T2DM experience multiple co-morbidities, increased mortality, and have significantly higher healthcare costs compared with non-diabetic patients. 1 As part of the effort to slow the expansion of this disease, several studies have demonstrated that both pharmacological and lifestyle interventions significantly decrease development of diabetes. 2–4 Given the estimated 80 million adults 5 with ‘prediabetes’ in the United States alone, simple and accurate clinical tools are needed to focus limited healthcare resources on those patients with the highest risk for conversion to T2DM.
A variety of tests are available to assess diabetes risk. Glucose-based tests – fasting plasma glucose (FPG), oral glucose tolerance test (OGTT), and HbA1c – measure glycaemia in a fasting or postprandial state. These tests, though rapid and inexpensive, have well-known performance limitations. 6–8 Changes in glucose homeostasis occur relatively late in disease progression, and glucose alone does not reflect the complexity of metabolic disorders arising from a combination of unhealthy adiposity, reduced insulin sensitivity, impaired beta cell function, increased fatty acids, impaired incretin effects, abnormal glucagon, and inflammation. 9,10
Several clinical risk scores have been developed that use non-invasive clinical factors such as age, gender, weight, family history, and exercise habits. 11–13 Other risk indices use a combination of non-invasive clinical factors with fasting plasma glucose and other routine laboratory measures. 14–16 We hypothesise that a risk prediction tool relying primarily on measurements from fasting blood specimens, incorporating markers from multiple aetiopathological pathways, would combine accurate risk prediction with the convenience of a routine clinical blood test.
In a previous investigation of the Inter99 study, we identified biomarkers predictive of diabetes risk, 17,18 and developed a Diabetes Risk Score (DRS) that assesses five-year risk of incident T2DM. The current work was undertaken to validate the clinical performance of the DRS in an independent cohort – the Botnia study 19 – in order to establish the DRS as a potential tool for identifying individuals at risk of T2DM development.
Research design and methods
Inter99 is a randomised non-pharmacological intervention trial for the reduction of cardiovascular disease in subjects, aged 30–60 years, from 11 municipalities in Copenhagen, Denmark. The study included lifestyle counselling on smoking cessation, physical activity, and diet. The five-year rate of progression to T2DM was 4.4% in the Inter99 cohort where five years of follow up was available.
The number of subjects participating in the baseline examination was 6784. 20 After five years, 4689 (69%) took part in a subsequent assessment. Fasting blood specimens, data on lifestyle factors, blood pressure, waist circumference, plasma lipids, fasting plasma glucose (FPG), and OGTT were available from baseline and five-year time points. Of 6380 subjects free of diabetes at baseline who participated in the Inter99 study, 215 subjects progressed to diabetes (converters) during five years of follow-up. A nested case-control study was performed using available serum samples from 202 converters and 597 randomly selected non-converters to develop and train the algorithm. 18
The Botnia prospective study enrolled 2770 individuals, mostly from families with a history of T2DM, to identify genes that increase risk of developing T2DM. 19 An OGTT was performed at baseline and every two to three years. Diabetes outcome with biomarkers measurements was available for 2350 subjects (1799 with at least five years of follow up). Among these, the rate of conversion to T2DM was 3.0% at five years (54 out of 1799), and 5.8% overall (136 out of 2350; median follow-up of 7.0 years).
For both the Inter99 and Botnia cohorts, the diagnosis of T2DM was based on the 1997 American Diabetes Association criteria utilising FPG ≥ 7.0 mmol/L or 2-h glucose ≥ 11.1 mmol/L during an OGTT. In addition, the designations of glucose status were based on American Diabetes Association criteria for normal fasting glucose (NFG, < 5.6 mmol/L), impaired fasting glucose (IFG, 5.6–6.9 mmol/L), normal glucose tolerance (NGT, 2-h glucose, < 7.8 mmol/L), and impaired glucose tolerance (IGT, 2-h glucose, 7.8–11.1 mmol/L). 21 Demographic and clinical differences were compared in both cohorts for converters and non-converters using a Wilcoxon rank-sum test (Table 1).
Baseline clinical characteristics and biomarker levels of study populations
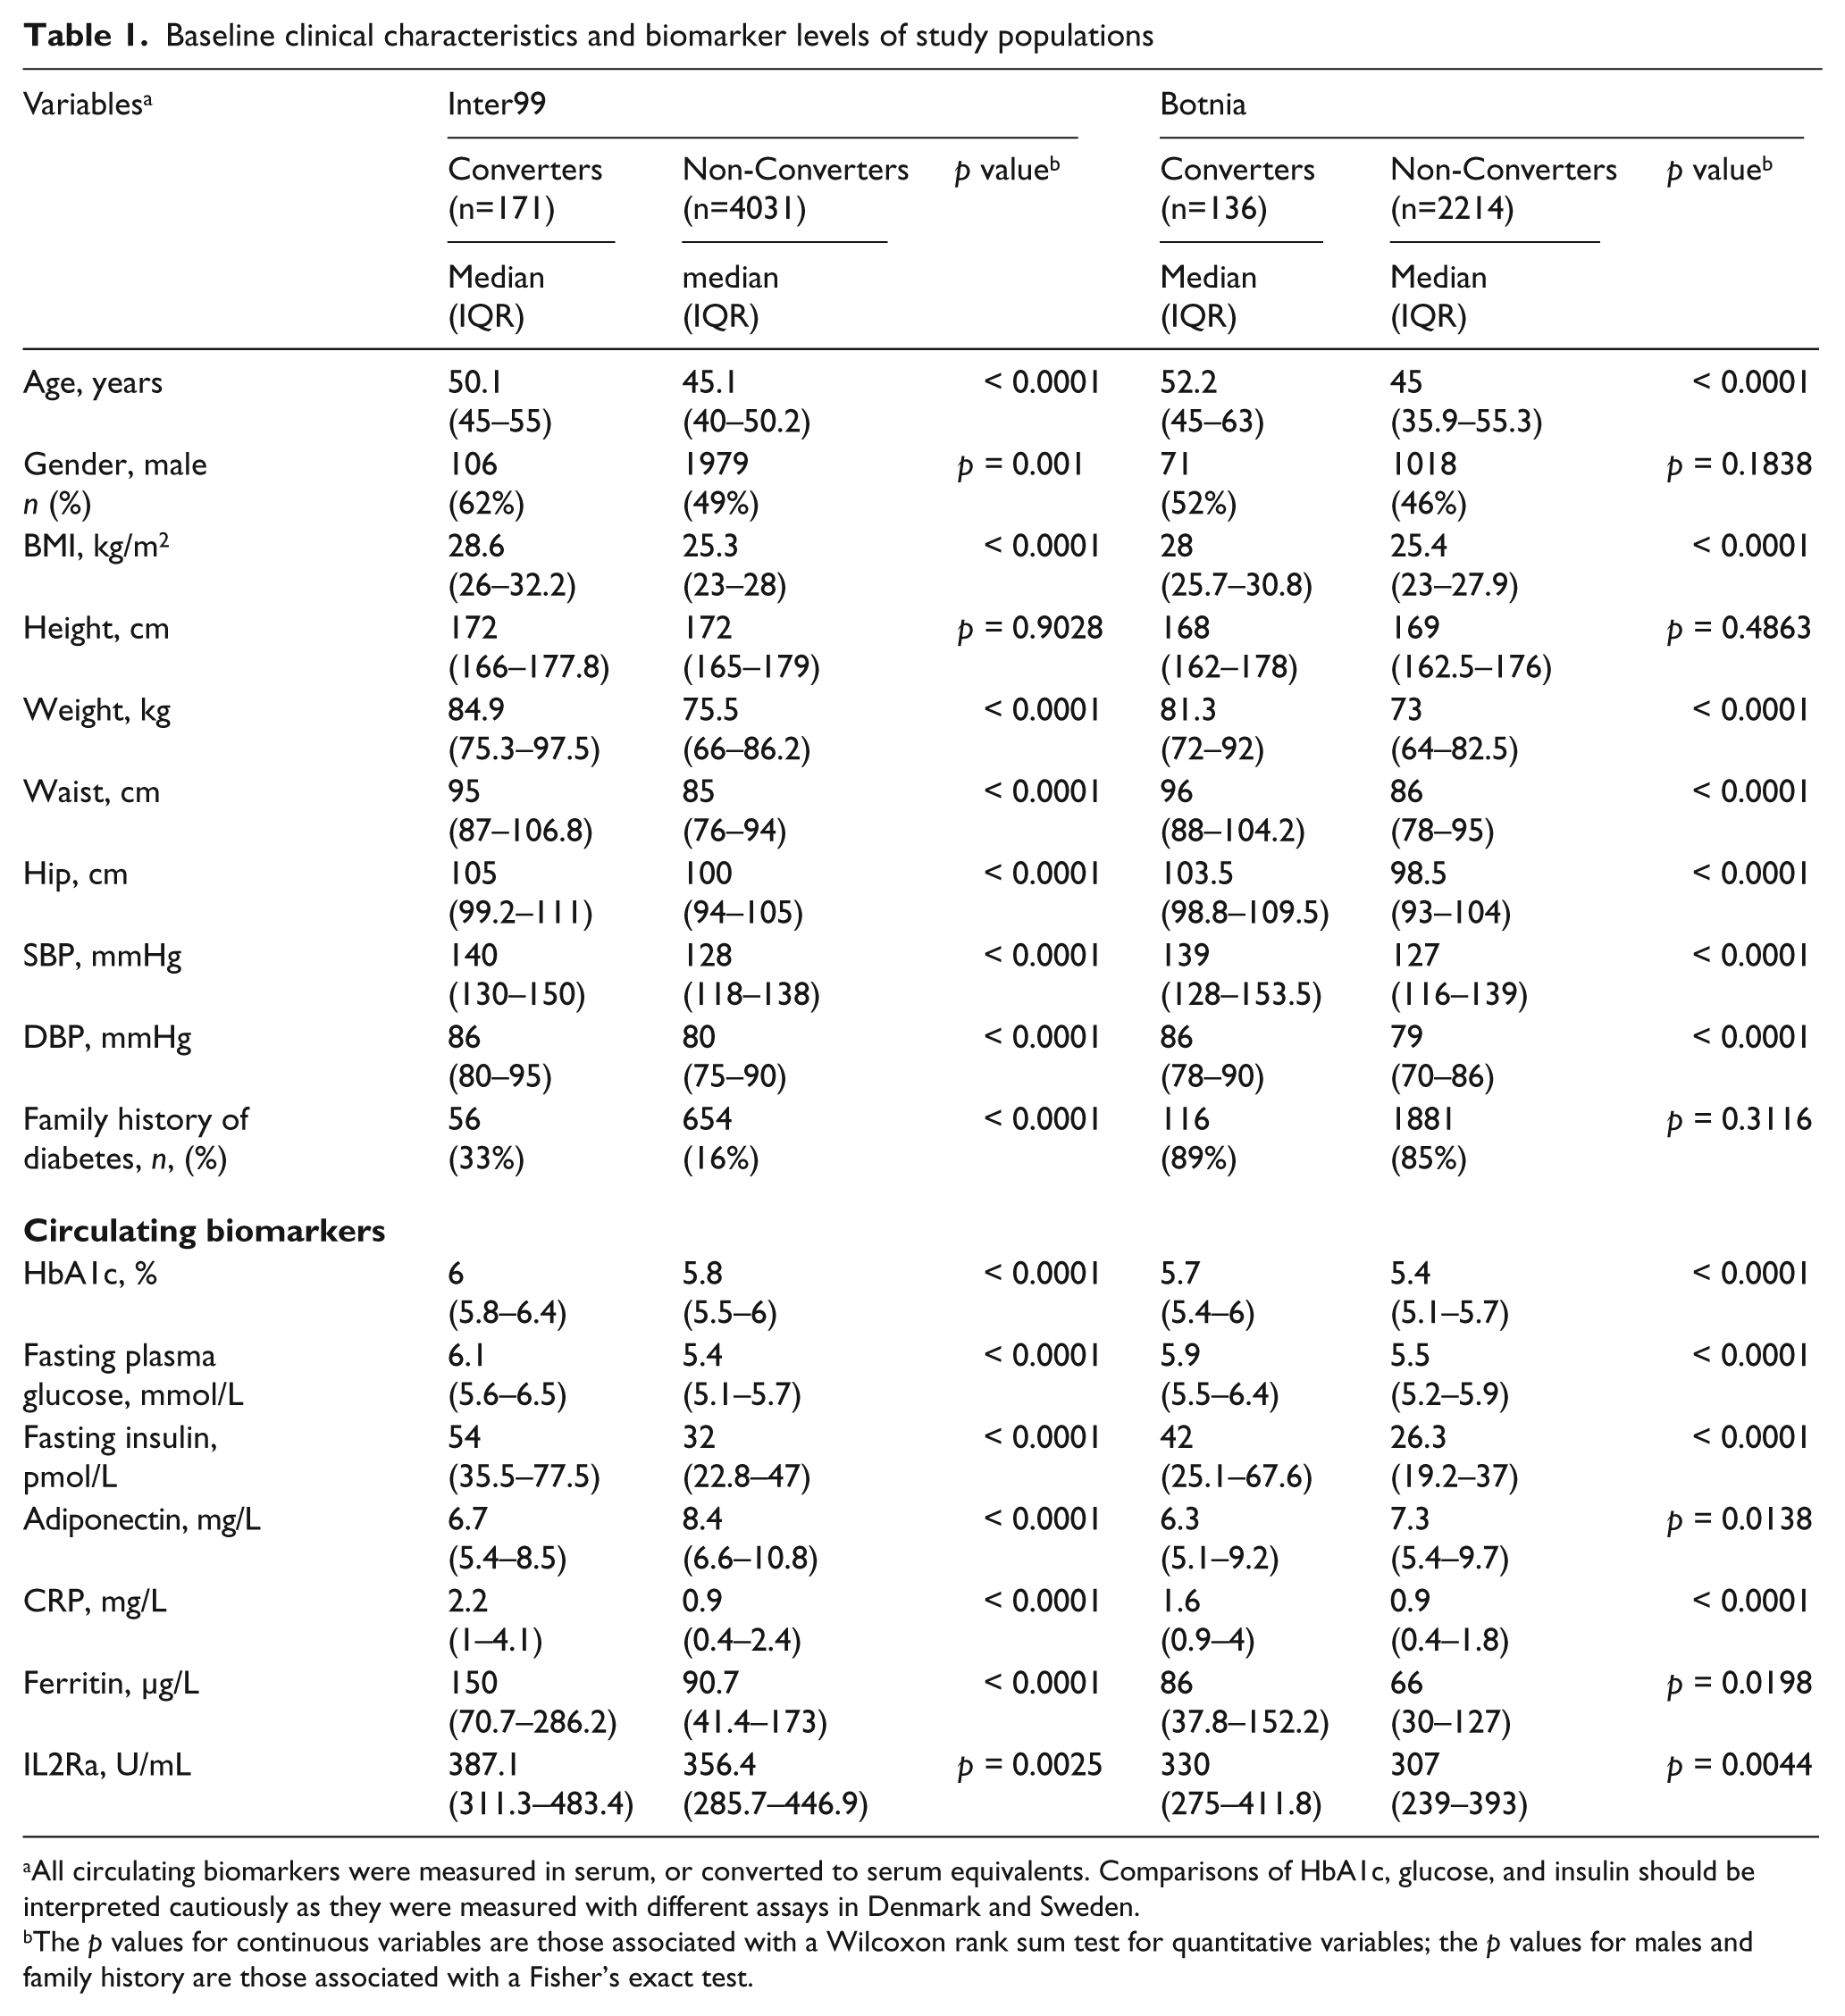
All circulating biomarkers were measured in serum, or converted to serum equivalents. Comparisons of HbA1c, glucose, and insulin should be interpreted cautiously as they were measured with different assays in Denmark and Sweden.
The p values for continuous variables are those associated with a Wilcoxon rank sum test for quantitative variables; the p values for males and family history are those associated with a Fisher’s exact test.
Laboratory measures
In both studies, anthropometric measurements, routine clinical measures, and the OGTT were performed as previously described. 19,20 Specimens were stored at -19°C. Protein biomarkers were measured in baseline specimens using assays developed for use in a clinical laboratory. Adiponectin (ADIPOQ) was measured with a sandwich enzyme-linked immunosorbent assay, C-reactive protein (CRP) was measured with an immuno-turbidometric assay, ferritin and interleukin-2 receptor alpha (IL2Ra) were measured with a solid-phase, two-site chemiluminescent immunometric assay. 18
Model performance
The DRS was originally developed using one half of the available converters in a classic testing set – validation set study design. 18 This score without any adjustment was calculated for the entire Inter99 cohort for which baseline samples were available and subjects from the Botnia cohort. A score of 5 corresponds to the mean population risk. Absolute five-year risk of conversion may be calculated from the DRS as described in the Supplemental Materials of Kolberg et al. 17
Missing data ranged from 0% to 4.8% of assessments, with the exceptions of 2-h insulin and HbA1c, which were missing in 9% and 28% of Botnia subjects, respectively. Missing values were imputed using Harrell’s Additive Regression function (Hmisc: Harrell Miscellaneous. R package version 3.4-3). Calibration and discrimination metrics showed that the imputed data added little or no bias (data not shown). All circulating biomarker concentrations were log transformed to improve the distributional properties. Discrimination was estimated for the DRS and FPG in both the Botnia and Inter99 populations using the AUC (Figure 1(a)) and differences between the DRS and FPG were tested using the methods of DeLong et al. 23 Model calibration was evaluated both graphically and statistically for the DRS, Framingham diabetes risk score 15 and San Antonio Heart risk score 14 in the Botnia cohort. Graphical evaluation involved plotting the observed risk and mean predicted risk in quintiles of the data (Figure 1(b)). Statistical evaluation was accomplished using a Hosmer–Lemeshow goodness of fit test. 24
The Botnia data set was then used to compare the DRS with clinical models from the San Antonio Heart Study 14 and the Framingham Offspring Study, 15 homeostasis model assessment of insulin resistance (HOMA-IR) derived from fasting insulin and glucose (http://www.dtu.ox.ac.uk/homacalculator/index.php), 2-h glucose, peripheral biomarkers (cholesterol, HDL, and triglycerides) and non-invasive risk factors (BMI, waist, and blood pressure) in Table 2. Logistic regression models were developed for the DRS and each of these predictors alone or in combination with the DRS. All model inputs were converted to standard scores prior to analysis and standardised odds ratios were estimated for each predictor as either a univariate marker or after controlling for variation explained by the DRS. Model discrimination was estimated by the AUC of each predictor alone or in combination with the DRS. Incremental improvement of the DRS in combination with all the predictors was also estimated. These analyses were performed using five-year outcomes where converters had to convert within five years or were considered non-converters, and non-converters had to have at least five years of follow-up or they were removed from the data set (54 converters and 1745 non-converters).
In order to determine the relationship between diabetes risk and time to conversion, Botnia subjects were assigned to high (≥ 8.0), moderate (≥ 4.5 to < 8.0), or low (< 4.5) risk strata based on their DRS and diabetes risk was estimated from Kaplan–Meier survival curves. Differences among the curves were compared with a log-rank test and hazard ratios were estimated from a Cox proportional hazard model (Figure 2).
Clinical reclassification
In order to assess how this new risk assessment tool impacts clinical practice, we compared the classification of subjects by DRS to classification using standard fasting glucose and oral glucose tolerance categories in combination (Table 3). Because the number of five-year converters was small (n = 54), we considered all subjects who converted during the study (n = 136; median conversion time 5.5 years) to be converters and defined non-converters as those subjects who did not show evidence of conversion during the study and were followed for at least five years (n = 1663). Subjects with NFG were defined as low baseline risk; moderate and high-risk groups were defined as IFG/NGT and IFG/IGT respectively. The proportions of participants in the Botnia population who were reclassified into either higher or lower risk categories by the DRS were calculated. Net reclassification improvement (NRI) was estimated according the methods of Pencina et al. 25 The significance of the NRI estimate was calculated by permutation testing, counting the number of 10,000 permutations of model outputs that had greater NRI estimates than the comparison in question. All analyses were conducted using R V 2.12.1 (R Foundation for Statistical Computing, Vienna, Austria).
Results
The DRS was developed on the Inter99 cohort and validated in the Botnia cohort based on five years of follow-up data. For both cohorts, every variable except height is significantly different between converters and non-converters (Table 1), though gender and family history show differences in Inter99 only. Among the circulating biomarkers, all are significantly different in both cohorts between converters and non-converters. Median values and directions of change between converters and non-converters for each variable are largely consistent between the cohorts. The most striking difference between Inter99 and Botnia is the fraction of subjects with a family history of diabetes, which is expected given that Inter99 is a random population sample while Botnia is, in large part, a family-based study.
Figure 1(a) compares the ROC curves of the DRS for assessing risk of conversion to T2DM in the Inter99 cohort (AUC = 0.84) and in the Botnia cohort (AUC = 0.78). The AUC values for FPG are significantly less in both populations and are shown in both cohorts for comparison. This observation validates the performance of the DRS algorithm in a second population.
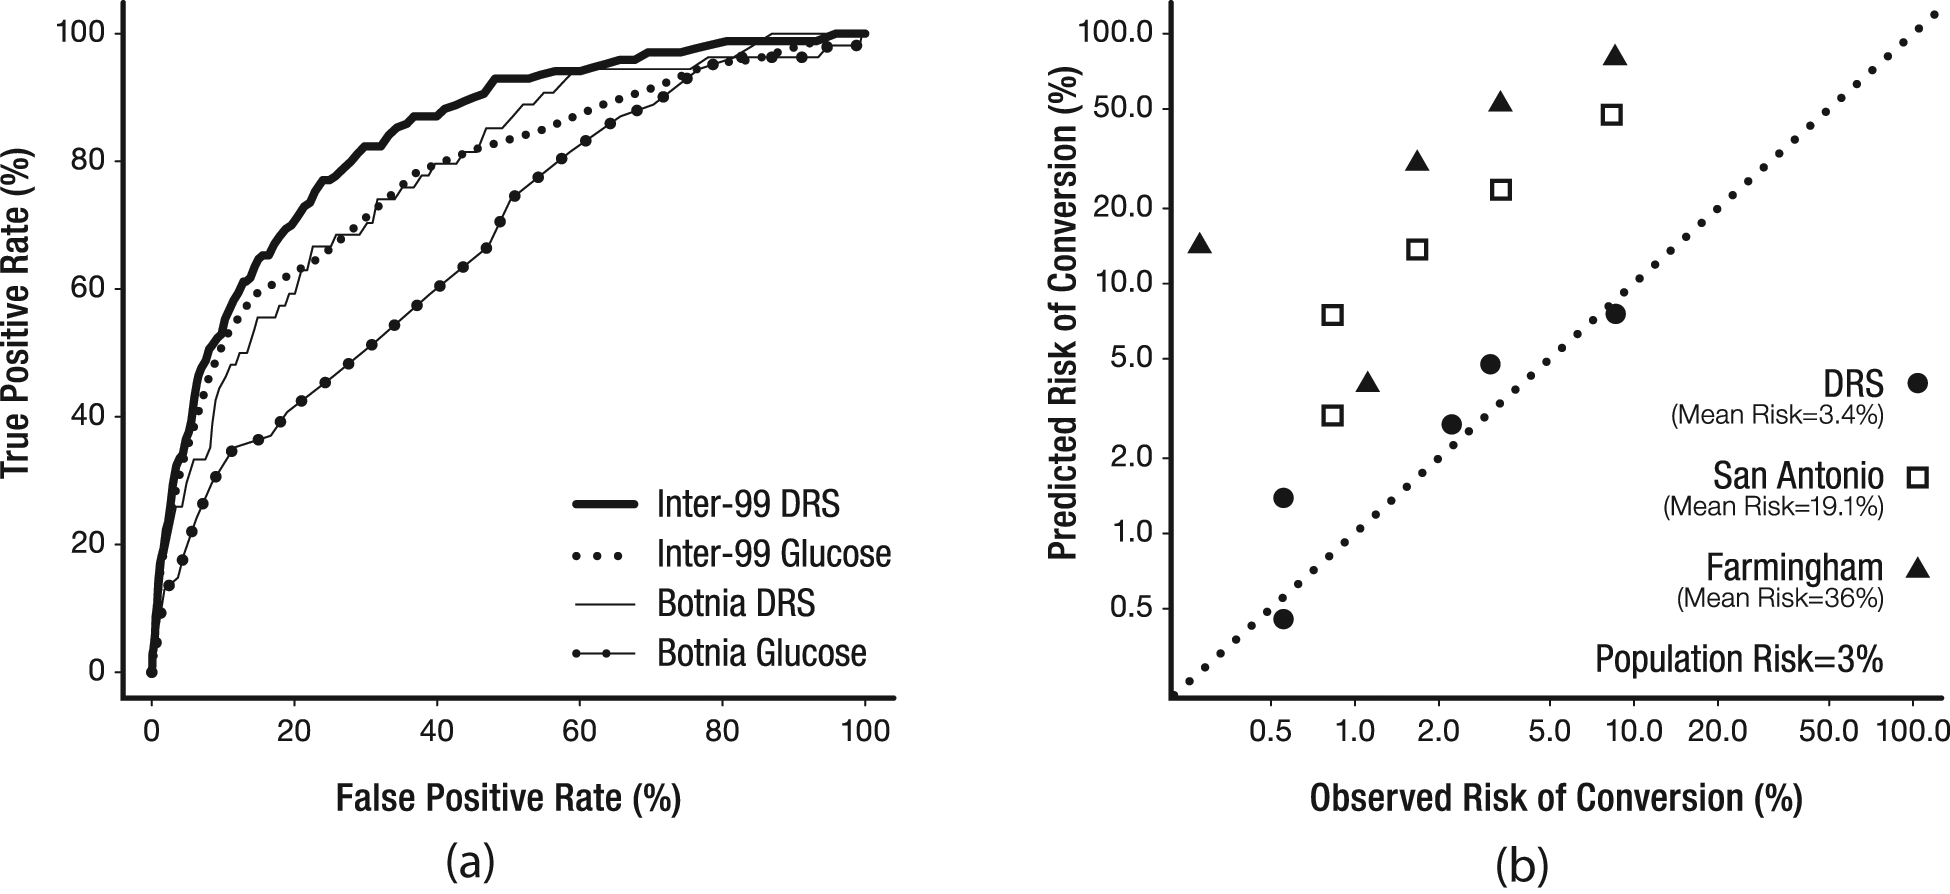
Performance characteristics of the DRS. (a) Receiver operating characteristic (ROC) curves demonstrate the performance of the Diabetes Risk Score (DRS) to identify incident diabetes within five years in the Inter99 and Botnia cohorts. The area under the curve (AUC) for the DRS was 0.84 in the Inter99 cohort and 0.78 in the Botnia cohort. For comparison, the ROC curves of fasting plasma glucose (FPG) are plotted for both studies. The AUC for FPG in Inter99 is 0.78 and in Botnia the AUC for FPG is 0.67. (b) Calibration curves of the DRS, the San Antonio Heart risk score 14 and the Framingham diabetes risk score. 15 In this graph, the predicted risk of each quintile of the population is plotted versus the observed risk in each quintile. The dashed line represents perfect calibration.
Comparison of DRS performance with other risk assessment methods
Figure 1(b) compares the calibration of the DRS with two established clinical risk scores. The DRS slightly overestimates risk in the Botnia cohort by 10% (mean predicted risk = 3.4%, versus a population prior of 3.0%). As shown in Figure 1(b), overestimation of risk is larger with the San Antonio Heart risk score and the Framingham diabetes risk score, which have mean predicted risks of 19% and 36% in this population, respectively. Hosmer–Lemeshow is not significant (p = 0.23) for DRS, but was highly significant (p < 0.0001) for both Framingham and San Antonio Heart indices.
The DRS was compared with other predictors of diabetes risk, including multivariate risk models and scores, individual peripheral biomarkers, and non-invasive risk factors (Table 2). For each predictor, the standardised odds ratio (sOR) and AUC is calculated alone and with the DRS. By sOR, the DRS is superior to all the other predictors and none of the other predictors have a greater AUC than the DRS. Furthermore, adding individual predictors to the DRS to create a composite model reduces the predictability of these markers as evidenced by a reduced odds ratio when modelled with the DRS. In addition, a likelihood ratio test of the univariate marker model to a bivariate model with the marker and the DRS shows that the DRS adds significant value to each of the other predictors. In terms of AUC, these predictors generally fail to improve discrimination when added to DRS. The only exceptions are HOMA-IR (p = 0.035, ΔAUC = 0.024) and BMI (p = 0.02 ΔAUC = 0.026), although 2-h glucose (p = 0.054, ΔAUC = 0.046) and waist circumference (p = 0.059, ΔAUC = 0.023) were marginal and do significantly improve the fit of a bivariate model with DRS (likelihood ratio test, p < 0.0001) along with blood pressure (p < 0.05).
Comparison of risk factor performance
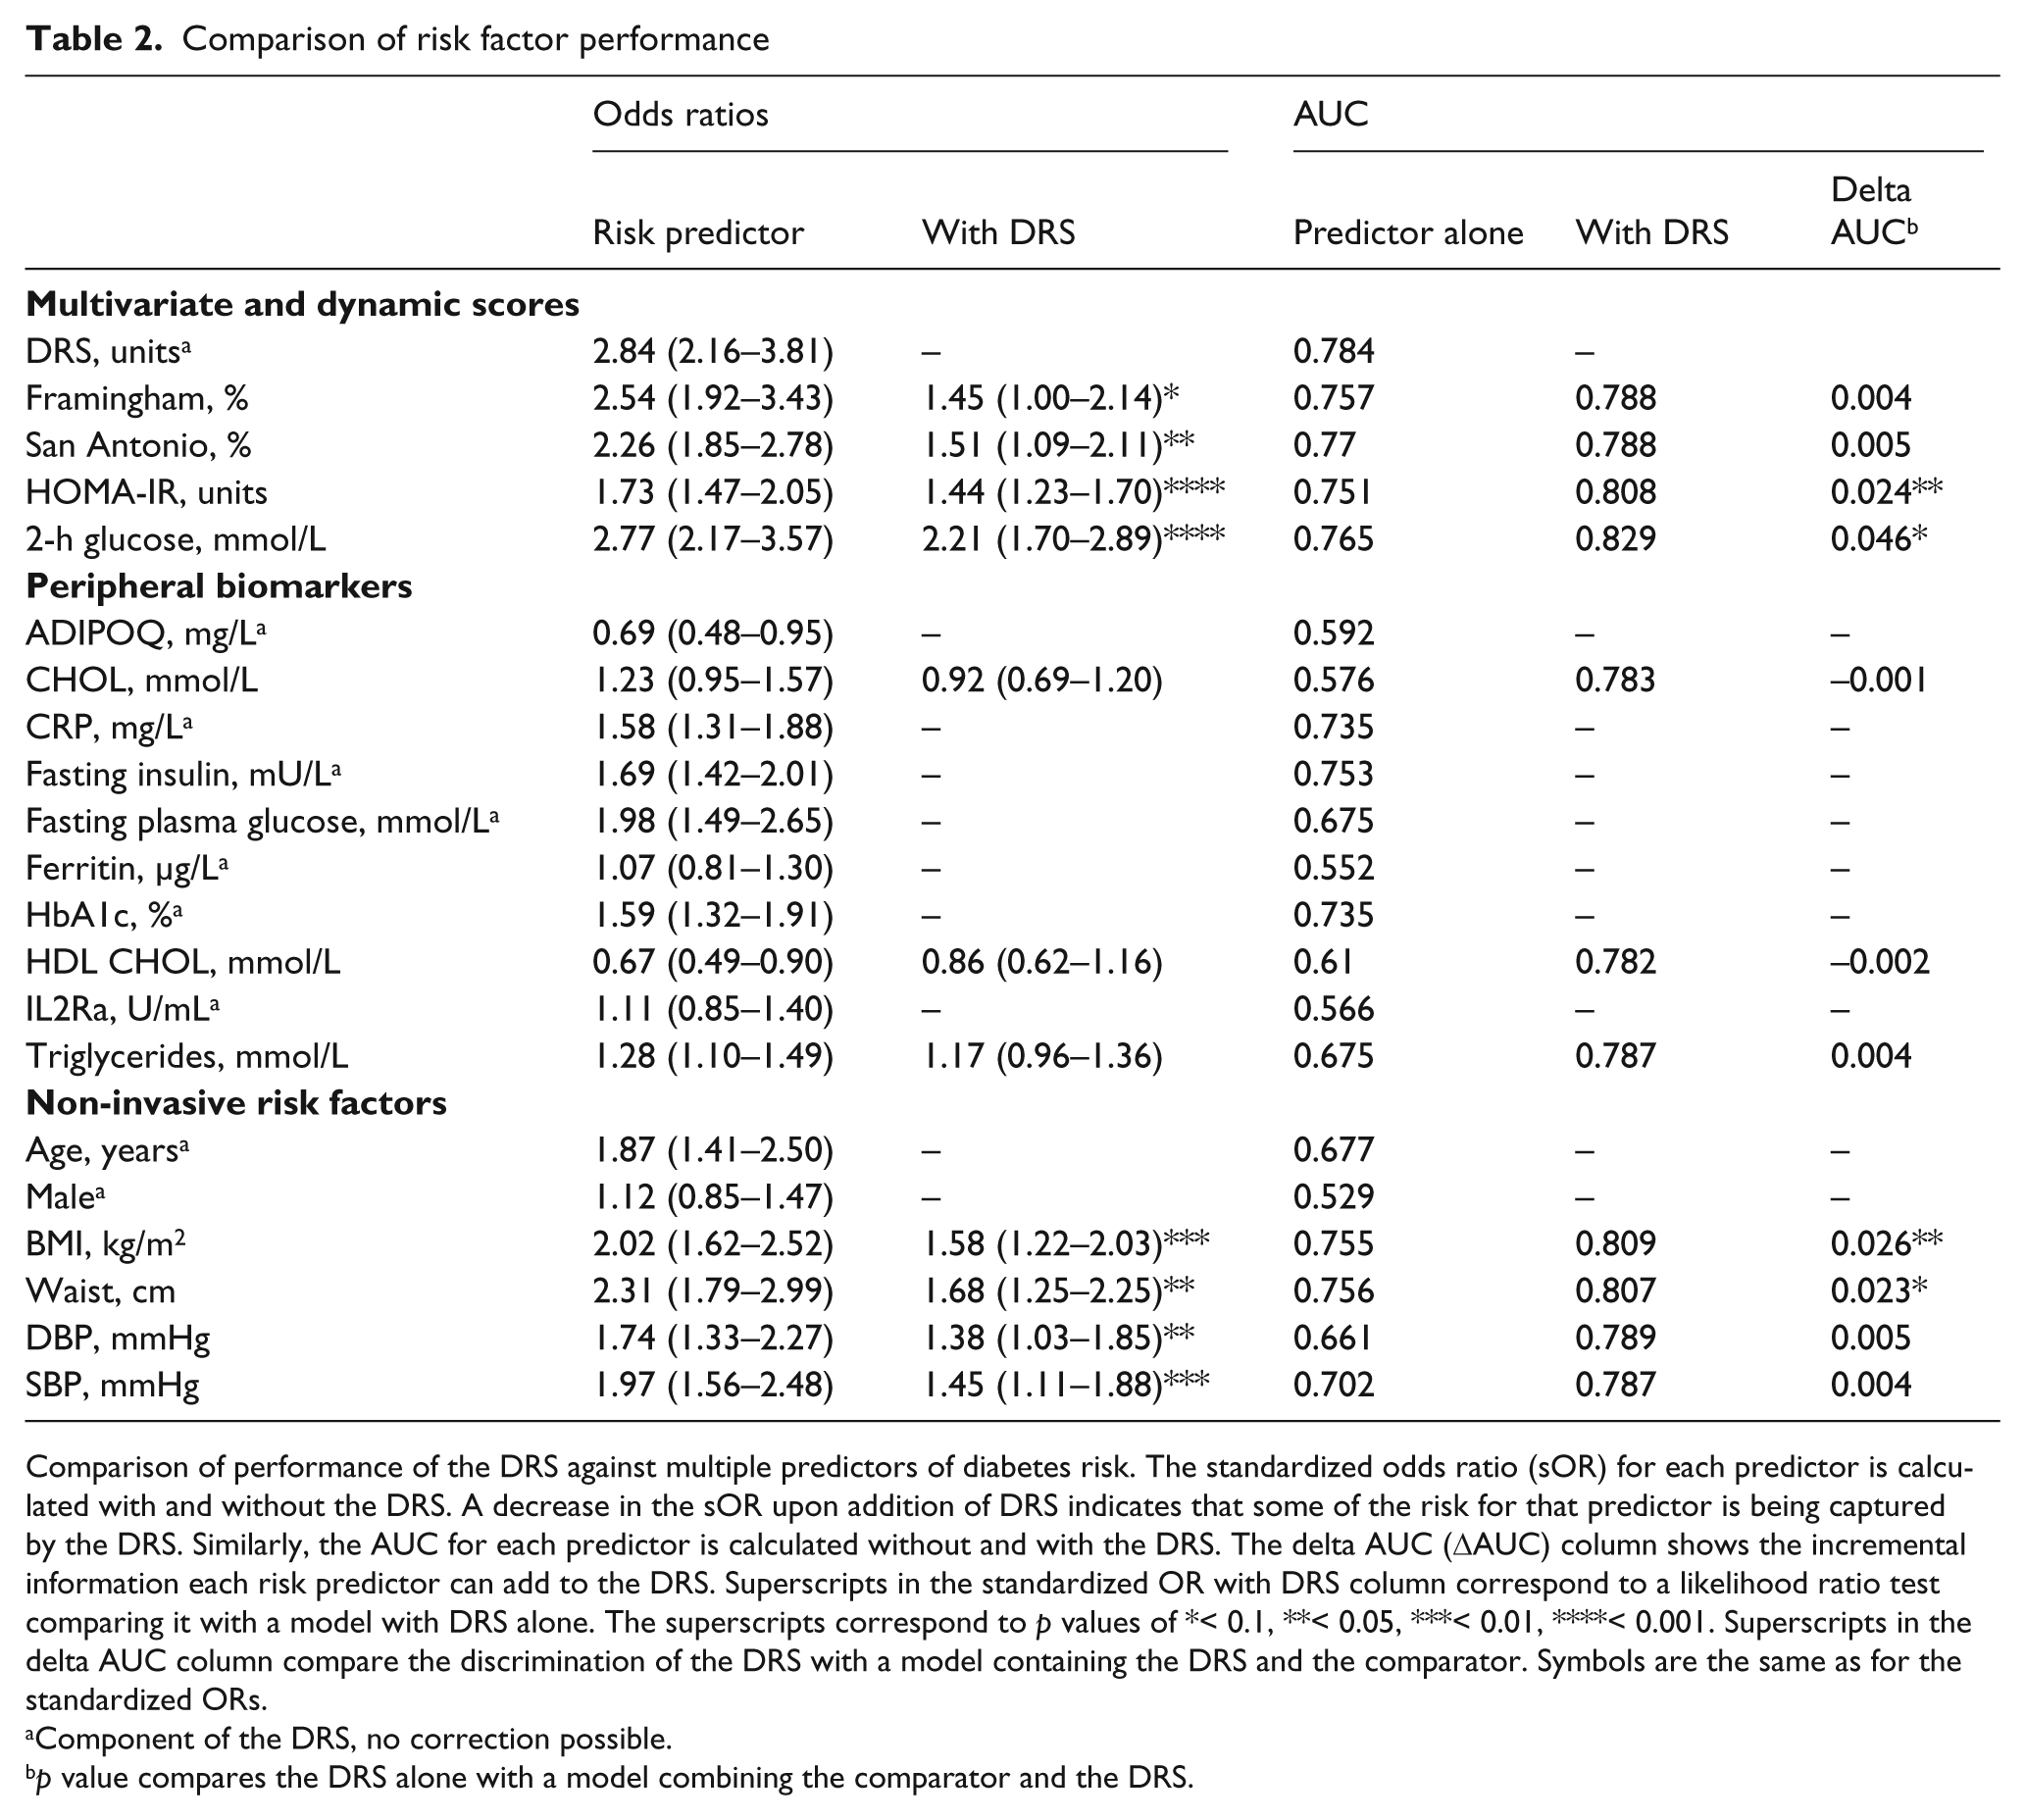
Comparison of performance of the DRS against multiple predictors of diabetes risk. The standardized odds ratio (sOR) for each predictor is calculated with and without the DRS. A decrease in the sOR upon addition of DRS indicates that some of the risk for that predictor is being captured by the DRS. Similarly, the AUC for each predictor is calculated without and with the DRS. The delta AUC (DAUC) column shows the incremental information each risk predictor can add to the DRS. Superscripts in the standardized OR with DRS column correspond to a likelihood ratio test comparing it with a model with DRS alone. The superscripts correspond to p values of *< 0.1, **< 0.05, ***< 0.01, ****< 0.001. Superscripts in the delta AUC column compare the discrimination of the DRS with a model containing the DRS and the comparator. Symbols are the same as for the standardized ORs.
Component of the DRS, no correction possible.
p value compares the DRS alone with a model combining the comparator and the DRS.
Long-term risk prediction
Figure 2 presents a Kaplan-Meier plot for subjects classified as high (≥ 8), moderate (≥ 4.5 and < 8.0), or low (< 4.5) risk by DRS using previously defined thresholds. 18 The five-year risk of diabetes for the low, moderate, and high risk groups is 1.1% (95% CI: 0.5–1.6%), 4.0% (2.3–5.7%), and 12.7% (7.0–18.1%), respectively. Although the DRS was designed on a five-year outcome study these risks continue to diverge and at 15 years the Kaplan–Meier estimates are 14% (0.1–26%), 23.3% (13.9–31.7%) and 59.8% (30.3–76.8%), respectively. The difference between the conversion rates among the groups is highly significant (p < 0.0001).
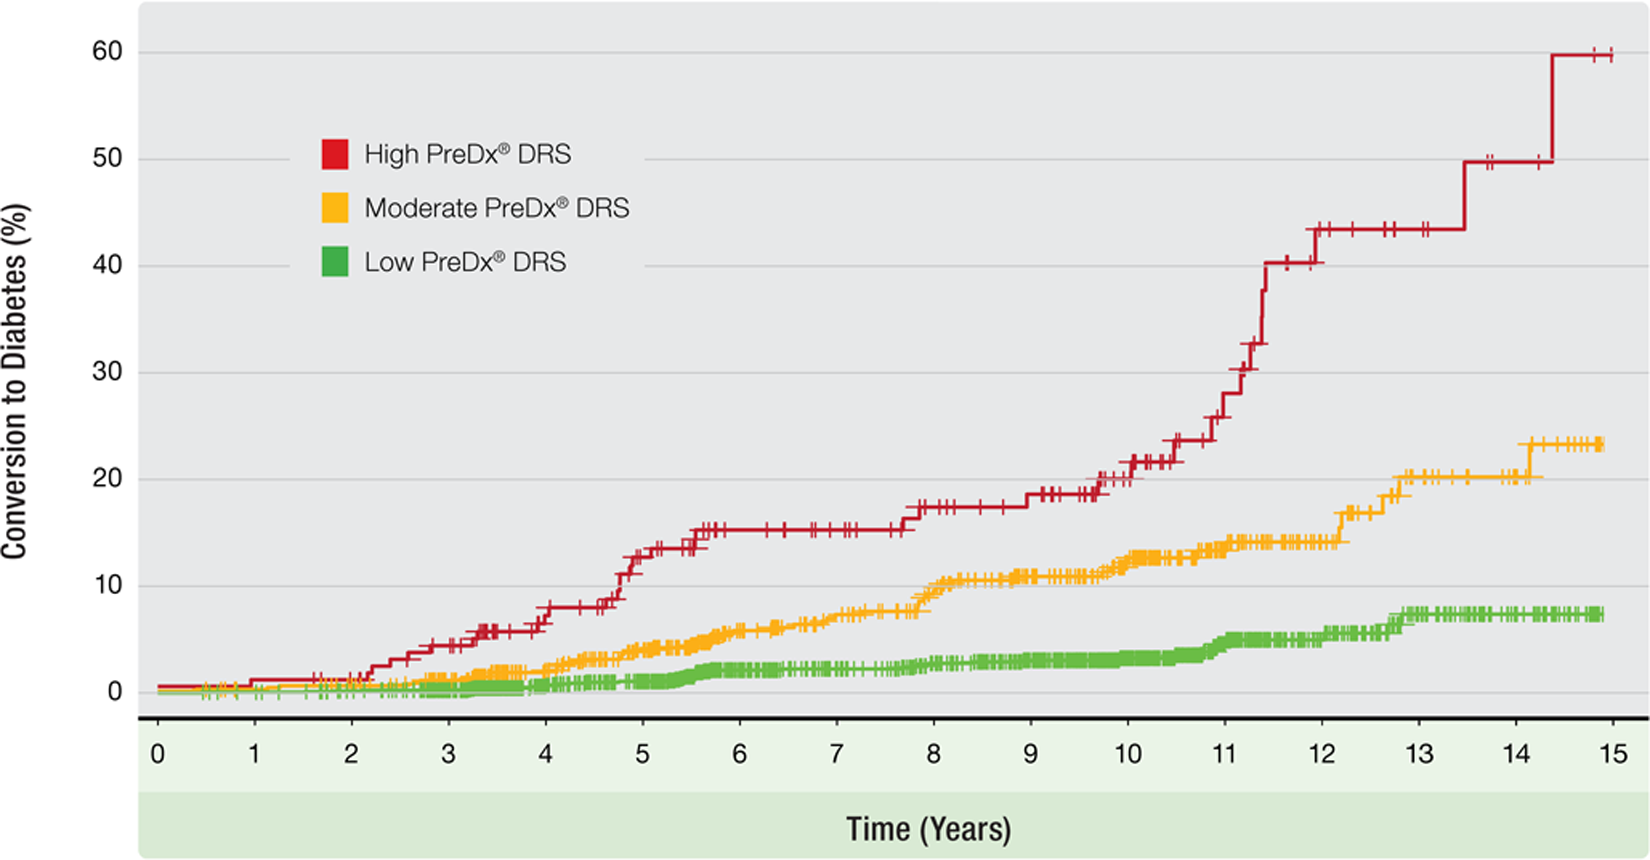
Kaplan–Meier plot of the Botnia cohort based on DRS risk category. The Botnia cohort was categorised into high, moderate and low-risk groups using the DRS. The plot shows cumulative diabetic events over a period up to 15 years. The incidence for the high-risk group at five years is drawn as a horizontal line. The difference between the conversion rates of the groups is highly significant (χ2=115; 2 df; p < 0.0001).
Reclassification analysis
Reclassification analysis was used to compare the clinical utility of glucose status (using fasting glucose and OGTT) with the DRS (Table 3). Subjects were categorised into low (NFG), moderate (IFG/NGT), and high (IFG/IGT) risk groups based on glucose test results. DRS results were used to reclassify subjects into low, moderate, and high-risk categories using the previously defined thresholds. The overall NRI of 0.20 indicates that the DRS provides more accurate clinical classification than the combined performance of FPG and OGTT (p = 0.0001). This improvement in reclassification is due entirely to accurately reducing the perceived risk of true non-converters (NRI for the non-converters = 0.22, p = 0.0001), the two tests are equal in the ability to identify converters (NRI for the converters = −0.02, p > 0.9999). It should be noted that there is more than an eight-fold difference in risk between high-risk DRS and low-risk DRS (29.4% vs. 3.6%), while difference in risk between IFG/IGT and NFG is only 4.6-fold (22.6% vs. 4.9%).
Risk reclassification in the Botnia cohort comparing the DRS model with glucose measures
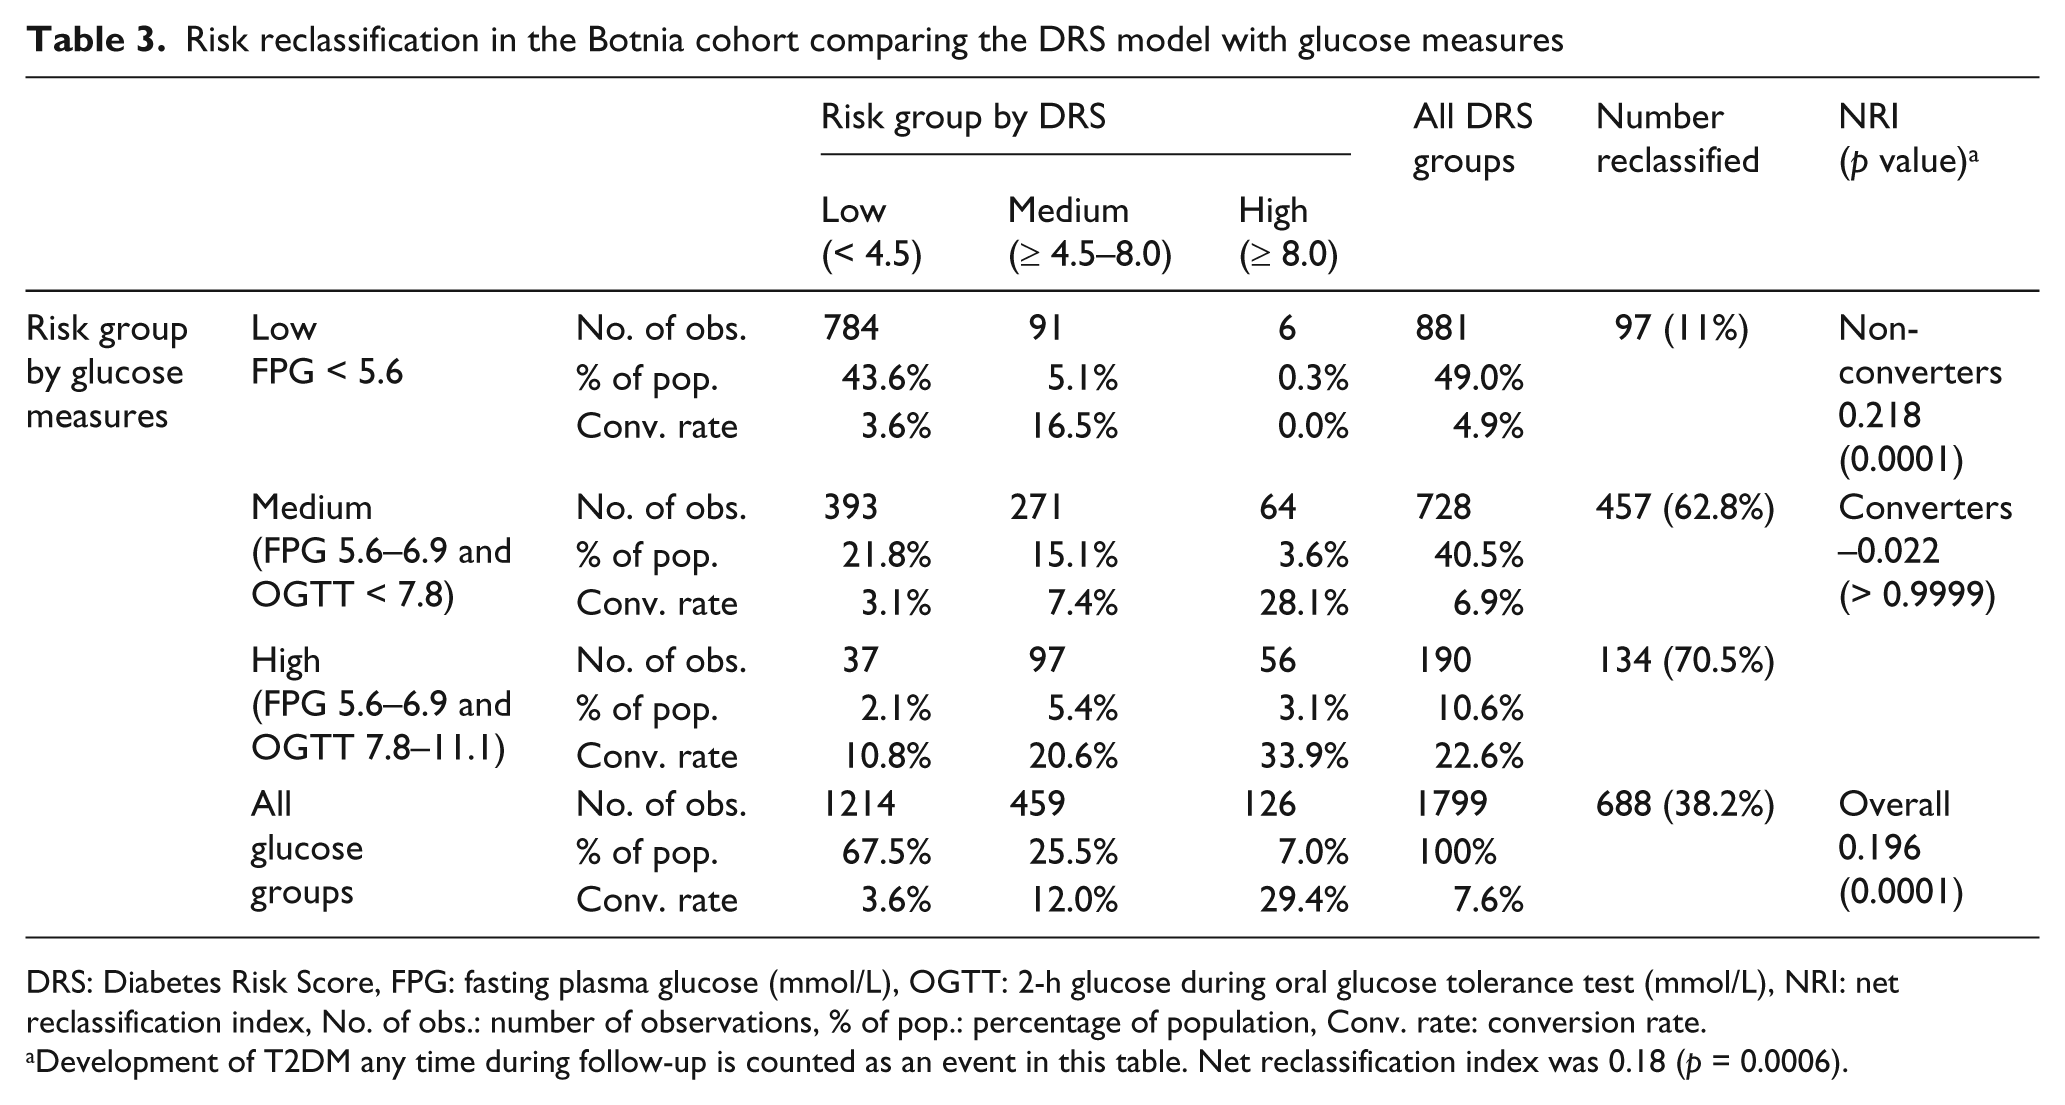
DRS: Diabetes Risk Score, FPG: fasting plasma glucose (mmol/L), OGTT: 2-h glucose during oral glucose tolerance test (mmol/L), NRI: net reclassification index, No. of obs.: number of observations, % of pop.: percentage of population, Conv. rate: conversion rate.
Development of T2DM any time during follow-up is counted as an event in this table. Net reclassification index was 0.18 (p = 0.0006).
Conclusions
The major findings of this study are that the DRS assesses risk accurately in an independent population (Botnia; AUC = 0.78), and that it performs better than all standard clinical risk assessment tools, including OGTT. Despite differences in populations and subject-selection criteria in the two cohorts, this finding demonstrates that the methods used to select biomarkers and train the DRS model are not specific to the original population and are generally robust to the variances in sample collection, measurements, and storage. The discrimination in Botnia is somewhat less than Inter99 (AUCs of 0.78 and 0.84, respectively). However, this difference in performance is due almost entirely to the differences in glucose performance between these two populations. In Inter99 the discrimination due to fasting glucose is very good (AUC = 0.78) while the performance in Botnia is surprisingly poor (AUC = 0.67). Given that fasting glucose is part of the DRS, combined with the large amount of missing HbA1c data in the Botnia cohort, this suggests that the differences in marker measurements cause the difference in performance rather than the model being over fitted to the Inter99 cohort. Inter99 was a study in which all laboratory measurements were from a single laboratory. The Botnia study utilises data collected from several centres where glucose was mostly measured in serum but in other cases was measured in plasma and then corrected to serum equivalents. Recent analysis of samples from the Insulin Resistance Atherosclerosis Study (IRAS), a multi-ethnic US-based cohort, showed similar performance of the DRS with an AUC = 0.763. 26
It should be noted that most of the subjects in the Botnia cohort were recruited from families with a history of diabetes, while Inter99 is a true population-based study (age-stratified random sample). Given this difference in selection of subjects, it is somewhat surprising that the performance of DRS, which was initially developed on Inter99, is quite similar in the Botnia cohort. These results suggest that the contribution of family history to diabetes risk is being captured by components of DRS. In a previous study Lyssenko et al. 27 compared clinical models of diabetes prediction in the Botnia cohort and the Malmo Prospective Preventive Study, a population-based study. Similar to the results reported in this current study, there was very little difference in the predictive models in these two studies. The performance of the DRS, a model based on seven circulating biomarkers (ADIPOQ, CRP, Ferritin, IL2Ra, HbA1c, fasting glucose, and serum insulin) plus age and gender, was benchmarked against other routine laboratory measures, including BMI, waist circumference, blood pressure, total and HDL cholesterol, FPG, HOMA-IR, and OGTT, as well as the San Antonio and Framingham clinical risk models. DRS provided better discrimination between converters and non-converters than any of these other predictors (Table 2) and the calibration of DRS was also superior to that of either clinical risk model (Figure 1(b)). Furthermore, most of the risk contributed by these measures is already incorporated in the DRS since adding these predictors to DRS in most cases did not improve discrimination, with the notable exceptions of HOMA-IR, BMI, and perhaps OGTT and waist circumference. These observations suggest that the DRS could be improved with markers of β-cell function and obesity. While the DRS has similar performance in these two cohorts, additional studies are required to evaluate the performance of DRS in other populations.
The Botnia cohort had frequent testing for outcomes and a long period of follow-up. This allowed the DRS to be assessed using survival analysis over a longer time horizon than it had been trained for. The Kaplan–Meier (Figure 2) curve shows a strong difference in diabetes conversion between the three risk groups, with hazard ratios of 8.0 (95% CI 5.2–12.5) for the high and 3.2 (2.1–4.7) for the moderate risk groups relative to the low-risk group. The high-risk group has a cumulative risk of 12.7% at five years (see horizontal line, Figure 2), and 59.8% at 15 years; the moderate-risk and low-risk groups do not cross the 13% threshold until 11 years and > 15 years respectively. Thus it appears that the DRS provides sufficient intervention time for the highest-risk subjects, while giving advance warning for the moderate-risk subjects. The low-risk population appears to be truly low-risk; the conversion probability did not change significantly until > 10 years from baseline.
The clinical utility of the DRS was compared with glucose-based tests in a reclassification analysis. The DRS was able to significantly reclassify high, moderate, and low-risk subjects in a comparison with three strata of risk based on glucose measures – NFG, IFG/NGT, and IFG/IGT. A striking result is that subjects with a low DRS have a low risk of developing diabetes regardless of glucose status. In addition, 54% of IFG/NGT subjects have a lower risk than subjects with NFG. Similarly, the conversion rate of the high-risk DRS group across all glucose classes (29.4% incidence) is higher than IFG/IGT subjects (22.6% incidence). This indicates that prevention resources invested in high-risk DRS subjects may yield a greater health economic benefit than investing in all IFG/IGT subjects; preliminary results are encouraging. 28
The DRS was developed with the assumption that multiple biomarkers predictive of and associated with disease pathogenesis should provide more powerful tools to identify patients at highest risk. The seven circulating biomarkers used in the DRS are involved in diverse biological pathways associated with the pathogenesis of T2DM. Individually, no single marker improves upon current clinical tools, but the combination of biomarkers in a single score performs better than all the tests evaluated, in an independent population. The DRS identifies high-risk subjects for whom earlier and more aggressive interventions to delay or prevent the onset of diabetes could be considered.
Footnotes
Acknowledgements
The Inter99 study was initiated by T Jørgensen (PI), K Borch-Johnsen (PI for the diabetes part), T Thomsen, and H Ibsen; the present steering group comprises T Jørgensen (PI), K Borch-Johnsen (co-PI), and C Pisinger. The authors gratefully acknowledge the skilful technical assistance of Claudia Elkin, Amalia Ocampo, and Edward Moler of Tethys Bioscience, and would like to thank Laura Penny and Linda Wuestehube for assistance in preparing the manuscript.
This work was supported by the Sigrid Juselius Foundation, the Folkhälsan Foundation, the Finnish Diabetes Research Association, the Nordic Centre of Excellence in Disease Genetics and a Linne grant from the Swedish Research Council to the Lund University Diabetes Centre (Botnia study), the Danish Medical Research Council, the Danish Centre for Evaluation and Health Technology Assessment, Novo Nordisk, Copenhagen County, the Danish Heart Foundation, the Danish Pharmaceutical Association, Augustinus Foundation, Ib Henriksen Foundation and Becket Foundation (Inter99 study). All clinical activities of the Steno Diabetes Centre are paid by the public health care system, but Novo Nordisk strongly subsidises the research activities of the Steno Diabetes Centre. Tethys Bioscience funded the generation of data and part of the results presented in this manuscript.
LG has been a consultant for and served on advisory boards for Tethys Bioscience, Inc., Sanofi-Aventis, GSK, Lilly, Merck, and Novartis; also he has lectured at meetings organised by Novartis, GSK, and Sanofi-Aventis. Until 1 December 2010, KB-J was employed as a Director and Professor of the Steno Diabetes Centre, a hospital providing health service for the public health care system but owned by Novo Nordisk A/S, and thus has been an employee of Novo Nordisk A/S, a company that manufactures and markets pharmaceuticals related to the treatment of diabetes; he also owns shares in Novo Nordisk and has within the last five years received honorarium for invited lectures by Bristol-Myers Squibb and Lilly. OP is employed as a director of research at Hagedorn Research Institute, an academic research centre, which is owned by Novo Nordisk A/S; he owns employee shares in Novo Nordisk and has lectured at meetings organised by Novo Nordisk, Servier, Tethys, and GSK. JK, RG, MM, and MR are employees and shareholders of Tethys Bioscience, Inc. No other authors reported conflict of interest.