
Abstract
This study examined whether changes in HbA1c values are reflected in the risk scores and categories of four validated risk-assessment tools (QDiabetes, Leicester Risk Assessment, Finnish Diabetes Risk Score and Cambridge Risk Score). Retrospective analysis was performed on 651 individuals with no prior diagnosis of cardiovascular disease or diabetes who participated in a UK workplace-based risk-assessment initiative. There were significant positive correlations (p < 0.01) revealed between HbA1c values and predicted risk scores: QDiabetes (r = 0.362), Leicester Risk Assessment (r = 0.315), Finnish Diabetes Risk Score (r = 0.202) and Cambridge Risk Score (r = 0.335). HbA1c values increased within risk prediction categories, and at ‘high-risk’ categories, median HbA1c values were at least 39 mmol mol−1 (5.7%) irrespective of gender or risk-assessment model. Overall, an association is present between increases in HbA1c scores and predicted risk of type 2 diabetes. Furthermore, the ‘high-risk’ median HbA1c values in each of the risk assessments are more akin to the lower American recommendations rather than those suggested by the UK expert group.
Introduction
Type 2 diabetes (T2DM) remains a global health burden with latest estimates predicting that 592 million people will be diagnosed with the condition by 2035. 1 Lifestyle intervention through increased physical activity and diet modification has been extensively demonstrated to be an effective method in preventing individuals at ‘high risk’ of diabetes progress to developing the condition.2–5 Current UK National Institute of Health and Care Excellence (NICE) recommendations 6 advocate the use of validated risk-assessment tools to identify those individuals at ‘high risk’ of developing T2DM and who would benefit from lifestyle interventions.
To somewhat complicate matters, in 2011, glycated haemoglobin (HbA1c) was introduced by the World Health Organization 7 as additional diagnostic criteria for T2DM which supersedes the date of which many of the commonly used validated diabetes risk assessments were produced. The performance of the Finnish Diabetes Risk Score (FINDRISC) tool has already been questioned with the shift from glucose diagnosis to HbA1c diagnosis, thereby reducing the predictive capabilities of this assessment. 8 Thus, the relationship between validated risk prediction models and HbA1c warrants further investigation.
In addition, a HbA1c threshold of 39 mmol mol−1 (5.7%) is widely accepted as an indicator of pre-diabetes by the latest American Diabetes Association (ADA) guidelines; 9 this is clinically relevant given that 5%–10% of people with pre-diabetes progress to developing T2DM annually. 10 Unlike some of their global contemporaries, the United Kingdom currently does not have a general consensus on an HbA1c value to determine ‘high risk’ of T2DM, although an expert group did propose a threshold of 42 mmol mol−1 (6.0%).6,11
Therefore, the aim of this study was to investigate the relationship between HbA1c and risk prediction scores in four validated risk-assessment models in a cohort of UK individuals with no prior diagnosis of cardiovascular disease (CVD) or T2DM.
Materials and methods
Study population
All participants in this study were employees of either the local health board or steel workers within the Welsh region of Carmarthenshire who had received a CVD and diabetes risk assessment as part of the established Prosiect Sir Gâr workplace-based initiative. 12 The initiative was introduced in 2009, and data collection for this study took place between 2009 and 2012. This study focusses on the 651 employees who accepted the invitation of a health assessment and had a recorded HbA1c measurement at the visit, of which 368 were females and 283 males.
Baseline measurements and risk prediction equations
According to a standard operational policy (SOP), all recruited individuals attended a standardised health assessment appointment with an occupational health nurse which lasted 30–40 min. During the session, demographic (date of birth, gender and postcode of residence) and anthropometric (body mass, height and waist circumference) data were collected; systolic and diastolic blood pressure, smoking status, lifestyle choices (physical activity and dietary information) and family and medical histories were all recorded. In addition, a capillary blood sample was obtained and analysed immediately for HbA1c (DCA 2000; Siemens Healthcare Diagnostics Ltd, Frimley, UK). The full details of the risk assessment have been published in detail elsewhere. 12 The risk of developing T2DM was predicted by the QDiabetes, 13 Leicester Risk Assessment, 14 FINDRISC 15 and Cambridge Risk Score 16 models.
Data analysis
The focus of our analysis within this study was to investigate the relationships between four validated and routinely used diabetes risk-assessment tools and measured HbA1c values in individuals with no prior diagnosis of CVD or T2DM. Statistical analysis was performed using SPSS software version 19.0 (SPSS Inc, Chicago, USA) with significance set at p < 0.05. Normality of data was assessed by one-sample Kolmogorov–Smirnov test. Waist circumference data are represented as mean ± standard deviation (SD). Body mass index (BMI), systolic blood pressure, diastolic blood pressure and QDiabetes scores did not have a normal distribution. These data sets were consequently log-transformed for analysis and represented as the geometric mean and approximate SD. Age, HbA1c, FINDRISC, Leicester Risk Assessment and Cambridge Risk Score data did not have a normal distribution following log transformation, and these data are represented as median and interquartile range. Kruskal–Wallis and Mann–Whitney tests were used to analyse differences between risk categories of the T2DM risk prediction models. Relationships between HbA1c values and risk prediction model scores were investigated using Pearson’s correlation.
Ethical approval
Prosiect Sir Gâr was approved by Dyfed Powys Local Research Ethics Committee (reference number: 11/WA/0101) and subsequently deemed to be a service-based delivery project.
Results
Baseline characteristics
A number of interesting observations in terms of excess weight could be inferred from the baseline characteristics with evidence of central obesity from the waist circumference measurements and also from the ‘overweight’ BMI values in both female and male cohorts (Table 1). Of note, the median HbA1c scores were indicative of normal glycaemic control in each of the three cohorts. In regard to risk prediction, both the male and female cohorts were categorised as ‘low’, ‘increased’ and ‘slightly elevated’ risk by the QDiabetes, Leicester Risk Assessment and FINDRISC models, respectively. The Cambridge Risk Score calculated the female cohort to be in the second lowest risk quintile and the male cohort in the second highest risk quintile (Table 1).
Baseline characteristics of the study participants.
FINDRISC: Finnish Diabetes Risk Score; T2DM: type 2 diabetes.
Data expressed as means ± standard deviations.
Data not normally distributed following log transformation, median and interquartile range reported.
Log-transformed data, geometric mean and approximate standard deviations reported.
Relationship between HbA1c and risk prediction scores
Examining the associations between HbA1c and predicted risk of developing T2DM revealed positive and significant observations in each of the four risk assessments in all individuals, irrespective of the gender investigated (Table 2). In all individuals, explained variance of the correlations was higher than 10.0% in three of the risk assessments (QDiabetes, Leicester Risk Assessment and Cambridge Risk Score) with the lowest correlation observed in the FINDRISC model. In the female cohort, the explained variance ranged between 5.3% (FINDRISC) and 15.0% (Leicester Risk Assessment), while in the male individuals the explained variances were observed to range from 6.6% (FINDRISC) up to 13.1% (Cambridge Risk Score).
Correlations between HbA1c values and risk prediction scores examined in all, female and male individuals.
FINDRISC: Finnish Diabetes Risk Score.
HbA1c values and risk prediction categories
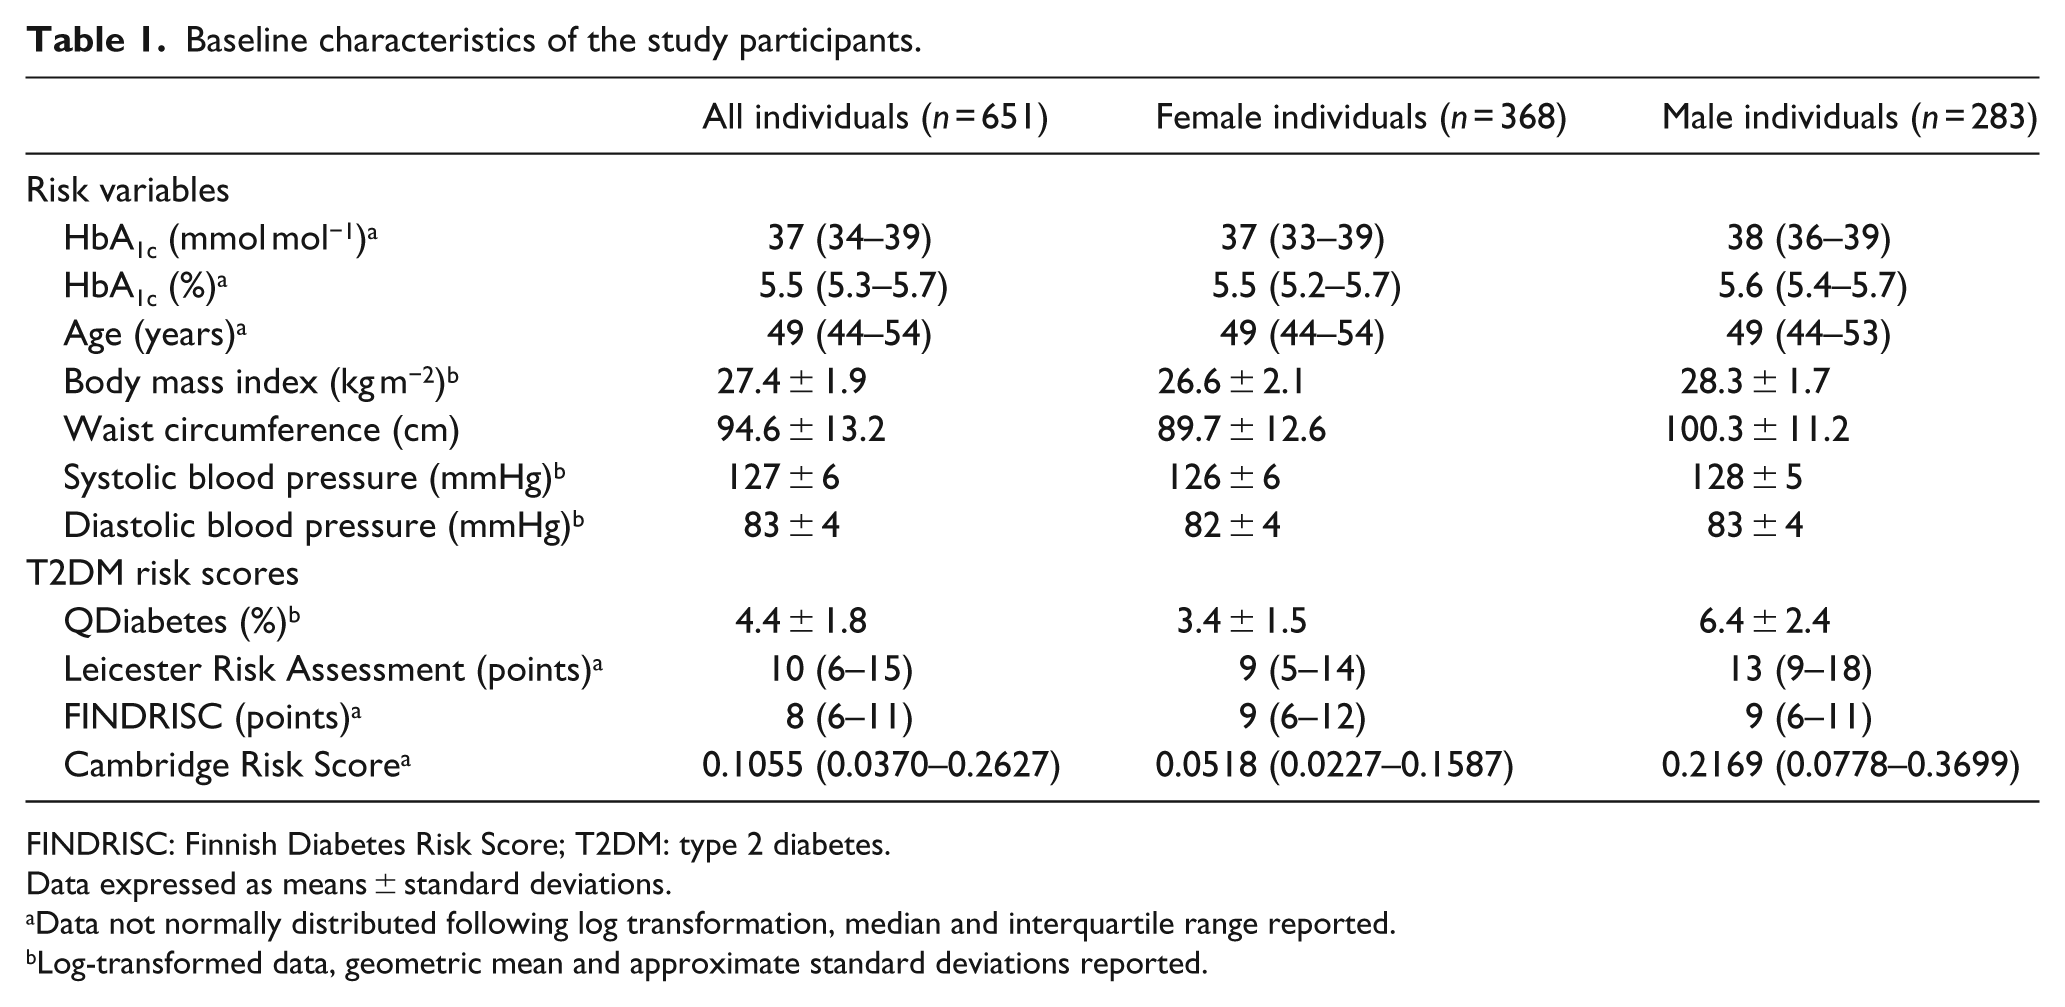
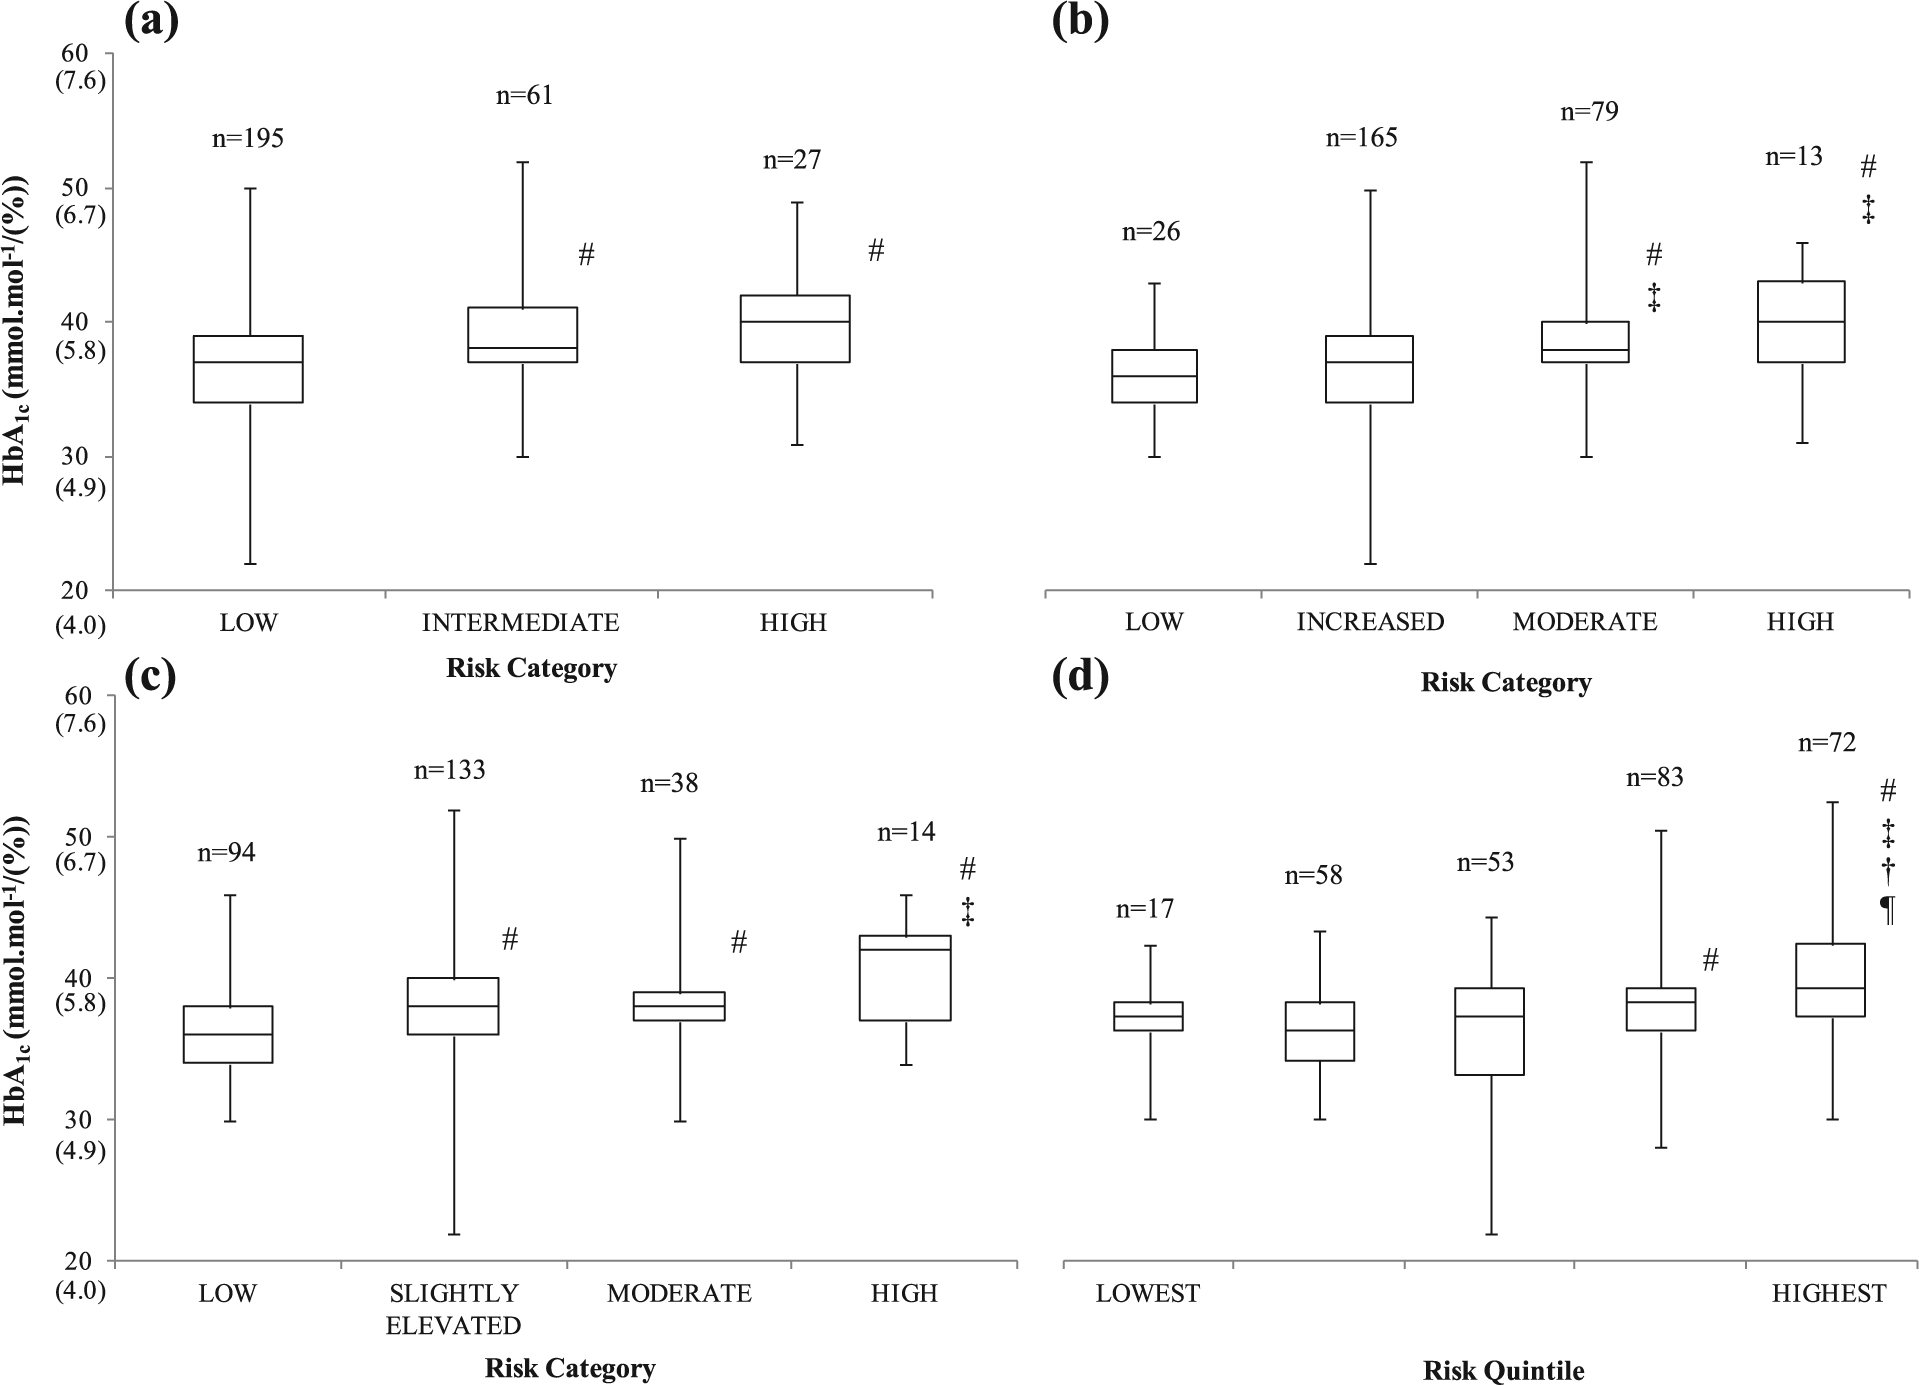
The positive correlations translated into an incremental increase in the median HbA1c values of the associated risk-assessment categories as illustrated in Figures 1 to 3. In all individuals, the median HbA1c values were higher in each category of both the Leicester Risk Assessment and FINDRISC models. An incremental increase was observed in the Cambridge Risk Score from the third quintile onwards, and in the QDiabetes model, the intermediate and high-risk medians were higher compared to the low-risk categories (Figure 1). The median HbA1c values were 41 mmol mol−1 (5.9%) in the Leicester Risk Assessment, 40 mmol mol−1 (5.8%) in the QDiabetes model and 39 mmol mol−1 (5.7%) in the two other risk assessments (FINDRISC and Cambridge Risk Score).
Changes in median, interquartile range, minimum and maximum HbA1c values of all employees in the associated risk categories of the (a) QDiabetes, (b) Leicester Risk Assessment, (c) FINDRISC and (d) Cambridge Risk Score prediction models/questionnaires.
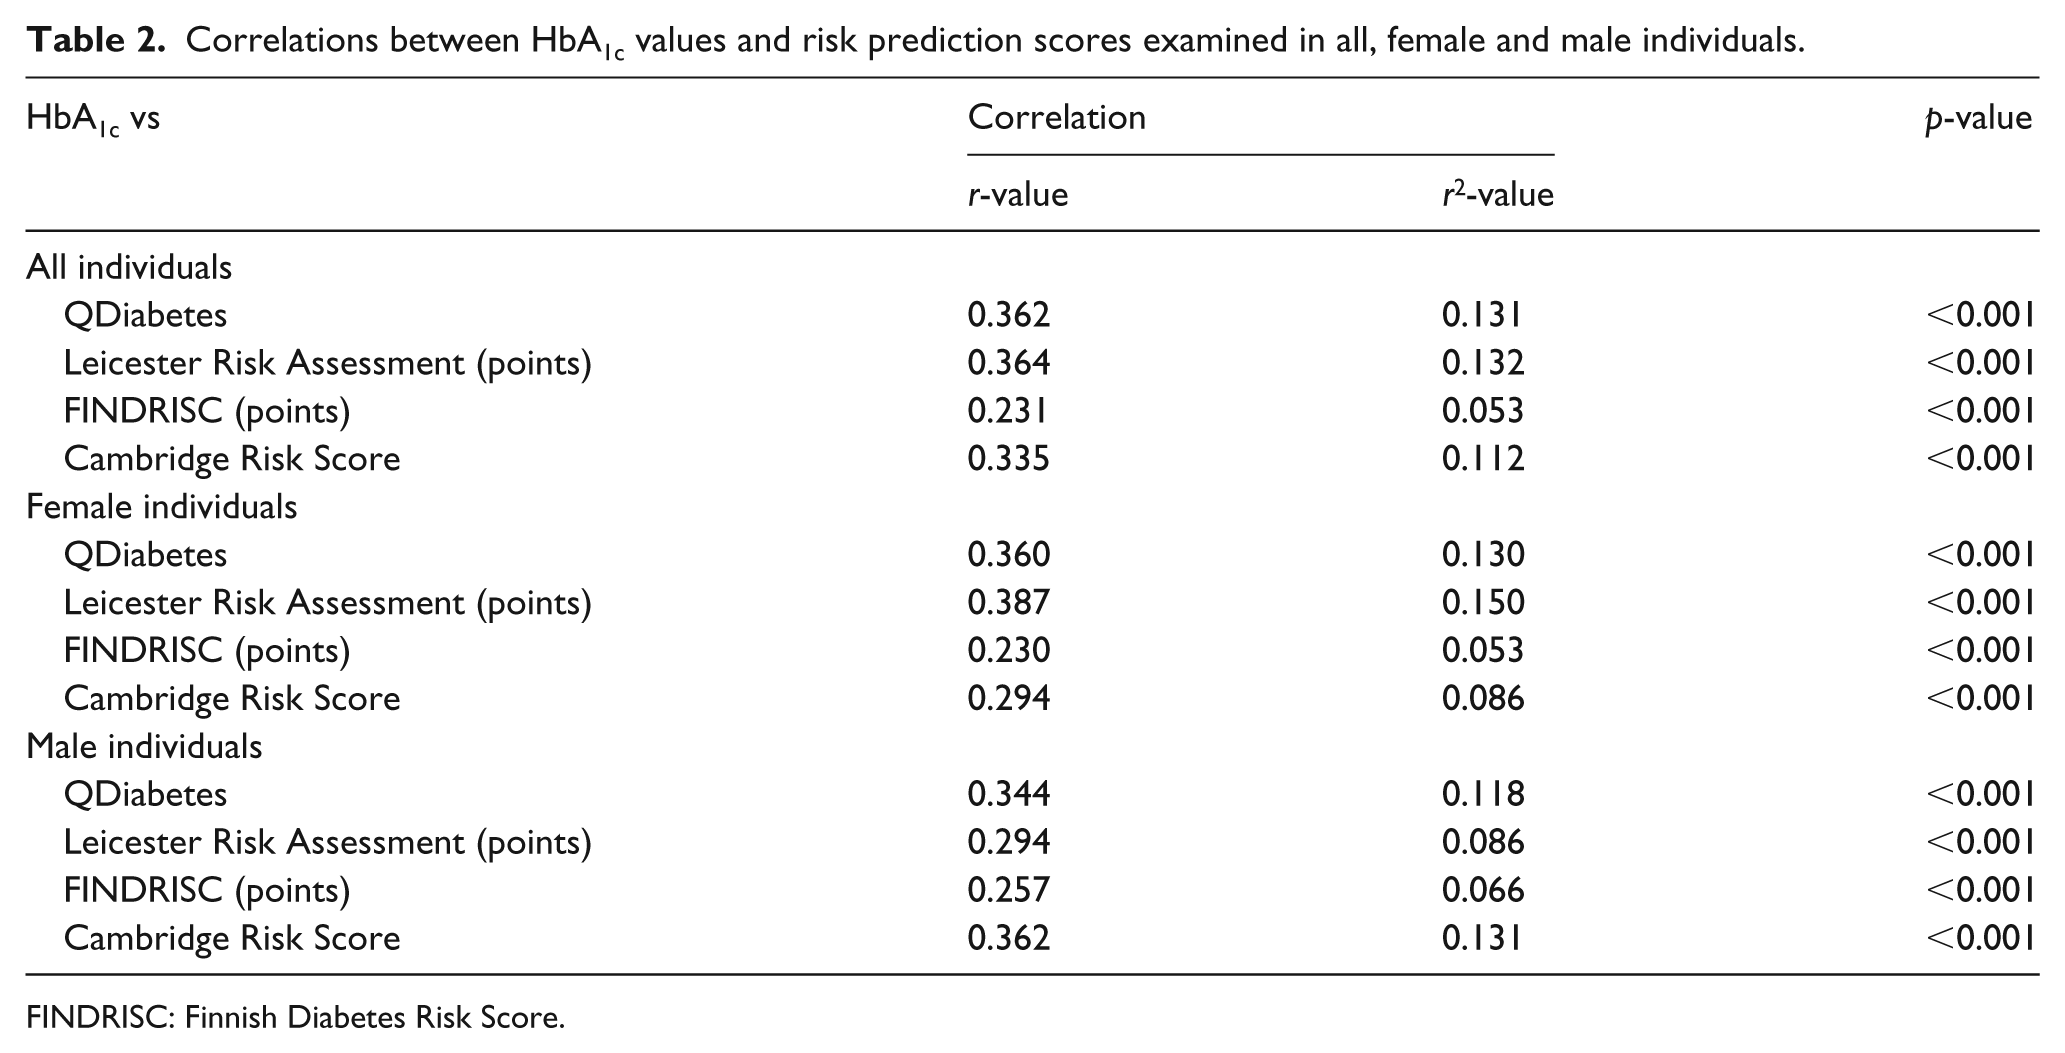
Changes in median, interquartile range, minimum and maximum HbA1c values of female employees in the associated risk categories of the (a) QDiabetes, (b) Leicester Risk Assessment, (c) FINDRISC and (d) Cambridge Risk Score prediction models/questionnaires.
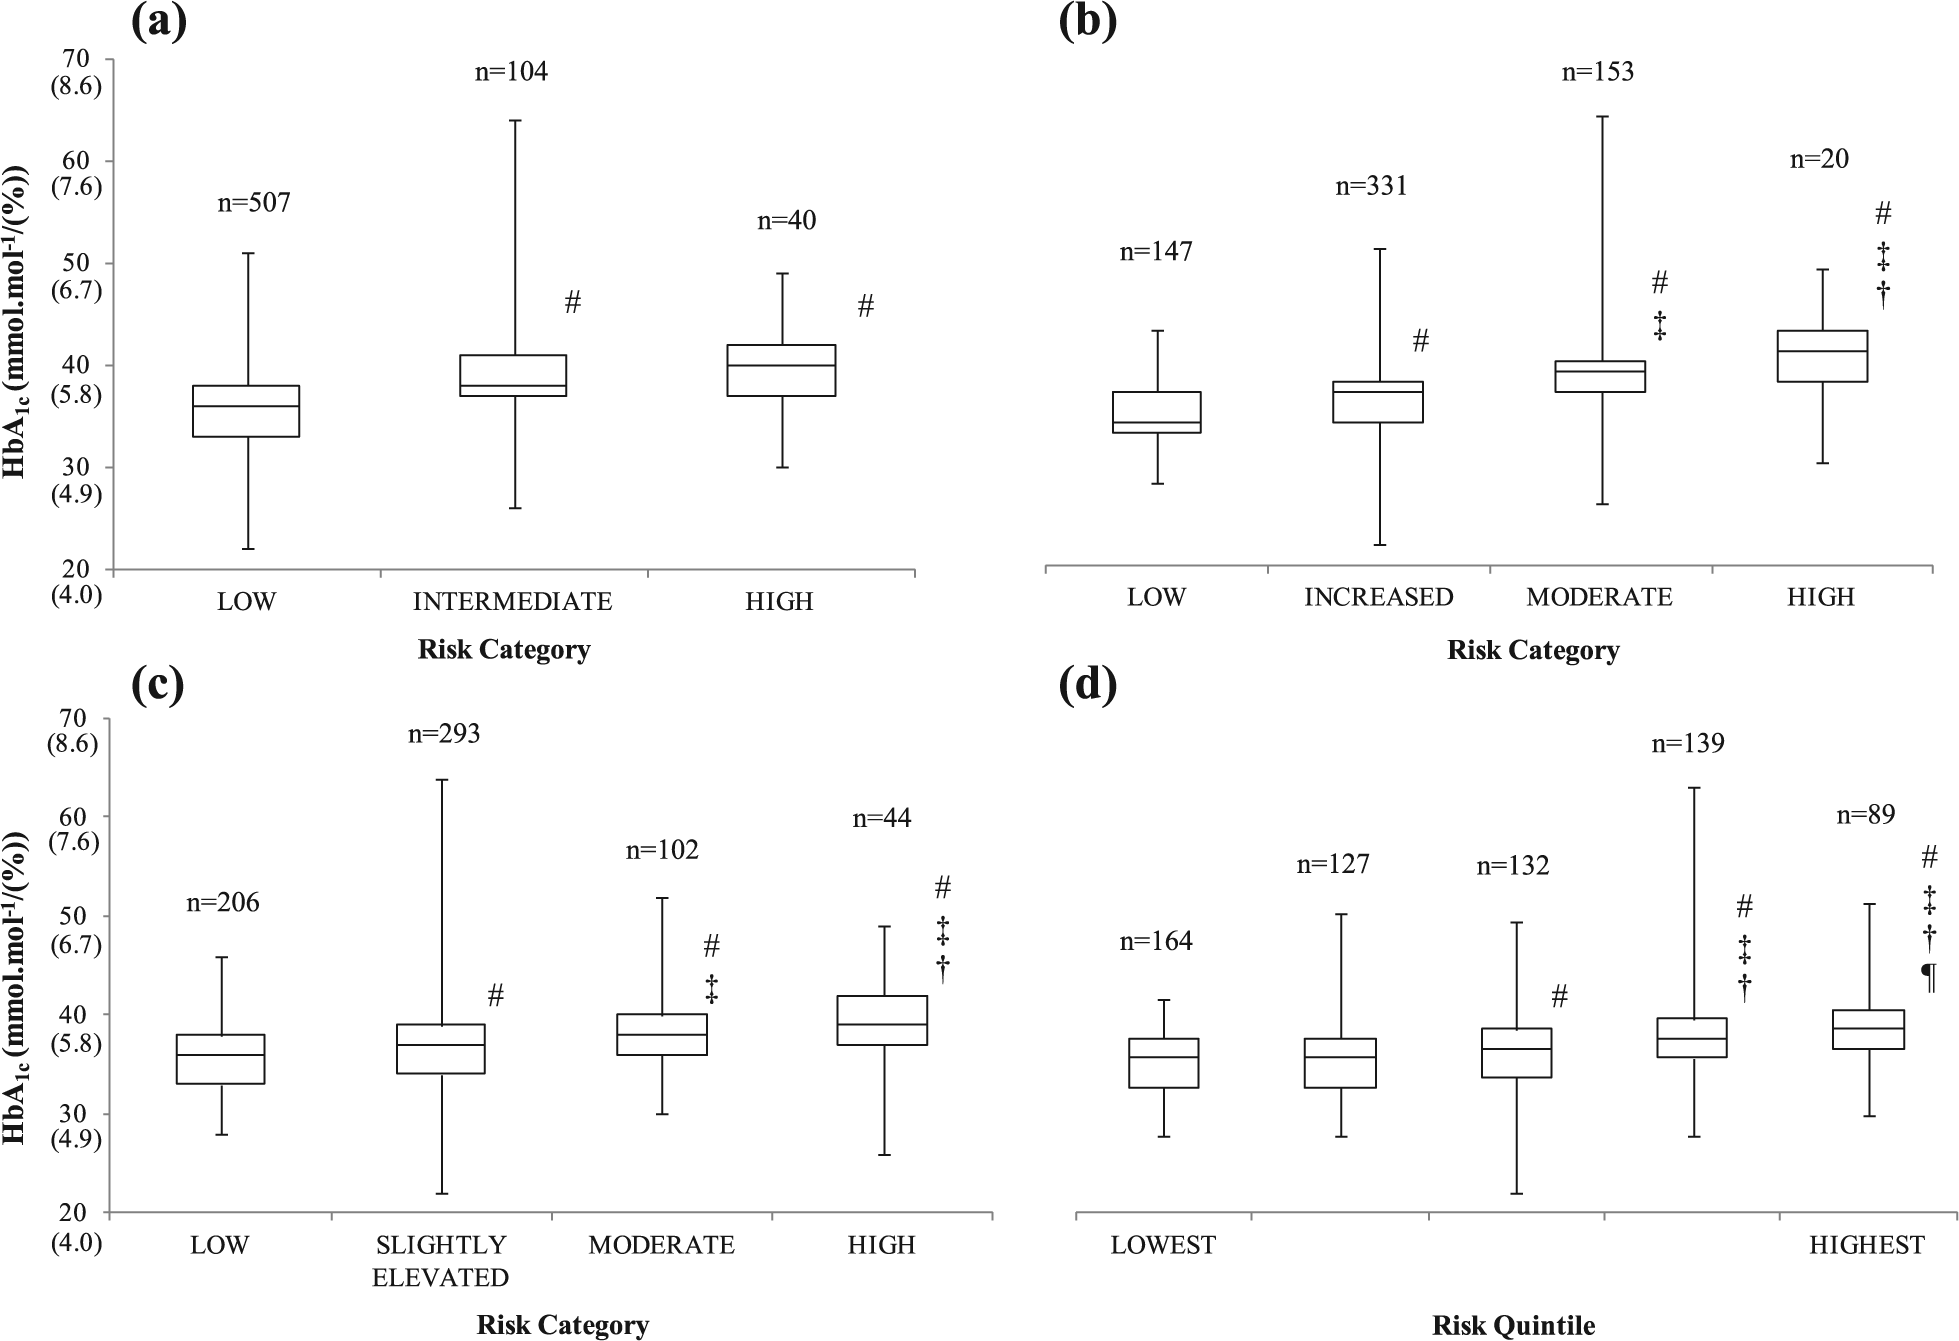
Changes in median, interquartile range, minimum and maximum HbA1c values of male employees in the associated risk categories of the (a) QDiabetes, (b) Leicester Risk Assessment, (c) FINDRISC and (d) Cambridge Risk Score prediction models/questionnaires.
In the female individuals (Figure 2), the somewhat strong explained variance of the correlation between HbA1c and the Leicester Risk Assessment was demonstrated in the incremental rise of median HbA1c values across the risk categories. The median HbA1c values in the latter two categories/quintiles of the FINDRISC and Cambridge Risk Score models were revealed to be greater than the lower categories/quintiles. Finally, the intermediate and high-risk median values were greater than the low-risk median of the QDiabetes algorithm. The high-risk median HbA1c values in the female individuals ranged between 39 mmol mol−1 (5.7%) (FINDRISC and Cambridge Risk Score) and 41 mmol mol−1 (5.8%) (QDiabetes and Leicester Risk Assessment).
The male individuals were observed to have median HbA1c values of 39 mmol mol−1 (5.7%) (Cambridge Risk Score), 40 mmol mol−1 (5.8%) (QDiabetes, Leicester Risk Assessment) or 42 mmol mol−1 (6.0%) (FINDRISC) in the high-risk categories of the assessment tools (Figure 3). The high-risk medians were greater than the two low-risk medians in all risk assessments besides the QDiabetes model; however, both the ‘high’ and ‘intermediate’ medians were higher than the ‘low’ median in this predictive tool. Furthermore, the median values in the Cambridge Risk Score increased with each risk quintile.
Of interest, irrespective of gender and T2DM risk model adopted, the ‘high-risk’ category median HbA1c values were observed to be 39 mmol mol−1 (5.7%) or greater despite the differing numbers predicted in the ‘high-risk’ categories. It should also be noted that some individuals with an HbA1c score greater than 48 mmol mol−1 (6.5%), the recognised diagnostic threshold for T2DM, were predicted to be in some of the lower risk categories/quintiles by the risk-assessment models.
Discussion
The aim of this study was to investigate the relationship between HbA1c and risk prediction scores in four validated risk-assessment models. The most significant finding in this study is that irrespective of gender or the risk-assessment model adopted, the median ‘high-risk’ HbA1c score was at least 37 mmol mol−1 (5.7%). In addition, positive correlations were observed between HbA1c and risk prediction scores in all genders across each of the four assessment models.
One of the strengths of this study lies in the ‘real-life’ aspect of the data; these individual data would not have been routinely collected and accessible if not for the Prosiect Sir Gâr initiative. 12 A further strength is that, to our knowledge, this study is the first to directly measure HbA1c and diabetes risk scores together, effectively bypassing a stage of the current NICE guidelines. 6 Directly analysing the relationships between HbA1c scores and predicted T2DM risk is an important consideration especially as a result of the changes in diagnostic criteria introduced in 2011 by the World Health Organization. 7 The correlations across all genders were significant and positive with explained variances ranging between 5.3% and 15.0% across the four risk-assessment tools. Consistently, the FINDRISC questionnaire demonstrated the lowest explained variance (5.3%–6.6%), and the performance of the tool has been previously reported to be reduced by 5.6% when only considering the new HbA1c criteria to diagnose T2DM. 8 Irrespective of the risk-assessment model adopted, a small number of individuals with an HbA1c signifying undiagnosed T2DM were predicted in some of the lower risk categories. Thus, as a result these individuals would not qualify for further clinical investigations. 6 Somewhat, encouragingly, an emerging model has been recently developed that has accounted for these diagnostic changes involving HbA1c in its predictive capability. 17
Consistent with existing literature, 18 we observed different numbers of individuals predicted at ‘high risk’ of developing T2DM dependent on which risk assessment was used. However, from a clinical standpoint, despite these discrepancies, the median ‘high-risk’ HbA1c values regardless of gender or risk-assessment model were ⩾39 mmol mol−1 (5.7%). Therefore, the median ‘high-risk’ HbA1c values fell between the pre-thresholds (39 mmol mol−1 (5.7%)) proposed by the ADA 9 as opposed to the 42 mmol mol−1 (6.0%) values proposed by NICE. 6 This NICE HbA1c cut-off point has been previously questioned in regard to lack of sensitivity to detect impaired glucose regulation with an optimal cut-off point in White Europeans suggested to be 40 mmol mol−1 (5.8%) with a sensitivity and specificity index of 61.5% and 67.9%, respectively. 19 The observations within this study and the consistency with existing literature provide further evidence to the concession made by John 11 that an individual with HbA1c <42 mmol mol−1 (6.0%) may still be at risk of T2DM. Thus, raising the suggestion that the HbA1c thresholds currently recommended by NICE could be modified towards the ADA values, and therefore, the ‘high-risk’ categories of the risk assessments would be more reflective of these thresholds.
The positive, albeit rather modest associations between HbA1c values and risk prediction scores in each of the models are all encouraging observations in regard to all of the risk assessments and agree with existing literature. Previous research examining the EPIC-Norfolk cohort revealed that the progression rate over 3 years to T2DM was 15 times greater in those with a baseline HbA1c between 42 and 47 mmol mol−1 (6.0%–6.4%) compared to individuals with baseline HbA1c <31 mmol mol−1 (5.0%). 20 The risk of diabetes has also been shown to increase exponentially with HbA1c, in another study the risk of diabetes increased sevenfold for each 1% increase in HbA1c in individuals with impaired fasting glucose. 21 One further suggestion for the positive associations observed could be the inclusion of age as a weighted risk factor in each of the risk assessments, especially given that a previous epidemiological study revealed a significant increase in HbA1c in males and females aged ⩾50 years. 22
One of the limitations in this study is that the study population are predominantly Caucasian individuals and the findings may not translate into multi-ethnic settings. However, some of the diabetes risk-assessment models include ethnicity as a risk factor and South Asian countries also adopt the ADA HbA1c pre-diabetes recommendations. 23 In addition, the number of individuals in the higher risk categories could be viewed as relatively small; however, this is likely attributable to the ‘real-life’ nature of the data set. Unfortunately, we do not have fasting plasma glucose measurements to assess these associations between risk prediction scores as well. Many studies23–26 have examined the combined effects of HbA1c and fasting plasma glucose values which demonstrate that this combination may identify a greater number of individuals at risk than either measurement alone. One of these studies even proposes that a diabetes risk score that includes both fasting plasma glucose and HbA1c could improve the effectiveness of diabetes screening programmes. 25 In this study, we have not included analysis with respect to the diagnostic performance of HbA1c at detecting ‘high risk’ in each of the risk prediction models. This omission could explain both the observed overlap in HbA1c across the different categories of the risk models and why a threshold of ⩾39 mmol mol−1 (5.7%), although most appropriate for this population, would identify different individuals depending on the risk model. Another perceived limitation could be that the HbA1c scores were determined by capillary puncture and the use of a point-of-care device rather than venous sampling. Although the HbA1c values in this study were only for investigating associations and not as diagnostic measures, previous research has demonstrated that point-of-care measurements produce statistically comparable HbA1c values to standard measurements. 27
In conclusion, the observations from this research are more akin to the ADA recommendations 9 where a value of 39 mmol mol−1 (5.7%) classifies an individual at ‘high risk’ of T2DM. Therefore, it provides more evidence that the optimal HbA1c threshold should be reduced from the current UK recommendation 6 of 42 mmol mol−1 (6.0%) to improve the sensitivity of detection of impaired glucose regulation in White Europeans as previously suggested by Mostafa et al. 19 Lowering this threshold would also potentially detect more individuals who would benefit from lifestyle modifications that would effectively reduce their risk of developing T2DM.
Footnotes
Acknowledgements
The members of the Prosiect Sir Gâr Group are as follows: Kerry Morgan, Chris Cottrell, Vanessa Davies, Liz Newbury-Davies, Michael Thomas, Enzo M Di Battista, Lesley Street, Fiona Judd, Cindy Evans, Jo James, Claire Jones, Carolyn Williams, Susan Smith, James Thornton, Sally P Williams, Rhys Williams, Sam Rice, Jeffrey W Stephens and Meurig Williams.
Declaration of conflicting interests
The author(s) declared no potential conflicts of interest with respect to the research, authorship and/or publication of this article.
Funding
This work was partly funded by the European Social Fund (ESF) through the European Union’s Convergence programme administered by the Welsh Government, and the corresponding author was also partly funded by the St David’s Medical Foundation. Prosiect Sir Gâr received funding contributions from TATA Steel, Hywel Dda Health Board (Diabetes Charitable Fund and Carmarthenshire Charitable Fund), Carmarthenshire County Council and the following pharmaceutical companies: Takeda, Lilly, Sanofi-Aventis, Boehringer-Ingelheim, Pfizer and AstraZeneca.