
Abstract
This study investigated the relationships of self-reported physical activity levels and cardiorespiratory fitness in 81 males to assess which measurement is the greatest indicator of cardiometabolic risk. Physical activity levels were determined by the General Practice Physical Activity Questionnaire tool and cardiorespiratory fitness assessed using the Chester Step Test. Cardiovascular disease risk was estimated using the QRISK2, Framingham Lipids, Framingham body mass index and Joint British Societies’ Guidelines-2 equations, and type 2 diabetes mellitus risk calculated using QDiabetes, Leicester Risk Assessment, Finnish Diabetes Risk Score and Cambridge Risk Score models. Categorising employees by cardiorespiratory fitness categories (‘Excellent/Good’ vs ‘Average/Below Average’) identified more differences in cardiometabolic risk factor (body mass index, waist circumference, total cholesterol, total cholesterol:high-density lipoprotein ratio, high-density lipoprotein cholesterol, triglycerides, HbA1c) scores than physical activity (waist circumference only). Cardiorespiratory fitness levels also demonstrated differences in all four type 2 diabetes mellitus risk prediction models and both the QRISK2 and Joint British Societies’ Guidelines-2 cardiovascular disease equations. Furthermore, significant negative correlations (p < 0.001) were observed between individual cardiorespiratory fitness values and estimated risk in all prediction models. In conclusion, from this preliminary observational study, cardiorespiratory fitness levels reveal a greater number of associations with markers of cardiovascular disease or type 2 diabetes mellitus compared to physical activity determined by the General Practice Physical Activity Questionnaire tool.
Introduction
The relationships between cardiorespiratory fitness and the risk of both cardiovascular disease (CVD)1–3 and type 2 diabetes mellitus (T2DM)4,5 have been well established. However, despite these evident and strong associations, cardiorespiratory fitness is widely overlooked as a cardiometabolic risk factor in clinical practice. The measurement of physical activity levels is preferred, and tailored advice to reduce the risk of T2DM, for example, is recommended to be provided from these findings. 6 As the health challenges of both CVD and T2DM remain, it could be time to reconsider these recommendations.
Occupational physical activity, for instance, has been reported to have a protective effect against the development of both CVD 7 and T2DM. 8 However, emerging research has highlighted a substantial prevalence of cardiometabolic risk factors in males employed within the industrial sector,9–11 in occupations typically perceived to be ‘physically active’. There is further evidence that suggests that males within the industrial sector are protected from developing T2DM by their increased levels of cardiorespiratory fitness. 12
Therefore, the aim of this study is to examine the relationship between cardiorespiratory fitness, self-reported physical activity and the prediction of CVD and T2DM and associated risk variables in a group of males employed within the industrial sector. Furthermore, to our knowledge, no studies have directly investigated whether any relationships exist between current cardiorespiratory fitness levels and risk prediction scores for either condition.
Methods
Study population
Individuals were recruited from male employees who participated in the original Prosiect Sir Gâr initiative 13 based in Carmarthenshire, South Wales, and any other employees who fulfilled the original inclusion criteria (⩾40 years old with no prior diagnosis of CVD or diabetes). A total of 82 male employees returned for a follow-up assessment (which was on average 4.2 years after their initial risk assessment) and an additional 24 individuals attended a risk assessment for the first time which gave a total of 106 individuals. Of these employees, 12 declined the fitness assessment and 13 were excluded from the fitness assessment on medical grounds [10 were currently prescribed anti-hypertensive medication, 2 were hypertensive during the risk assessment (blood pressure > 140/90 mmHg) and 1 individual had experienced a CVD event between appointments], leaving a total of 81 employees for analysis. These 81 individuals were all employed within different roles in the steel works; 43 employees indicated that their job required physical effort which involved the handling of either heavy or very heavy loads, 16 employees designated that their role was mainly standing or walking, requiring no intense physical effort, and the remaining 22 individuals stated their employment was in a predominantly sitting occupation.
Risk appointment
During normal working hours, individuals attended the occupational health department for an appointment lasting 60 min. During the visit, demographic (date of birth, gender, postcode of residence) and anthropometric (body mass, height, waist circumference) data were collected. Systolic and diastolic blood pressure, heart rate and rhythm (to screen for cardiac arrhythmias), smoking status, dietary habits (fruit and vegetable consumption), family and medical histories were recorded and blood samples obtained. Blood samples were collected via capillary puncture and analysed for total, high-density lipoprotein (HDL) and low-density lipoprotein (LDL) cholesterol; triglycerides; blood glucose (Cholestech LDX; Alere Inc., Orlando, FL, USA); and HbA1c (DCA 2000; Siemens Healthcare Diagnostics Ltd, Frimley, UK). In addition, current physical activity levels were assessed by the General Practice Physical Activity Questionnaire (GPPAQ). 14
Cardiorespiratory fitness protocol
The cardiorespiratory fitness of the male employees was evaluated by performing the Chester Step Test, an assessment routinely used by the Fire Brigade in the United Kingdom. Submaximal in nature [test is terminated at 80% Maximum Heart Rate (MHR)], the Chester Step Test lasts for a maximum duration of 10 min and requires an individual to step (height is pre-determined by age and physical activity levels) to a metronomic beat. The protocol consists of five stages, each lasting for 2 min which increase in speed cumulatively. Heart rate is recorded at the end of each stage, and cardiorespiratory fitness is calculated by extrapolating the line of best fit to the MHR of the individual. Cardiorespiratory fitness levels calculated using this method demonstrated high correlation (r = 0.92) with cardiorespiratory fitness levels measured using a treadmill ramp protocol. 15 Due to the simplicity of the protocol and limited equipment and space requirements, the Chester Step Test could easily be included in a workplace-based risk assessment for CVD and T2DM. The age-defined cardiorespiratory fitness categories for the male employees are detailed in Table 1.
Cardiorespiratory fitness values and respective values for the relevant age categories of the males participating in this study.
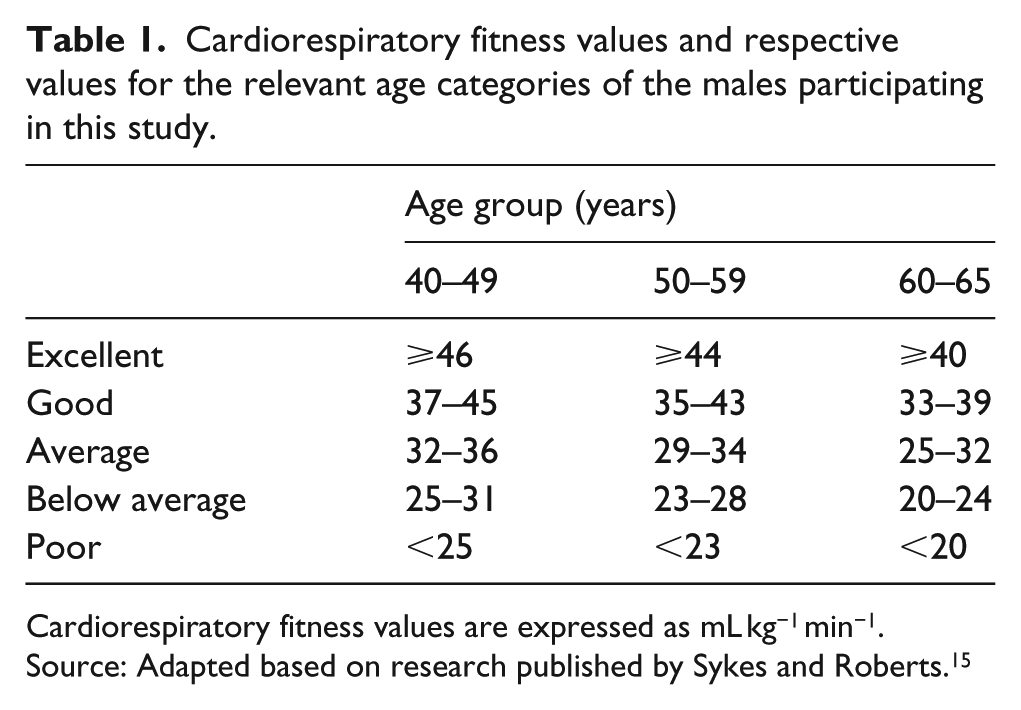
Cardiorespiratory fitness values are expressed as mL kg−1 min−1.
Source: Adapted based on research published by Sykes and Roberts. 15
Risk prediction
Ten-year risk of CVD was predicted following the adoption of the QRISK2-2014, Framingham Lipids, Framingham body mass index (BMI) and Joint British Societies’ Guidelines-2 (JBS 2) risk equations and risk of developing T2DM assessed by the QDiabetes, Leicester Risk Assessment, Finnish Diabetes Risk Score (FINDRISC) and Cambridge Risk Score algorithms/questionnaires.
Statistical analysis
Statistical analysis was performed using IBM SPSS Statistics software (version 20, SPSS Inc, Chicago, IL, USA) with statistical significance set at p < 0.05. Normality of data was assessed by one-sample Kolmogorov–Smirnov tests and represented as mean ± standard deviation (SD). Analysis of variance (ANOVA) was used to compare any differences between groups. Relationships between cardiorespiratory fitness and risk prediction values were assessed using Pearson’s correlation.
Ethical approval and informed consent
The Prosiect Sir Gâr initiative scheme was approved by Dyfed Powys Local Research Ethics Committee (reference number: 11/WA/0101), and subsequently deemed to be a service-based delivery project. Informed consent was provided by all employees at the beginning of the risk assessment, and all participants completed the Physical Activity Readiness Questionnaire (PARQ) before completing the Chester Step Test.
Results
Baseline characteristics and risk prediction scores
Table 2 details the baseline characteristics of the 81 steel workers who participated in the risk assessment. As can be seen, the average BMI value is close to the ‘obese’ category, with evidence of central obesity (waist circumference: 103.0 ± 10.7 cm) in the waist circumference figures and mean systolic and diastolic blood pressure levels above the desired 120/80 mmHg thresholds. The lipid profile variables are also elevated with a total cholesterol (TC) and non-fasted triglyceride concentrations averaging above the threshold targets. Of note, the cardiorespiratory fitness levels of the male employees were further categorised as ‘Good’, irrespective of the age of the individuals. Table 3 reports the estimated risk of CVD and T2DM. The QRISK2-2014 algorithm predicted the employees to be at the lowest 10-year risk and the average value was in the ‘low’ category, and the three other risk algorithms predicted the males to be at ‘intermediate’ risk of experiencing a 10-year cardiovascular event. The risk assessments for predicted T2DM calculated the employees to be at ‘low’, ‘increased’, ‘slightly elevated’ or at the second highest risk quintile using the QDiabetes, Leicester Risk Assessment, FINDRISC and Cambridge Risk Score tools, respectively.
Baseline characteristics of the steel workers.
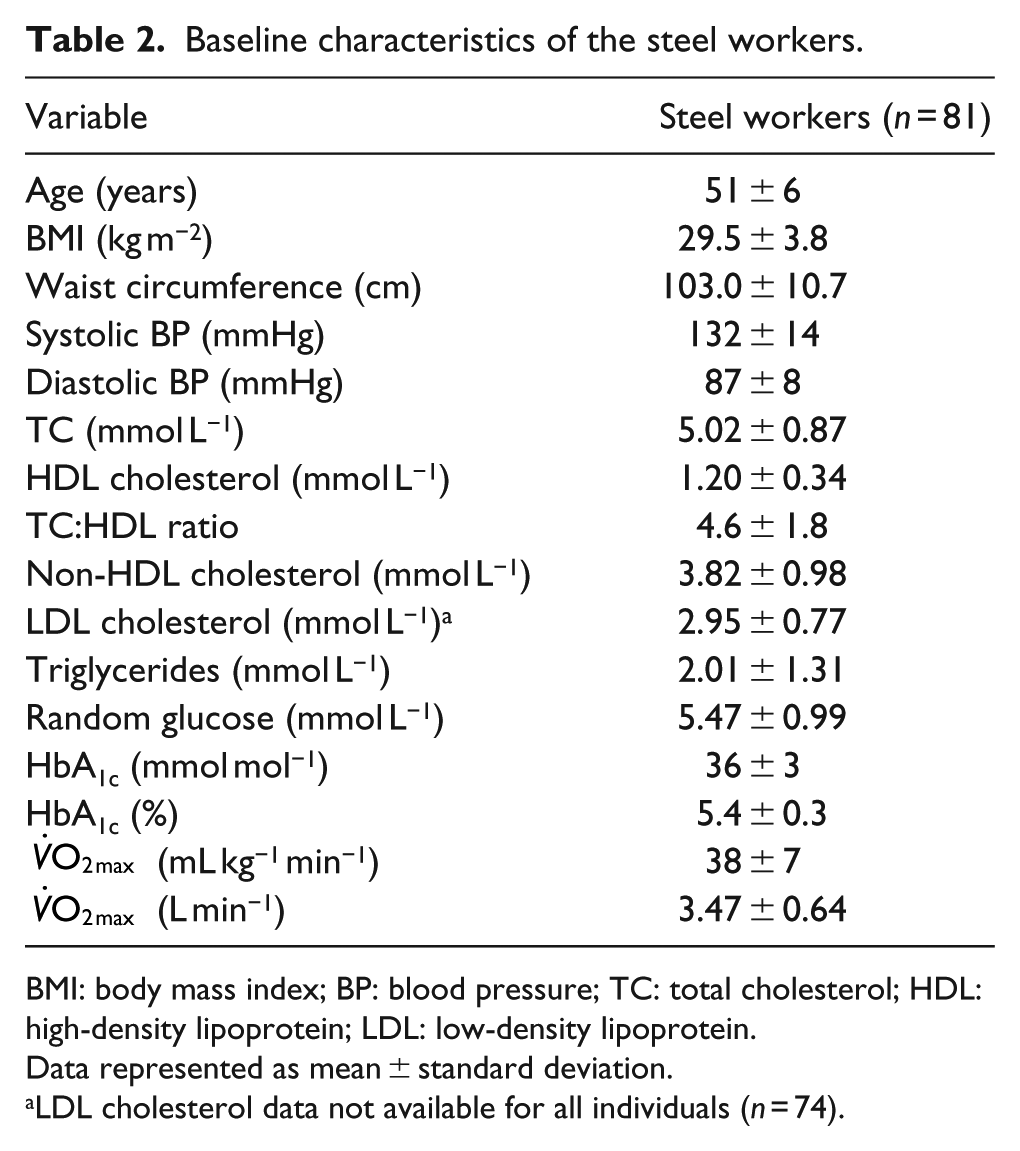
BMI: body mass index; BP: blood pressure; TC: total cholesterol; HDL: high-density lipoprotein; LDL: low-density lipoprotein.
Data represented as mean ± standard deviation.
LDL cholesterol data not available for all individuals (n = 74).
Baseline risk prediction values for cardiovascular disease and type 2 diabetes.
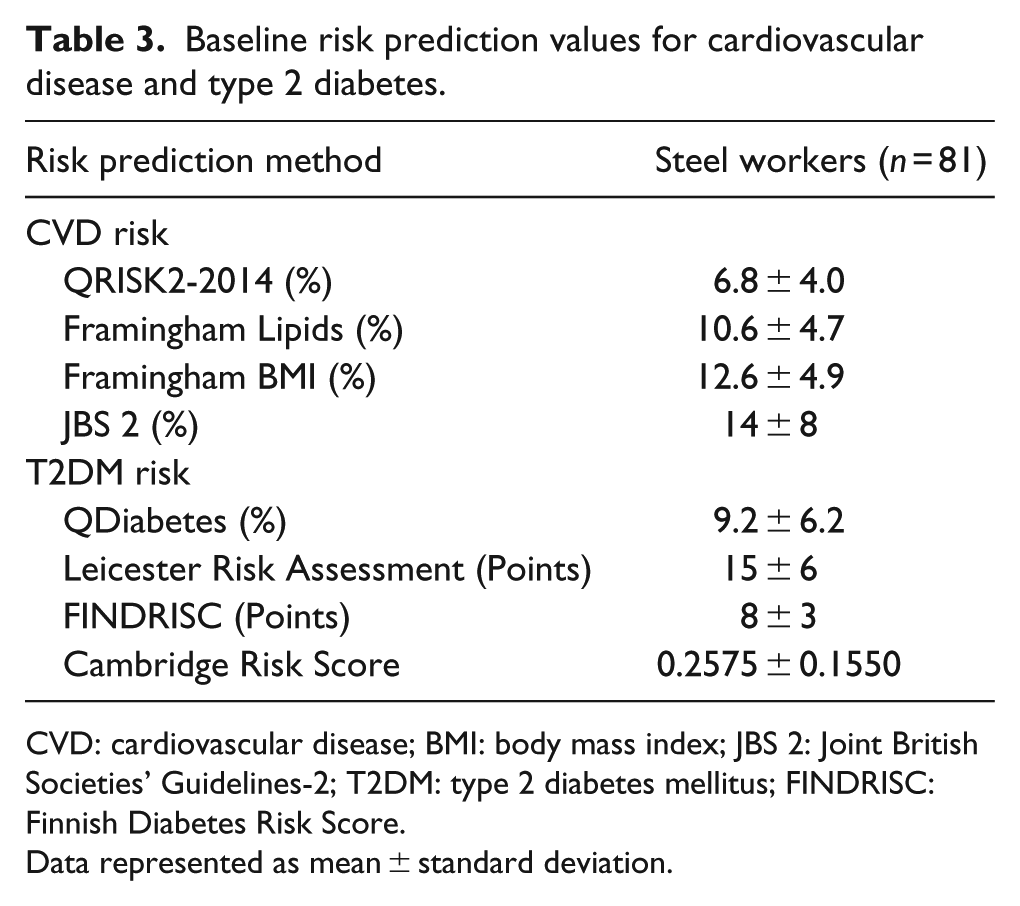
CVD: cardiovascular disease; BMI: body mass index; JBS 2: Joint British Societies’ Guidelines-2; T2DM: type 2 diabetes mellitus; FINDRISC: Finnish Diabetes Risk Score.
Data represented as mean ± standard deviation.
Risk factor and risk prediction compared by physical activity indices and cardiorespiratory fitness levels
Comparisons of baseline characteristics as detailed in Table 2 were made between both self-reported physical activity levels/indices assessed by GPPAQ (‘Active/Moderately Active’ vs ‘Moderately Inactive/Inactive’) and predicted cardiorespiratory levels (‘Excellent/Good’ vs ‘Average/Below Average’) and are shown in Table 4. Categorising employees by physical activity indices revealed between-group differences in waist circumference and triglyceride concentrations of the baseline variables only. Comparing these observations to individuals grouped by cardiorespiratory fitness levels, a greater number of clinical differences are evident. Individuals assessed at excellent or good levels of fitness were observed to have lower BMI, waist circumferences, TC, non-HDL cholesterol and triglyceride concentrations, TC:HDL ratios and HbA1c values compared to those individuals assessed at average or below average levels of cardiorespiratory fitness. The
Baseline characteristic comparisons grouped by physical activity indices and cardiorespiratory fitness categories.
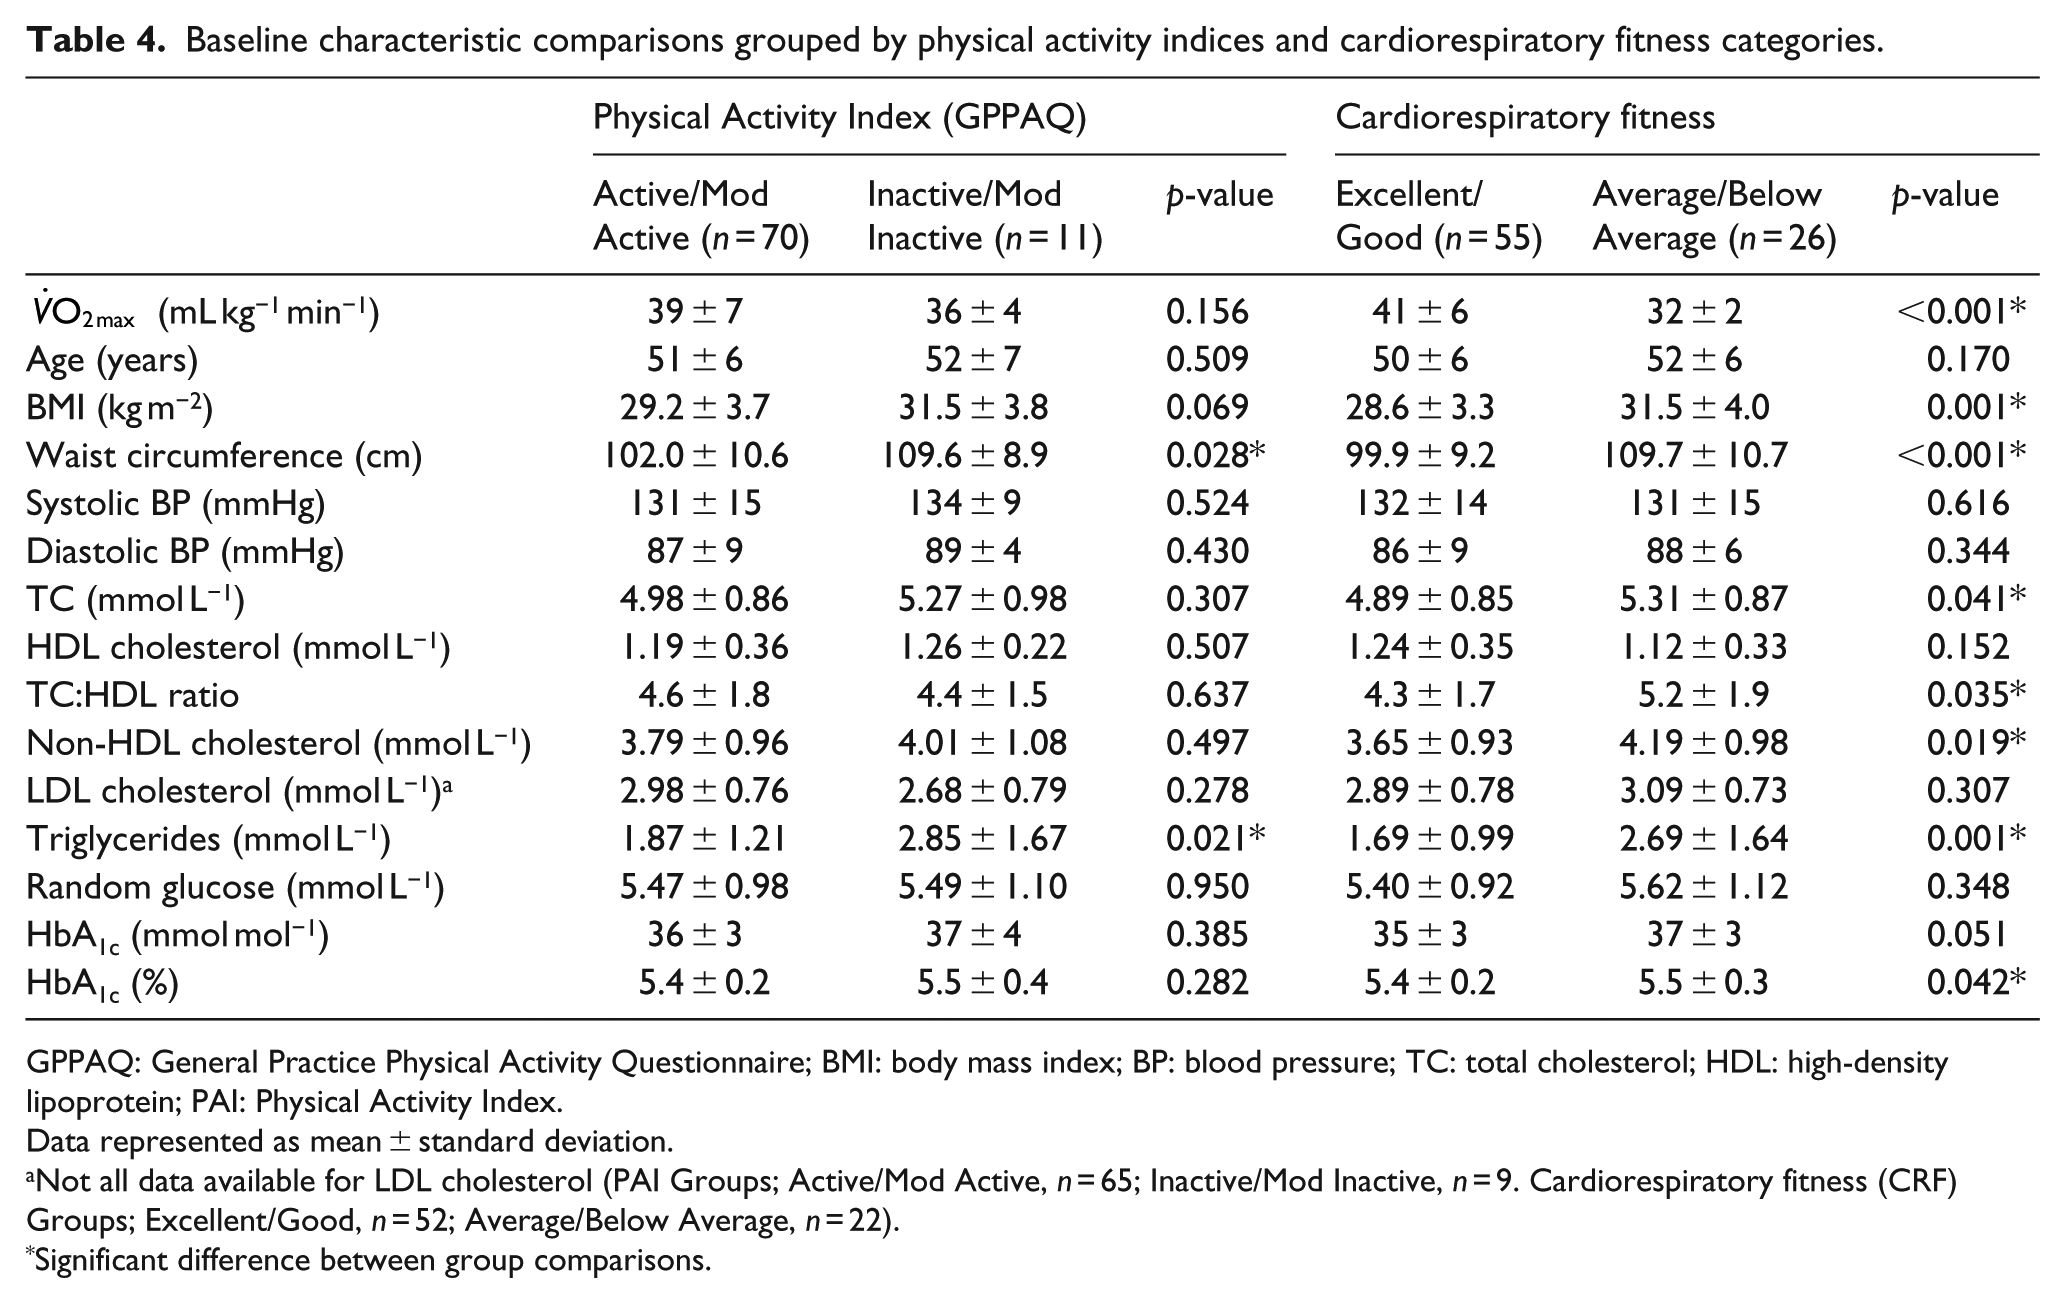
GPPAQ: General Practice Physical Activity Questionnaire; BMI: body mass index; BP: blood pressure; TC: total cholesterol; HDL: high-density lipoprotein; PAI: Physical Activity Index.
Data represented as mean ± standard deviation.
Not all data available for LDL cholesterol (PAI Groups; Active/Mod Active, n = 65; Inactive/Mod Inactive, n = 9. Cardiorespiratory fitness (CRF) Groups; Excellent/Good, n = 52; Average/Below Average, n = 22).
Significant difference between group comparisons.
In terms of risk prediction as documented in Table 5, the only differences observed between the physical activity categories were in the FINDRISC score for T2DM prediction. In regard to cardiorespiratory fitness groups, the individuals in the ‘Excellent/Good’ fitness group had a lower CVD risk as calculated by the QRISK2-2014 and JBS 2 algorithms in comparison with the ‘Average/Below Average’ fitness group. Differences in the predicted risk of developing T2DM were evident between group differences in all models of prediction. Furthermore, the risk categories of the T2DM assessments were also different between the cardiorespiratory fitness groups. The Excellent/Good group were at ‘Low’, ‘Increased’ and the second highest quintile compared to ‘Intermediate’, ‘Moderate’ and highest quintile in the ‘Average/Below Average’ group assessed by QDiabetes, Leicester Risk Assessment and Cambridge Risk Score models, respectively.
Risk prediction comparisons grouped by physical activity indices and cardiorespiratory fitness categories.
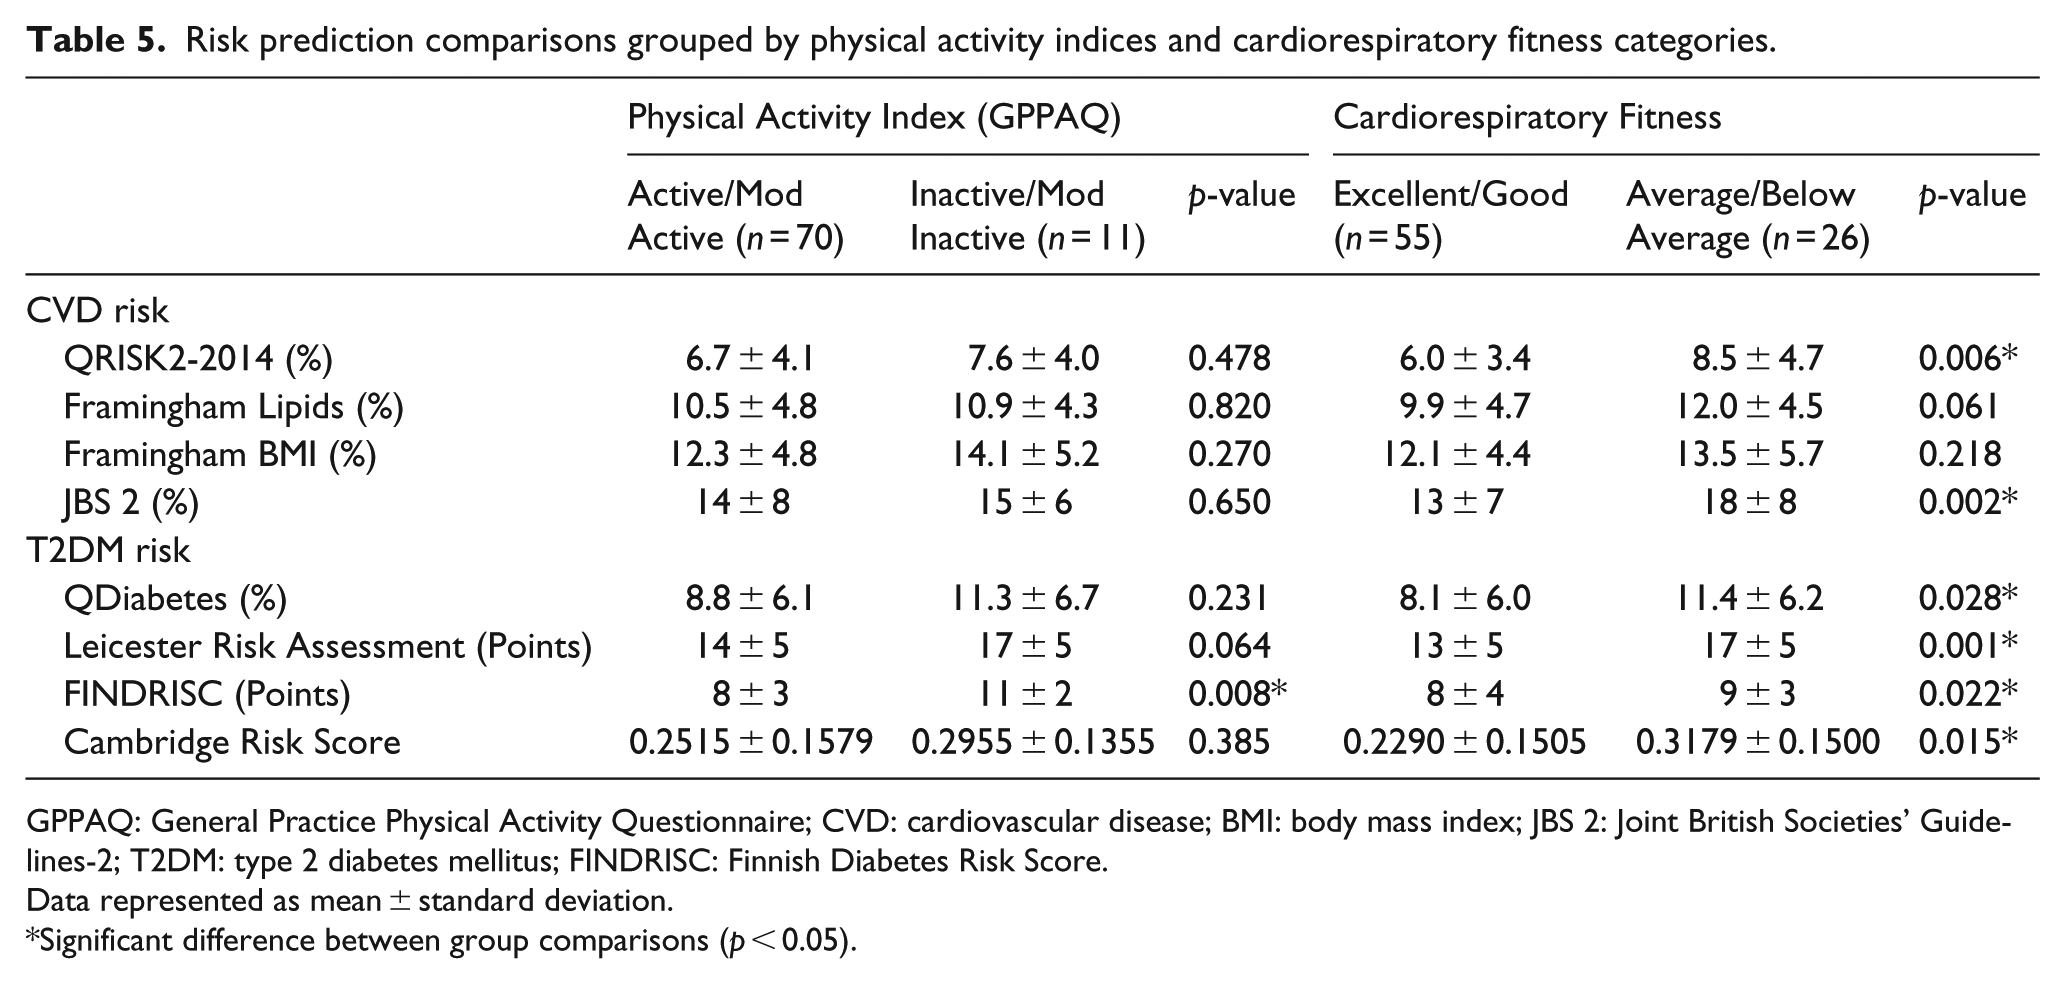
GPPAQ: General Practice Physical Activity Questionnaire; CVD: cardiovascular disease; BMI: body mass index; JBS 2: Joint British Societies’ Guidelines-2; T2DM: type 2 diabetes mellitus; FINDRISC: Finnish Diabetes Risk Score.
Data represented as mean ± standard deviation.
Significant difference between group comparisons (p < 0.05).
Relationship between cardiorespiratory fitness values and risk prediction scores
The differences observed in Tables 4 and 5 suggest that cardiorespiratory fitness rather than self-assessed physical activity levels were more sensitive indicators in determining CVD and T2DM risk. The relationships between cardiorespiratory fitness and risk prediction scores were explored in greater detail, and the individual associations between cardiorespiratory fitness values and risk prediction scores for CVD and T2DM are shown clearly in Figures 1 and 2, respectively. The relationships between cardiorespiratory fitness levels and risk prediction scores all demonstrate significant negative correlations (p < 0.01), with an explained variance of at least ~10%. The explained variance rises to between 21.4% and 31.8% in diabetes risk prediction with the adoption of the FINDRISC and Leicester Risk Assessment questionnaires, respectively.
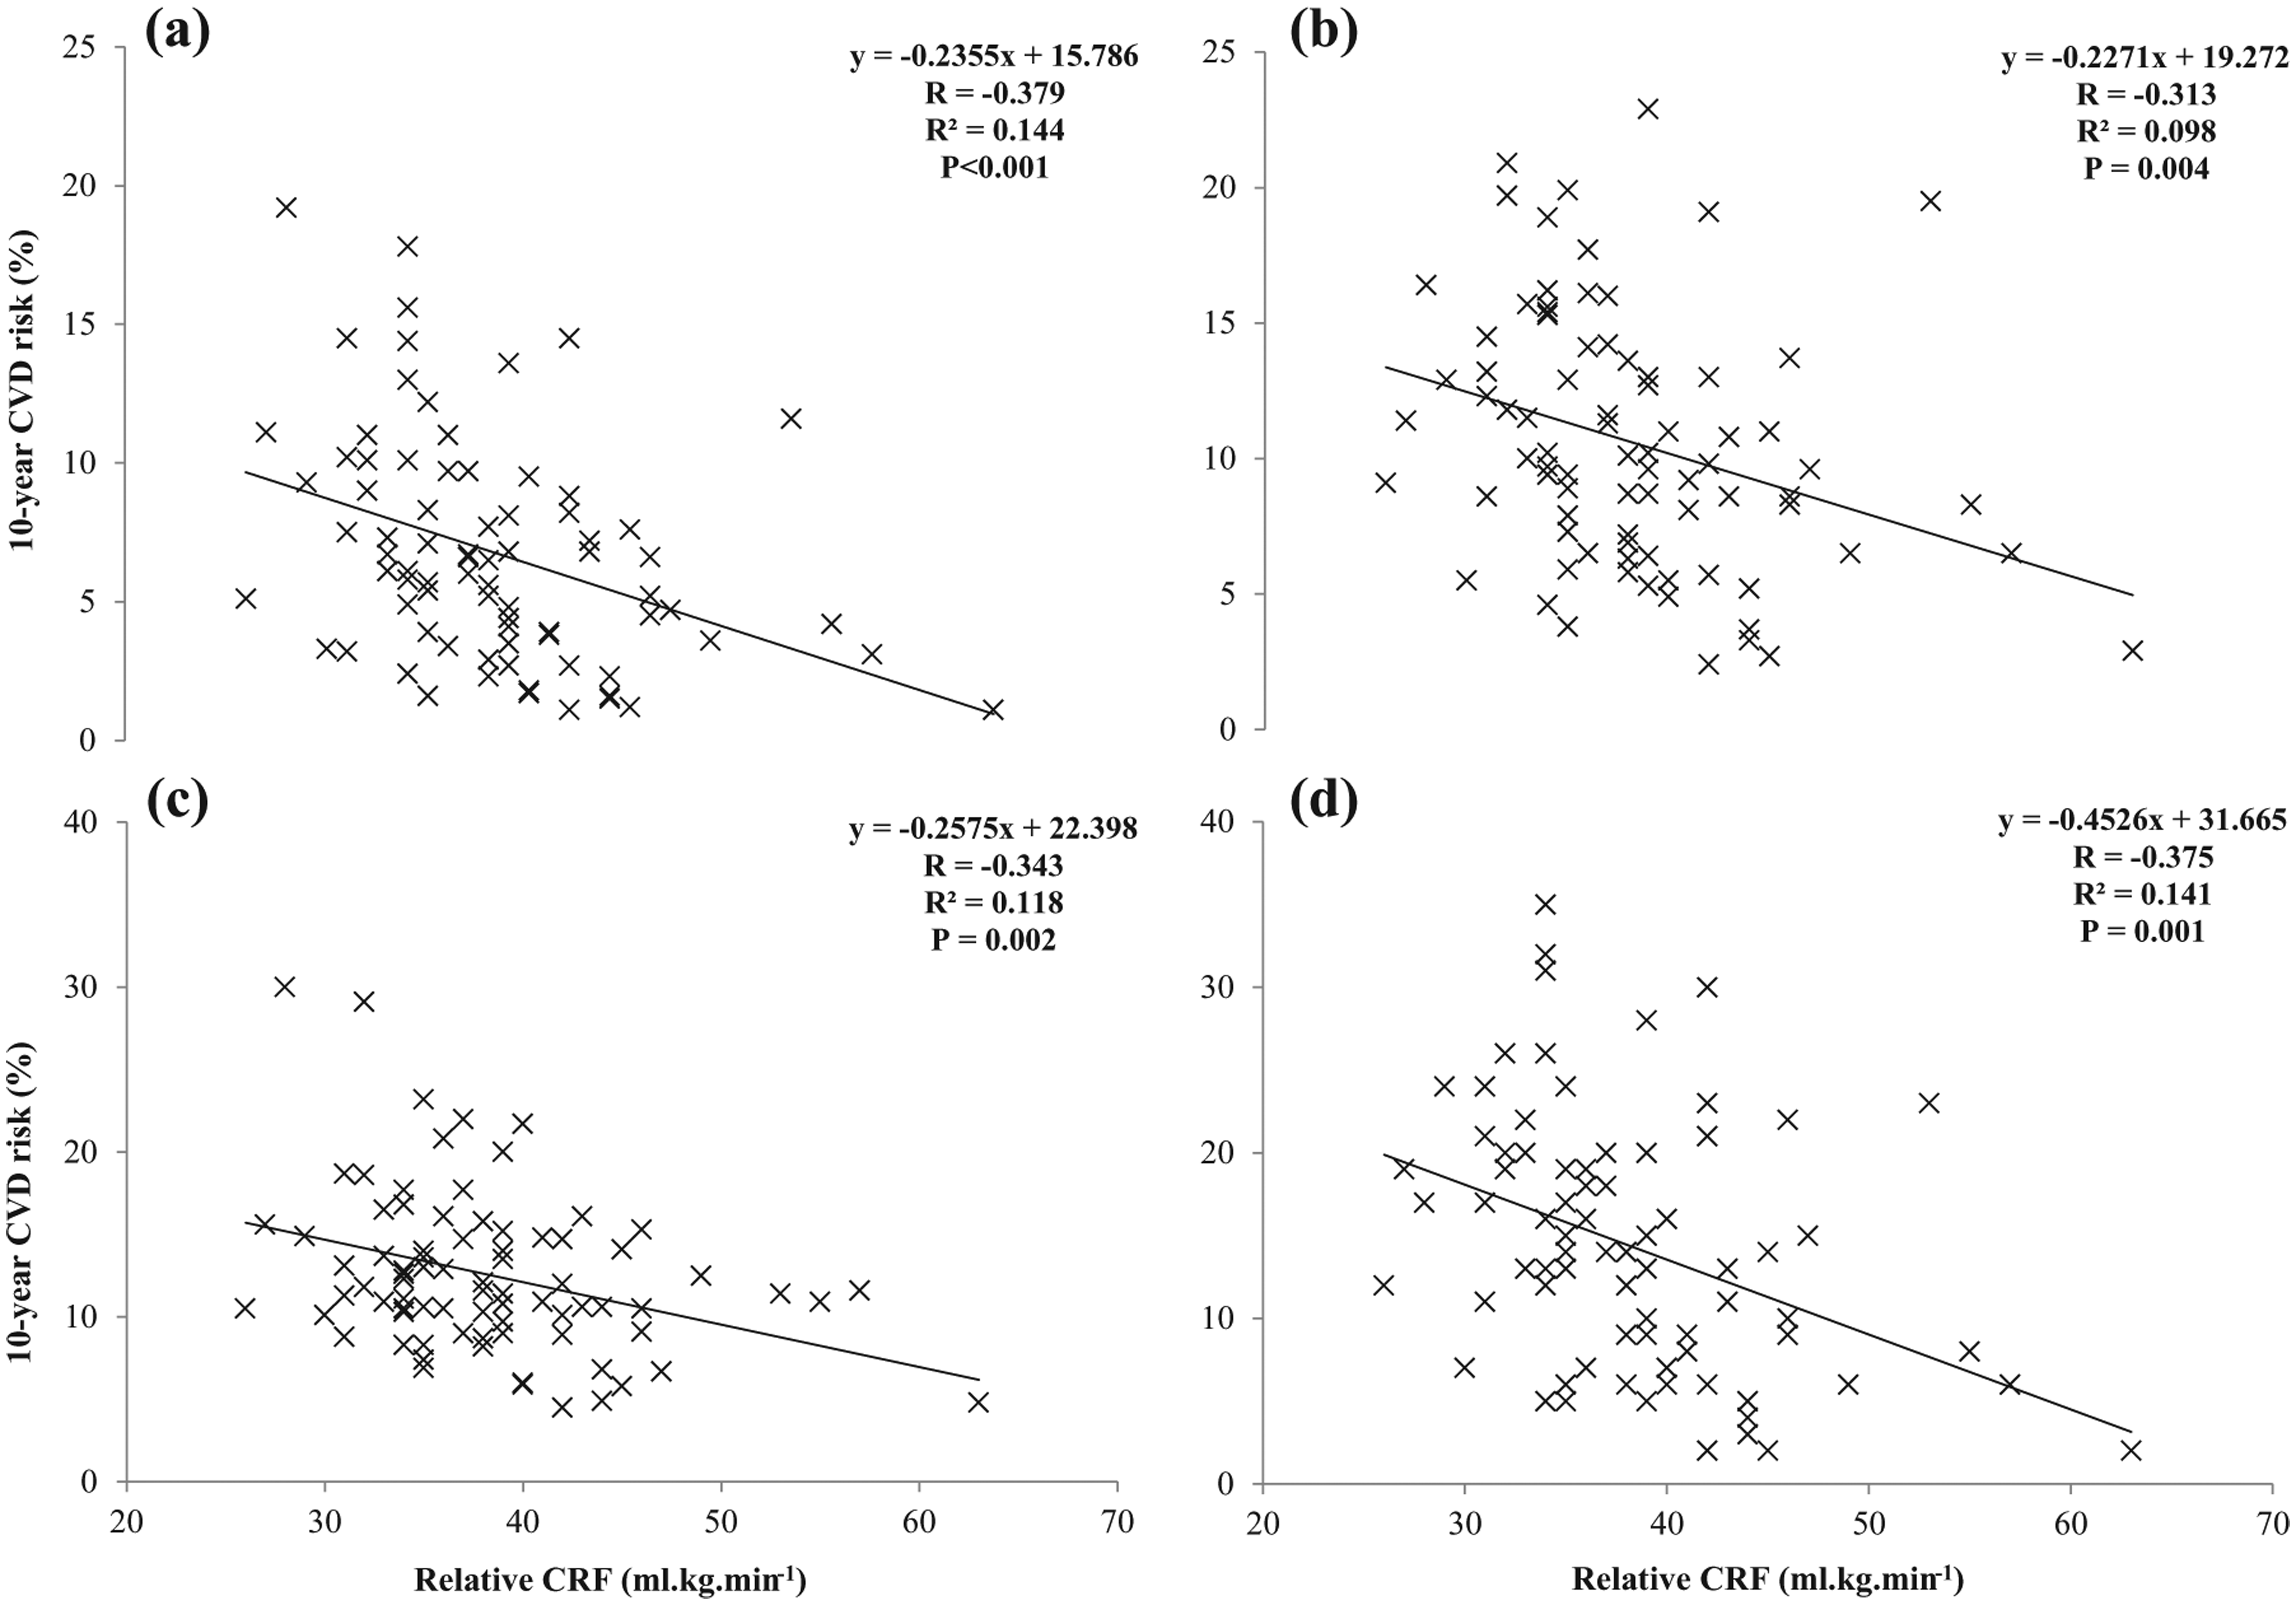
Individual relationships between relative cardiorespiratory fitness (CRF) and predicted 10-year CVD risk following the adoption of (a) QRISK2-2014, (b) Framingham Lipids, (c) Framingham BMI and (d) JBS 2 risk equations.
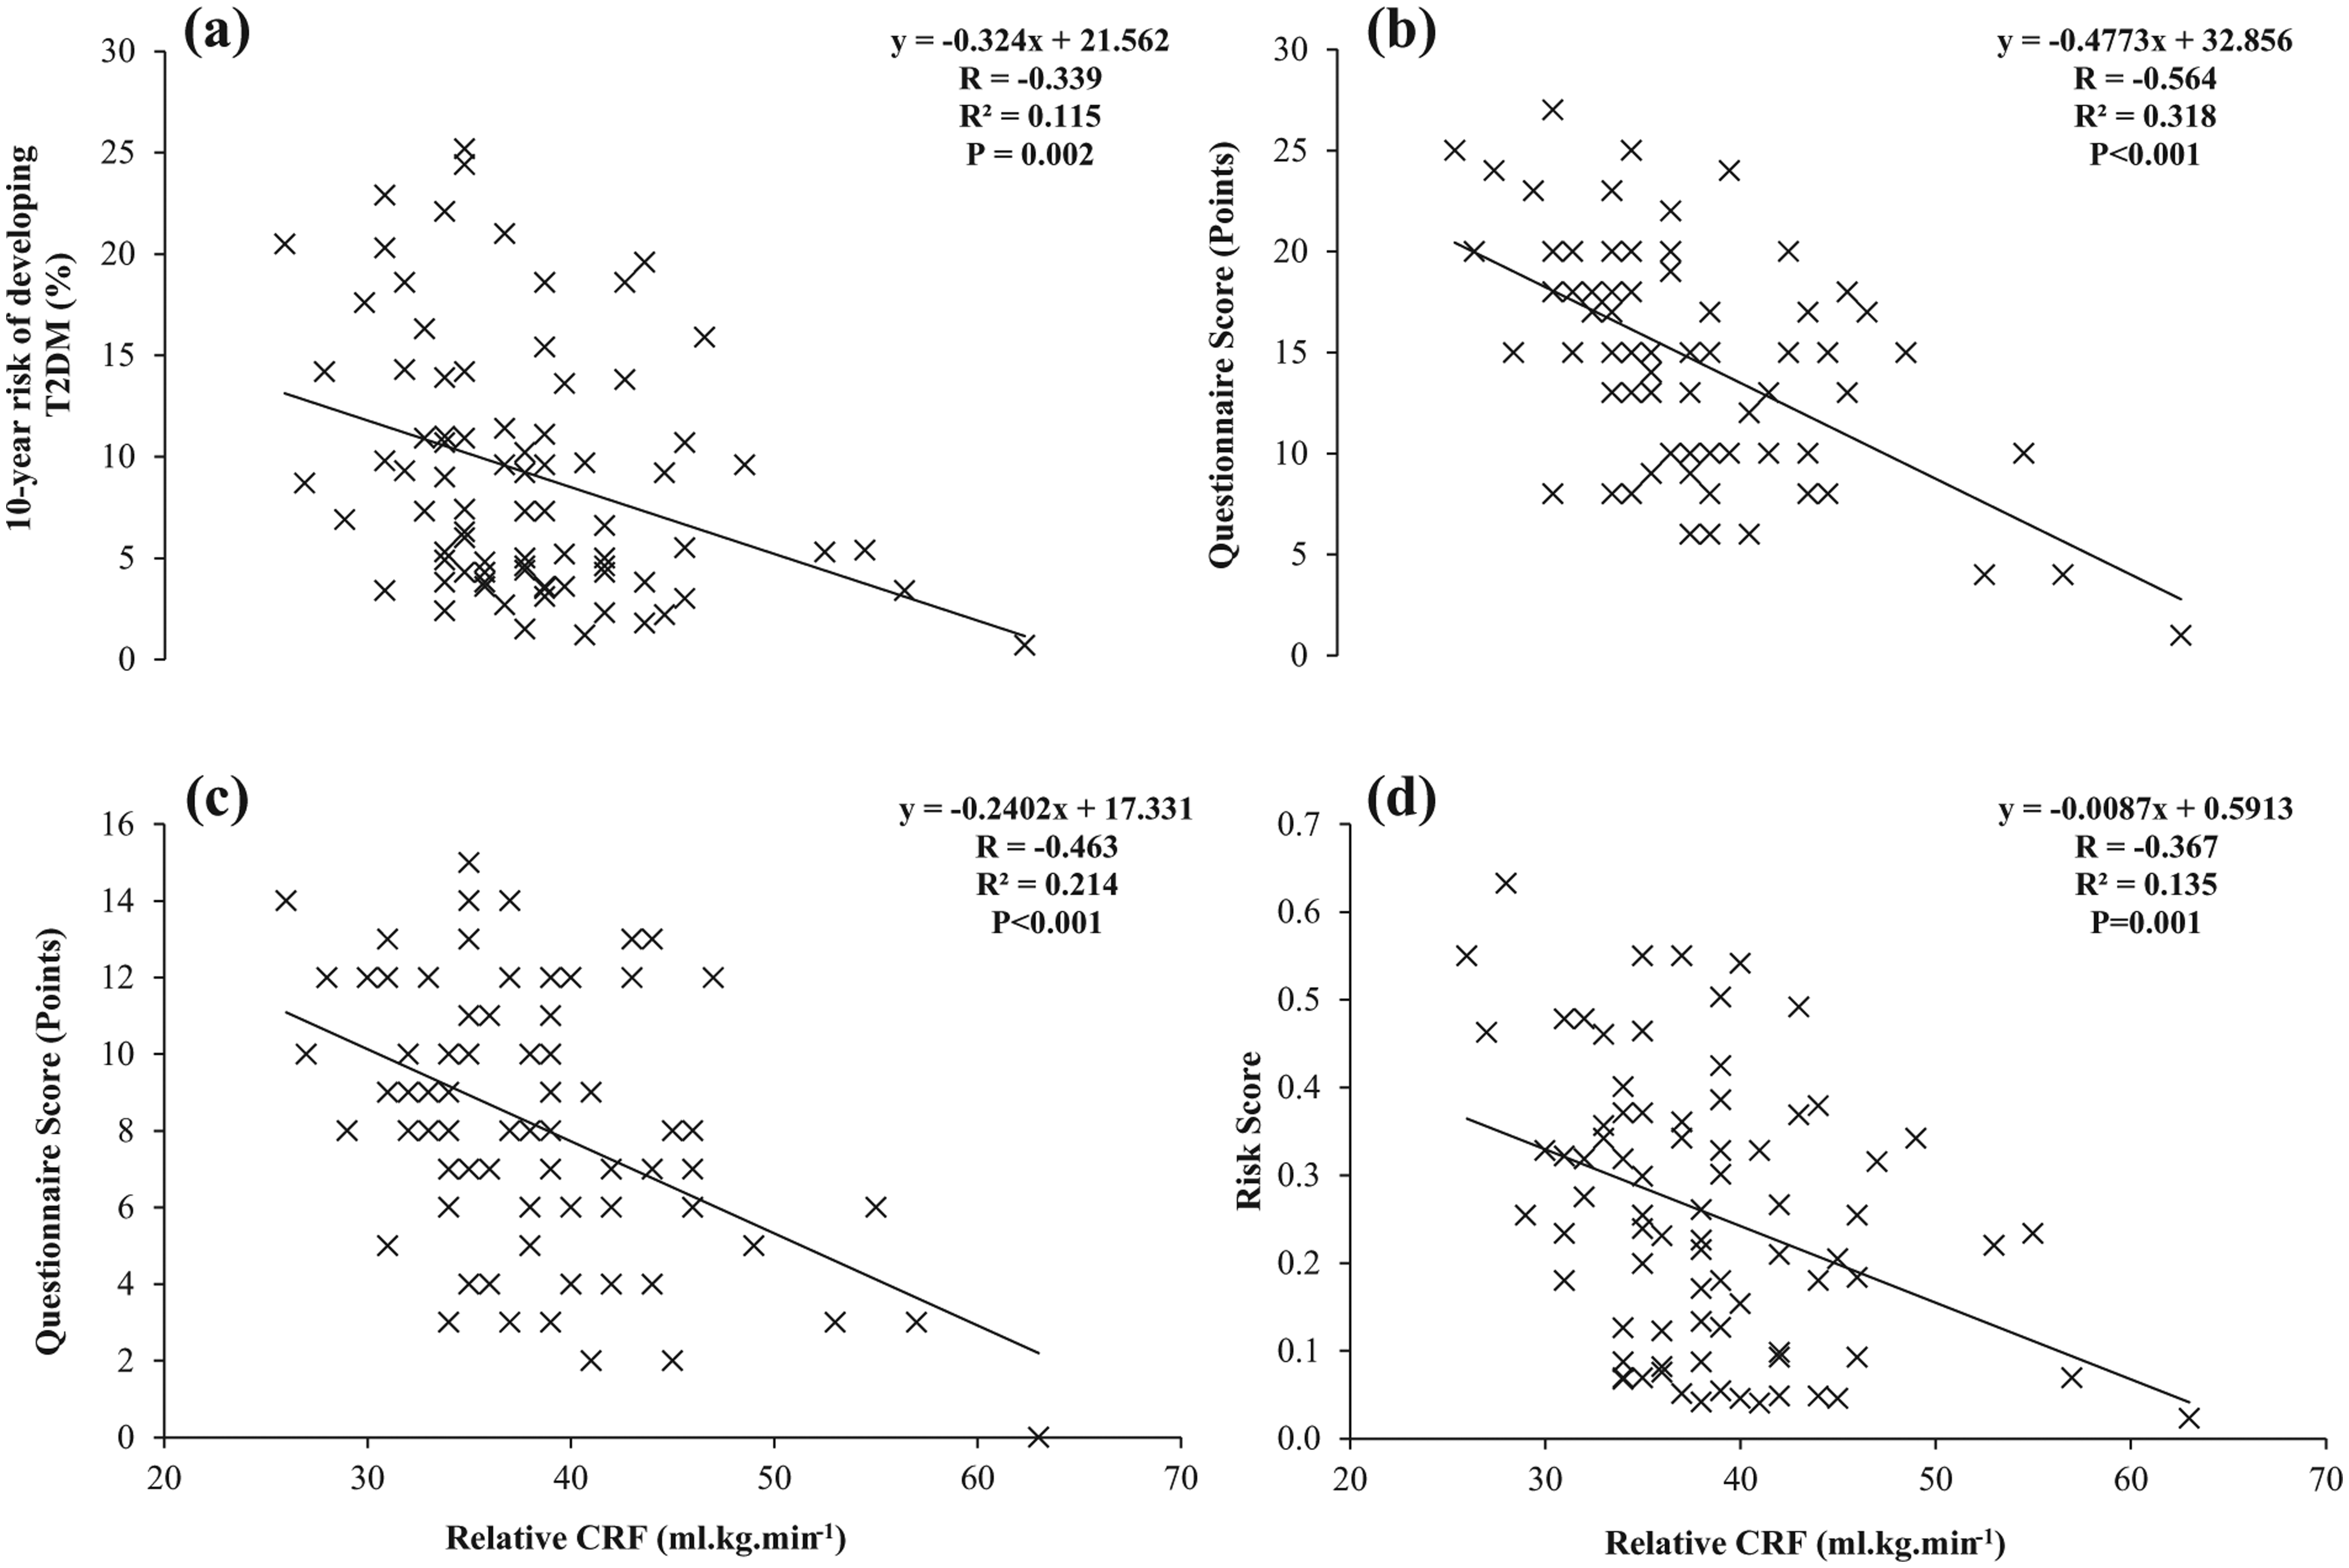
Individual relationships between relative cardiorespiratory fitness (CRF) and risk of developing type 2 diabetes assessed by the (a) QDiabetes, (b) Leicester Risk Assessment, (c) FINDRISC and (d) Cambridge Risk Score assessments/questionnaires.
Discussion
This study examined the relationships of self-reported physical activity levels and cardiorespiratory fitness to cardiometabolic variables and consequent CVD and T2DM risk prediction. Grouping individuals and making comparisons between cardiorespiratory fitness categories (‘Excellent/Good’ vs ‘Average/Below Average’) were observed to be a stronger indicator of cardiometabolic risk variables and risk prediction values than grouping individuals by self-reported physical activity indices (‘Active/Moderately Active’ vs ‘Moderately Inactive/Inactive’) as determined by the GPPAQ tool. Furthermore, cardiorespiratory fitness levels were demonstrated to have significant negative correlations between all the risk prediction models.
Our study design was not focussed on directly comparing the magnitude of association between different physical activity (or cardiorespiratory fitness) methods and markers of CVD/T2DM; on the contrary, it was an observational study that found that when we improved the sensitivity of the physical activity tool by making physical activity measures more quantifiable, it revealed more (and stronger) associations with markers of CVD or T2DM. Thus, it appears that cardiorespiratory fitness is a more accurate reflection of participation in regular physical activity and consistent with the protective benefits outlined by Thompson et al. 16 in regard to obesity and lipid profiles. Similar observations between fitness categories and lipid profiles accounting for TC, TC:HDL ratios, non-HDL cholesterol and triglyceride concentrations were documented in previous research investigating fitness and CVD risk factors in low-risk individuals.17,18 Triglyceride concentrations have also been shown to be previously negatively related to increased physical activity and levels of cardiorespiratory fitness. 19 Circulating triglyceride concentrations can be lowered by just one single bout of moderate intensity exercise 20 and therefore would offer some suggestion as to why both the physical activity and cardiorespiratory fitness groupings had lower triglyceride concentrations. The elevated waist circumference values in the lower fitness group are also consistent with previous research that has observed a clustering of metabolic risk factors in those individuals with lower cardiorespiratory fitness. 21
In regard to risk prediction, the only significant difference between groups identified by the GPPAQ comparisons was the FINDRISC scores (8 ± 3 vs 11 ± 2, Table 5). This observation is hardly surprising and can somewhat be explained by the scoring system of the FINDRISC questionnaire. The FINDRISC tool is one of the few questionnaires that account for physical activity and an individual score and additional two points for being physically inactive; therefore, it is not unexpected to observe the scoring difference between the two groups. In contrast, the cardiorespiratory fitness groupings revealed significant differences in the QRISK2 and JBS 2 cardiovascular risk equations and in all of the four diabetes risk prediction models, except for the median percentage risk calculated by the FINDRISC model. The differences in risk variables observed between fitness groups were all important components of CVD and T2DM risk models. The lower BMI values and TC:HDL ratios in the ‘Excellent/Good’ fitness group explain the observed differences in QRISK2 prediction and reduced triglyceride concentrations in combination with the TC:HDL ratio influenced the JBS 2 scores. The diabetes risk prediction models all account for BMI and in some instances the combination of both BMI and waist circumferences; therefore, these differences explain the observations in the diabetes prediction models. Age is generally regarded as the most dominant variable in CVD prediction models22,23 and is an included risk variable in each of the diabetes risk assessments examined in this study. Therefore, the clinical relevance of cardiorespiratory fitness is demonstrated in the negative relationships between relative cardiorespiratory fitness values, thus allowing for age in all of the risk prediction scores (Figures 1 and 2). We do acknowledge that there is a spread of values around the regression lines in each of the prediction tools and that the strength of the associations, although statistically significant, is fairly modest.
These observations further enhance the association between low cardiorespiratory fitness and all-cause mortality primarily due to a lower incidence of CVD and cancer first reported by Blair et al. 1 Cardiorespiratory fitness has also been shown to improve the short-term (10-year) risk of CVD mortality, 24 and this previous observation is demonstrated in the findings of this study. Furthermore, these investigations into risk prediction demonstrate that being unfit is an independent risk factor for CVD in agreement with the proposition originally suggested by Williams. 3 An association also exists between low levels of cardiorespiratory fitness and compromised pancreatic β-cell compensation across the entire glucose tolerance continuum. 25 This further highlights the protective benefits of cardiorespiratory fitness against developing T2DM which has been observed previously4,26 and the benefits heightened in those individuals deemed ‘high risk’. 26 The individuals were classified as ‘high risk’ because they were overweight, hypertensive and had a positive family history of T2DM. A positive family history of T2DM is a significant factor in diabetes risk prediction models, and this study did not adjust for this variable in subsequent analysis, thus adding further strength to the protective benefits of cardiorespiratory fitness and risk of T2DM. This study is also of clinical significance because it also translates the previously established association of cardiorespiratory fitness into the predicted risk prediction scores.
The strengths of this study have been discussed in detail; however, it is also important to consider some of the limitations to this research. The findings of this study should be treated somewhat preliminary due to the relatively small number of participants. In addition, the study population were all males aged ⩾40 years and Caucasian, which could mean that these results only apply to this demographic and are difficult to generalise to males from different ethnic backgrounds and also to females. The final perceived limitation to this research could be the use of GPPAQ to measure self-reported physical activity. A recent investigation 27 in a small number of individuals (n = 76) demonstrated that compared to accelerometers the GPPAQ had a low sensitivity and specificity (46% and 50%, respectively) in detecting moderate-to-vigorous physical activity. However, the GPPAQ was chosen for this study because of its use in clinical practice and for the inclusion of work-time physical activity in its design.
In conclusion, this study has shown that a more quantified measure of physical activity levels evaluated by cardiorespiratory fitness levels reveals a greater number of associations between cardiometabolic risk factors and CVD and T2DM risk prediction scores than self-reported physical activity indices determined by the GPPAQ tool. Future studies should further explore these preliminary findings between cardiorespiratory fitness and risk prediction in a larger number of males. This study design could also be replicated in males from multi-ethnic populations and also in females to investigate whether our initial findings can be generalised on a population scale and thus implemented in clinical practice.
Footnotes
Acknowledgements
Prosiect Sir Gâr Group: Kerry Morgan, Chris Cottrell, Vanessa Davies, Liz Newbury-Davies, Michael Thomas, Enzo M Di Battista, Lesley Street, Fiona Judd, Cindy Evans, Jo James, Claire Jones, Carolyn Williams, Susan Smith, James Thornton, Sally Williams, Rhys Williams, Sam Rice, Jeffrey W Stephens and Meurig Williams. Part of this manuscript was presented as a poster communication at the Diabetes UK Annual Professional Conference 2015.
Declaration of conflicting interests
The author(s) declared no potential conflicts of interest with respect to the research, authorship and/or publication of this article.
Funding
This work was part-funded by the European Social Fund (ESF) through the European Union’s Convergence programme administered by the Welsh Government.