
Abstract
Background:
Most patients with type 2 diabetes mellitus (T2DM) suffer from cardiovascular disease (CVD). Whether CVD risk factors have improved in those with DM with and without CVD is not established. We compared risk factor levels and goal attainment in US adults with diabetes with and without CVD.
Methods:
We examined 2403 adults (aged ≥ 18 years) in the United States with T2DM (n = 654, 27% with CVD) across 1999–2010 using the US National Health and Nutrition Examination Survey (NHANES) and evaluated control of hemoglobin A1c (HbA1c), blood pressure (BP), low-density lipoprotein cholesterol (LDL-C) and body mass index (BMI) in those with DM with versus without CVD.
Results:
The proportions controlled for HbA1c, BP and LDL-C have improved (p < 0.001) overall between 1999 and 2010, but only 24% were at goal for all three factors in 2009–2010. There were improvements in BP, triglycerides and LDL-C in those with CVD, and in those without CVD, there were also improvements in control of all parameters, although changes in mean levels of risk factors were less impressive.
Conclusion:
Despite modest improvement over time, in most CVD risk factors, only one-fourth of those with T2DM are at goal for HbA1c, BP and LDL-C, with improvements seen in those without CVD more often than those with CVD.
Introduction
Diabetes mellitus (DM) remains a significant public health and economic burden in the United States and globally. 1 Studies looking at large cohorts demonstrate that less than one-third of individuals with type 1 and type 2 diabetes mellitus (T2DM) are at goal for hemoglobin A1c (HbA1c), blood pressure (BP) or low-density lipoprotein cholesterol (LDL-C).2,3 There has always been an interest in preventing cardiovascular disease (CVD) in T2DM patients; this focus has led to several large-scale studies evaluating the role of aggressive glycaemic control in reducing the incidence of CVD events.4–7 Whether aggressive glycaemic control slows CVD progression and to what extent remains uncertain. However, control of CV risk factors such as hypertension, hyperlipidaemia, obesity and, in particular, multifactorial control of BP, lipids and glucose does improve CVD outcomes. 8 With greater attention paid towards risk factor control in the past decade, significant improvements in HbA1c, BP and lipids as well as in estimated coronary heart disease (CHD) risk of US adults with diabetes have been noted. 9 However, despite guidelines for stringent control of such risk factors, the proportion of patients managed to target is still suboptimal.10,11
Data pertaining to current levels of composite CVD risk factor control and the prevalence of risk factors in individuals with T2DM, particularly in those who also have CVD, are lacking. With recent clinical trials suggesting differential effects of intensive glycaemic control in patients with diabetes with and without CVD,4–7,12 information on risk factor goal attainment may be helpful as a reference point for future analyses of changes in treatment patterns resulting from large-scale studies. Accordingly, this study examined trends in risk factor control in individuals with T2DM in the United States over a 12-year period (1999–2010) stratified by CVD status.
Methods
In the cross-sectional National Health and Nutrition Examination Survey (NHANES) 1999–2010, we identified all adults aged 18 years and older with T2DM. In our study, T2DM was defined as any of the following: (1) a fasting glucose ≥ 6.6 mmol/L (126 mg/dL) after a 12-h fast, (2) non-fasting glucose ≥ 11.1 mmol/L (200 mg/dL), (3) use of oral anti-diabetes agents or (4) being told by a doctor they had diabetes, with the requirement of age at diagnosis of age 30 years or older, a standard for past NHANES studies involving DM.11,13
We further stratified our study population by CVD status. CVD was defined as a self-reported presence (doctor having told participant) of CHD, stroke or heart failure. LDL-C was calculated using Friedewald’s equation [LDL-cholesterol = total cholesterol − high-density lipoprotein cholesterol (HDL-C) − (1/5) triglycerides] if triglycerides were less than 400 mg/dL when fasting. HDL measurements were attained using two methods – by a precipitation method using heparin manganese (1999–2002) and a direct immunoassay technique (2003–2010). Total cholesterol was measured enzymatically after hydrolyzation and oxidation. Triglycerides were measured enzymatically after hydrolyzation into glycerol. Glycohaemoglobin was measured using high-performance liquid chromatography. BP measurements were taken using a mercury sphygmomanometer and then averaged over four measurements. Chronic kidney disease (CKD) was defined as having an estimated glomerular filtration rate (eGFR) of <60 mL/min based on the Modification of Diet in Renal Disease Study equation. 14 Detailed explanations to specimen and data collection are discussed in the Laboratory Procedures Manual. 15
Goals
Recommended or normal levels of specific risk factors, as defined by the American Diabetes Association Guidelines, 16 were noted as follows: (1) LDL-C ≤ 100 mg/dL, (2) HDL-C > 40 mg/dL (males) and 50 mg/dL (females), (3) triglycerides < 150 mg/dL, (4) HbA1c level of <7% and (5) BP < 130/80 mmHg. We also presented proportions of individuals with (1) body mass index (BMI) < 30 or 25 kg/m2 and (2) waist circumference of <102 mm for males and <88 mm for females, cut-off points for abdominal obesity as defined by metabolic syndrome criteria. 17 We also pre-specified composite risk factor control for (1) HbA1c, BP and LDL-C; (2) HbA1c, BP, BMI < 30 kg/m2 and LDL-C; and (3) HbA1c, BP, BMI < 25kg/m2 and LDL-C.
Statistical analysis
Data analyses utilized SUDAAN statistical software (version 10.0.1; Research Triangle Park, Durham, NC, USA) and SAS (version 9.1.3; SAS Institute, Cary, NC, USA) for computation of population-weighted estimates and means for projection to the US population. Weighted proportions were first calculated using SUDAAN. These proportions were then multiplied by the appropriate current population survey (CPS) total for each survey period. Mean levels of risk factors [HbA1c, systolic blood pressure (SBP), diastolic blood pressure (DBP), LDL-C, HDL-C, triglycerides, BMI and waist circumference] were examined over the 12-year period. Linear regression was used to determine the slope of the trend. We also examined the prevalence of being at goal for these risk factors. Finally, we examined the proportion of subjects at simultaneous control for HbA1c, BP and LDL-C with and without BMI. All results were then stratified by the presence or absence of CVD. Analysis of covariance (ANCOVA) was used to determine the mean levels of individual risk factors within a 2-year period across gender, race and age groups. Linear regressions were used to determine trends in mean levels of individual risk factors. A Cochran–Mantel–Haenszel (CMH) test assessed the presence of a trend in the prevalence of risk factors as well as individuals with T2DM at goal for several risk factors.
Results
A total of 2403 T2DM patients were identified across the six survey periods. Of them, 654 (27%) had prevalent CVD (projected to 17.7 million of the US population). Table 1 provides basic demographic information and trends regarding mean ages overall and stratified by sex, ethnic distribution and the proportions of persons with CVD, CHD, stroke, heart failure and CKD. Information was further stratified by the presence or absence of CVD. The proportion with CKD increased across survey periods overall (p = 0.0080) and in persons without CVD (p = 0.030).
Demographics of T2DM sample stratified by cardiovascular disease status.
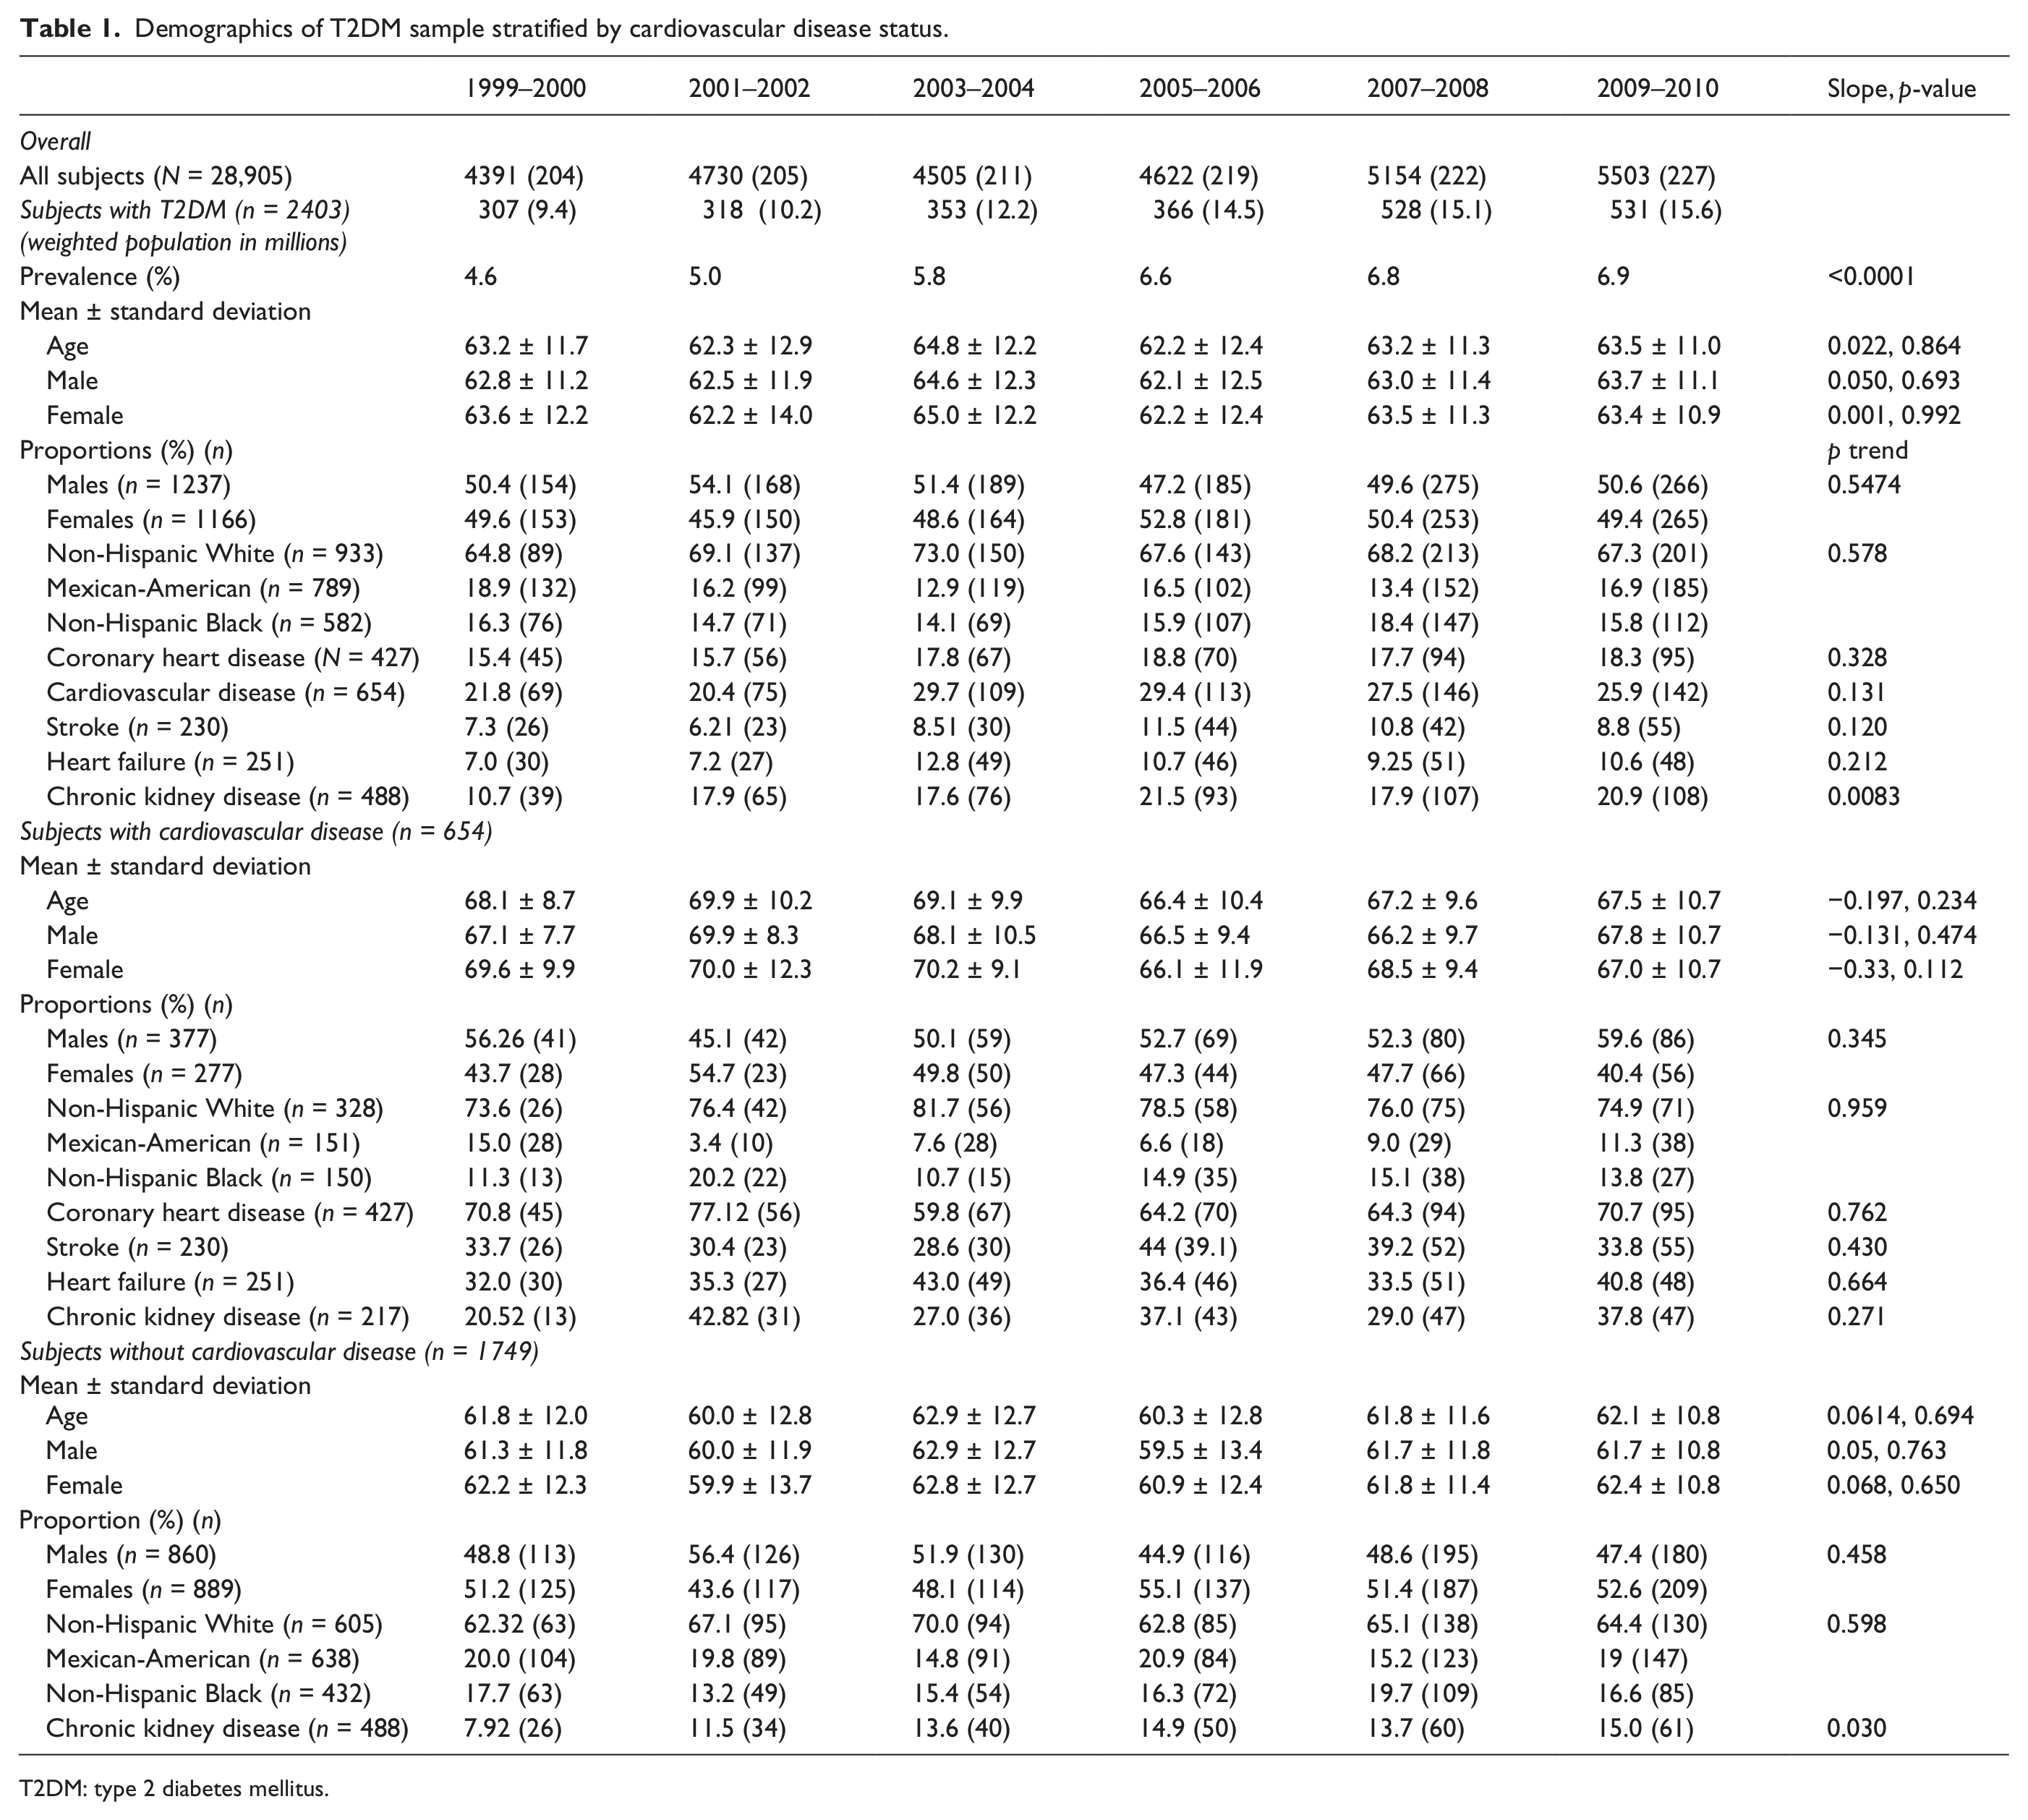
T2DM: type 2 diabetes mellitus.
Mean changes in CVD risk factors over time
Table 2 provides the mean levels of risk factors (HbA1c, SBP, DBP, LDL-C, HDL-C, triglycerides, BMI and waist circumference) across the six survey periods for the entire population and stratified by CVD status. With the exception of trends towards improvement in mean SBP and LDL-C levels and trends of worsening in mean waist circumference, there were no statistically significant changes over time in the mean levels of the individual risk factors for the whole study population. The improvement in HbA1c was close to significance. In the subgroup with CVD, there were trends towards improvement for all risk factors except BMI and waist circumference; however, none of these trends were statistically significant except those for SBP (p = 0.032) and LDL-C (p = 0.04). For waist circumference, there were statistically significant trends towards worsening except for women (p = 0.67). For the non-CVD subgroup, all risk factors showed a trend towards improvement except SBP, BMI and waist circumference; however, only the trend for waist circumference was statistically significant.
Trends within risk factors across survey periods among subjects with T2DM.
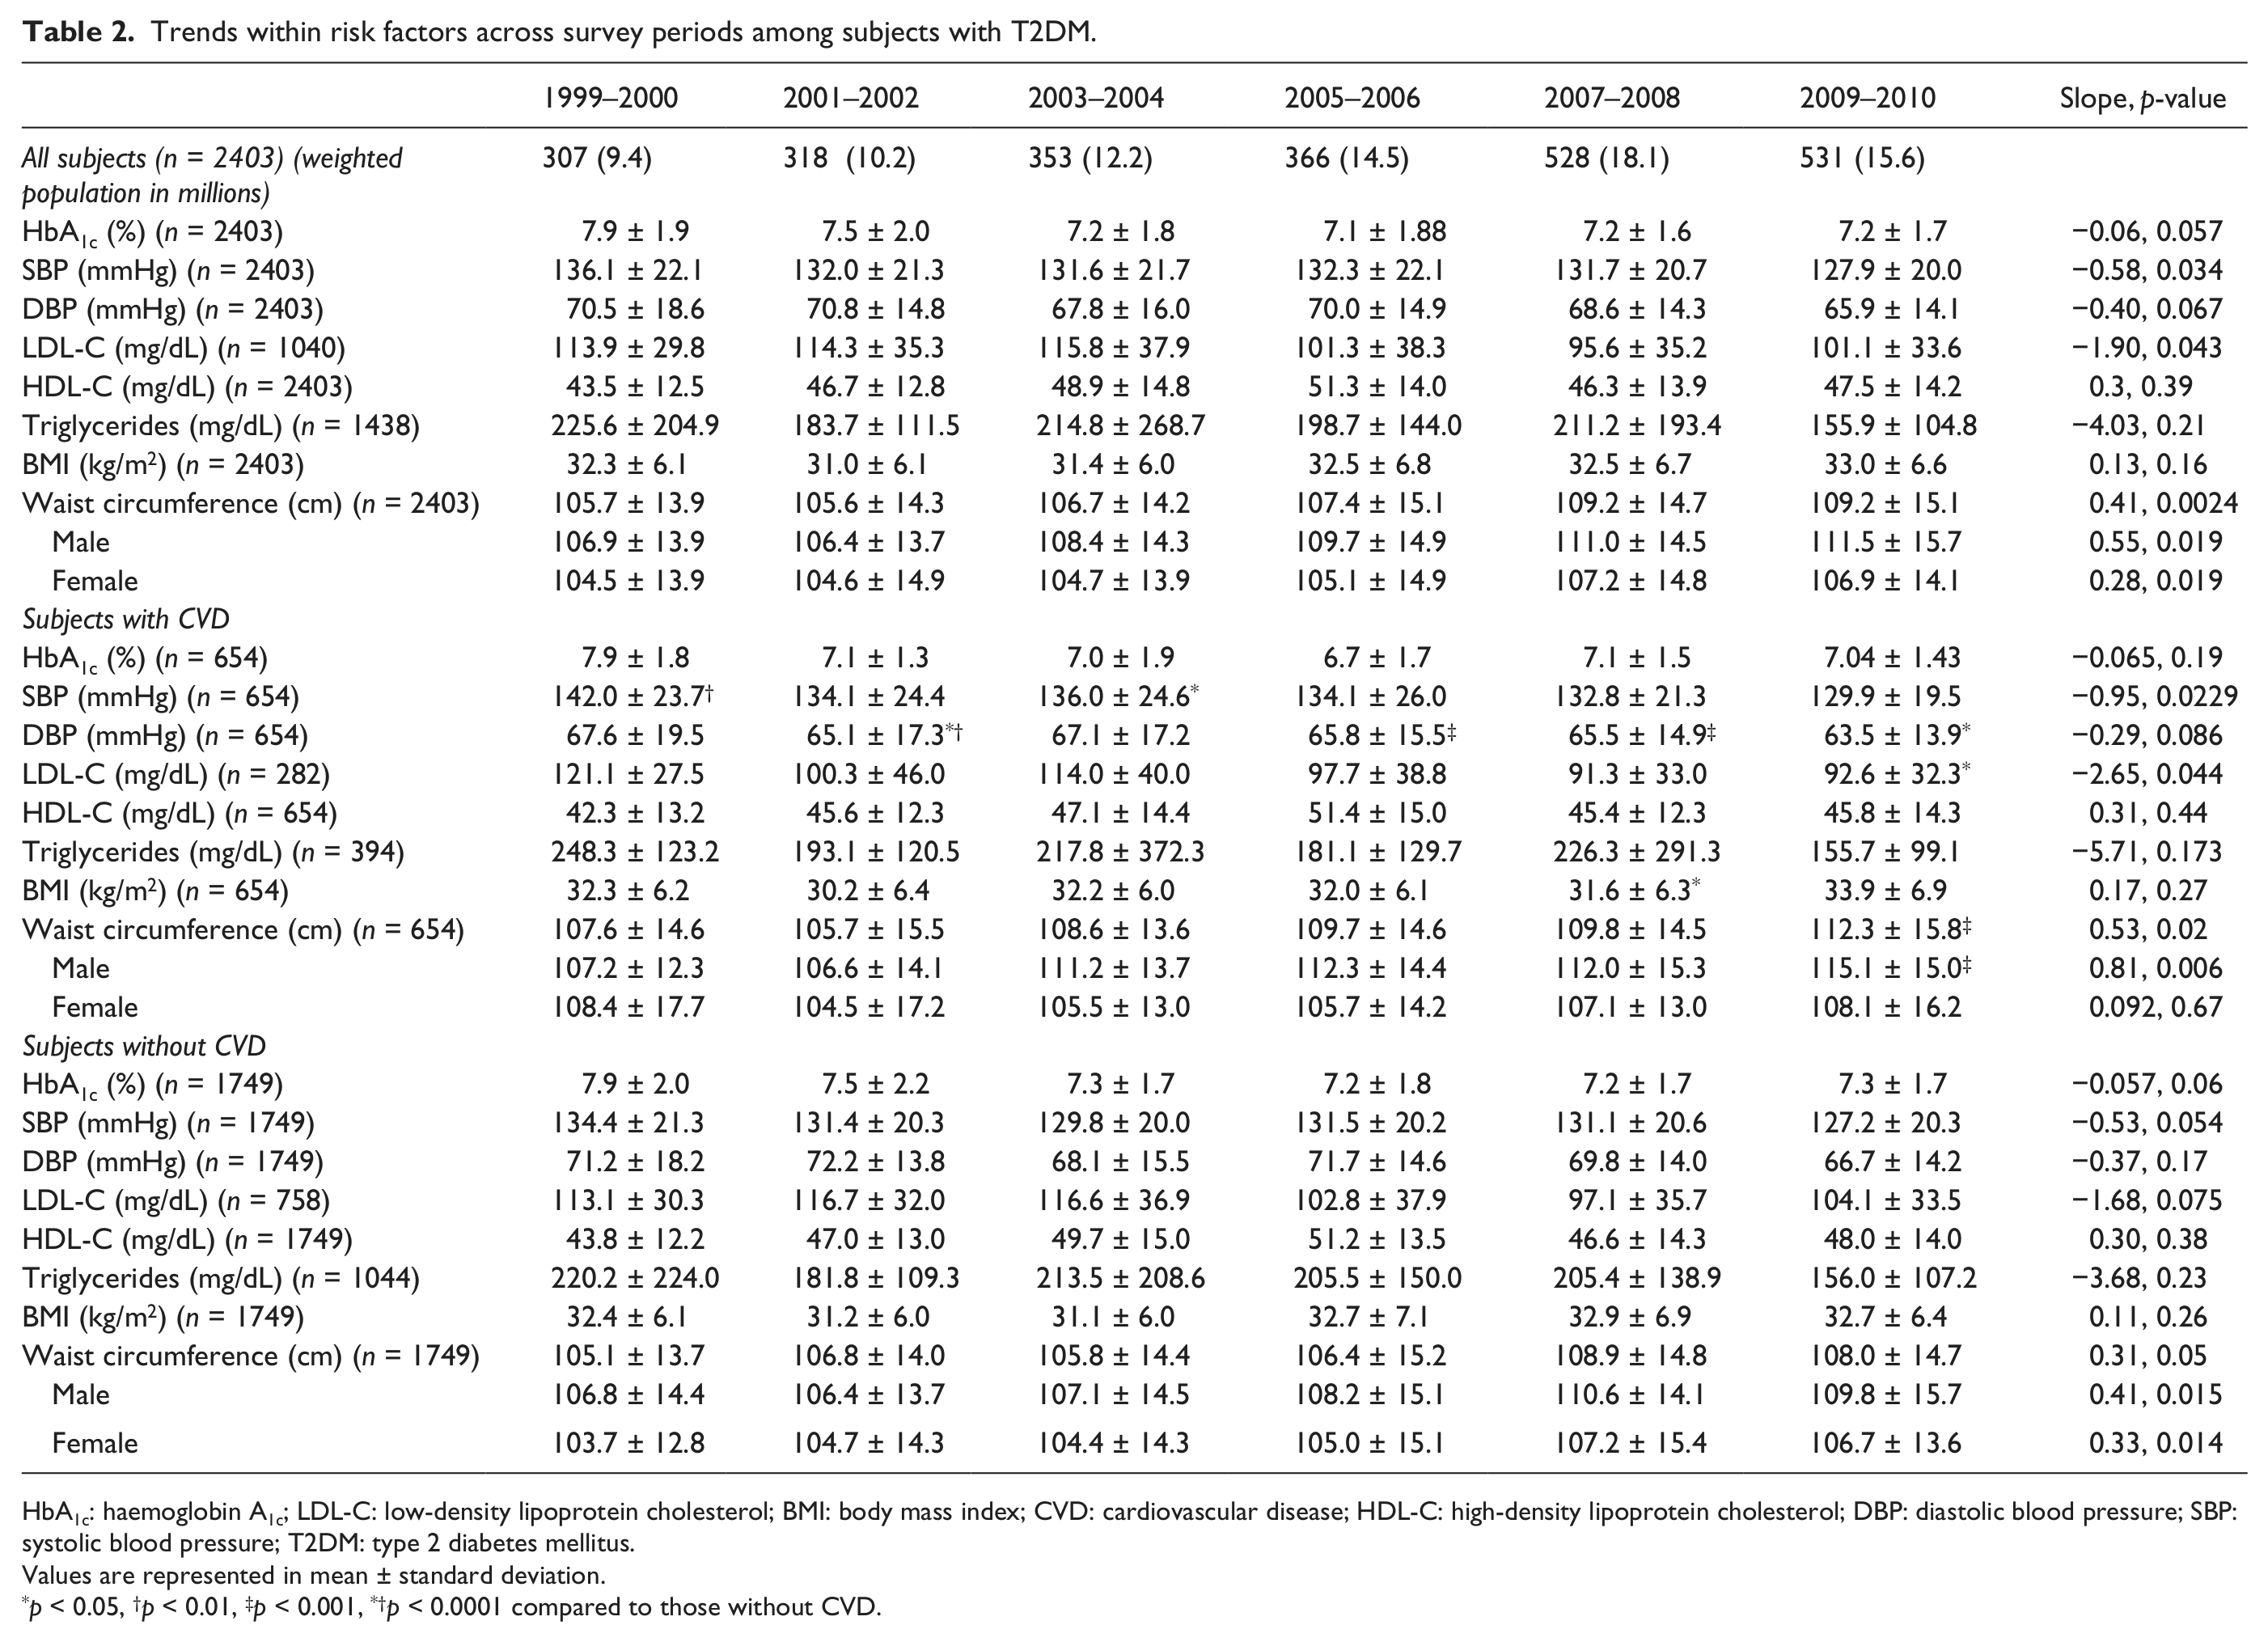
HbA1c: haemoglobin A1c; LDL-C: low-density lipoprotein cholesterol; BMI: body mass index; CVD: cardiovascular disease; HDL-C: high-density lipoprotein cholesterol; DBP: diastolic blood pressure; SBP: systolic blood pressure; T2DM: type 2 diabetes mellitus.
Values are represented in mean ± standard deviation.
p < 0.05, †p < 0.01, ‡p < 0.001, *†p < 0.0001 compared to those without CVD.
Proportion of patients at goal for individual CVD risk factors over time
Table 3 shows the prevalence of individuals being at goal for individual risk factors across each survey period. For the entire population, there were statistically significant improvements in all risk factors except for the markers of body weight/habitus, BMI < 25 kg/m2 (p = 0.051). An absolute change of 15% or greater improvement in proportions at goal were observed for HbA1c, BP, LDL-C, HDL-C and triglycerides between the first and most recent surveys; in the case of HbA1c and triglycerides, this improvement was >20%. In the case of BMI and waist circumference, the proportion at goal declined (worsened); absolute changes were 3.8% (p = 0.051) and 2.9% (p = 0.006), respectively.
Proportion of patients at goal for individual risk factors.
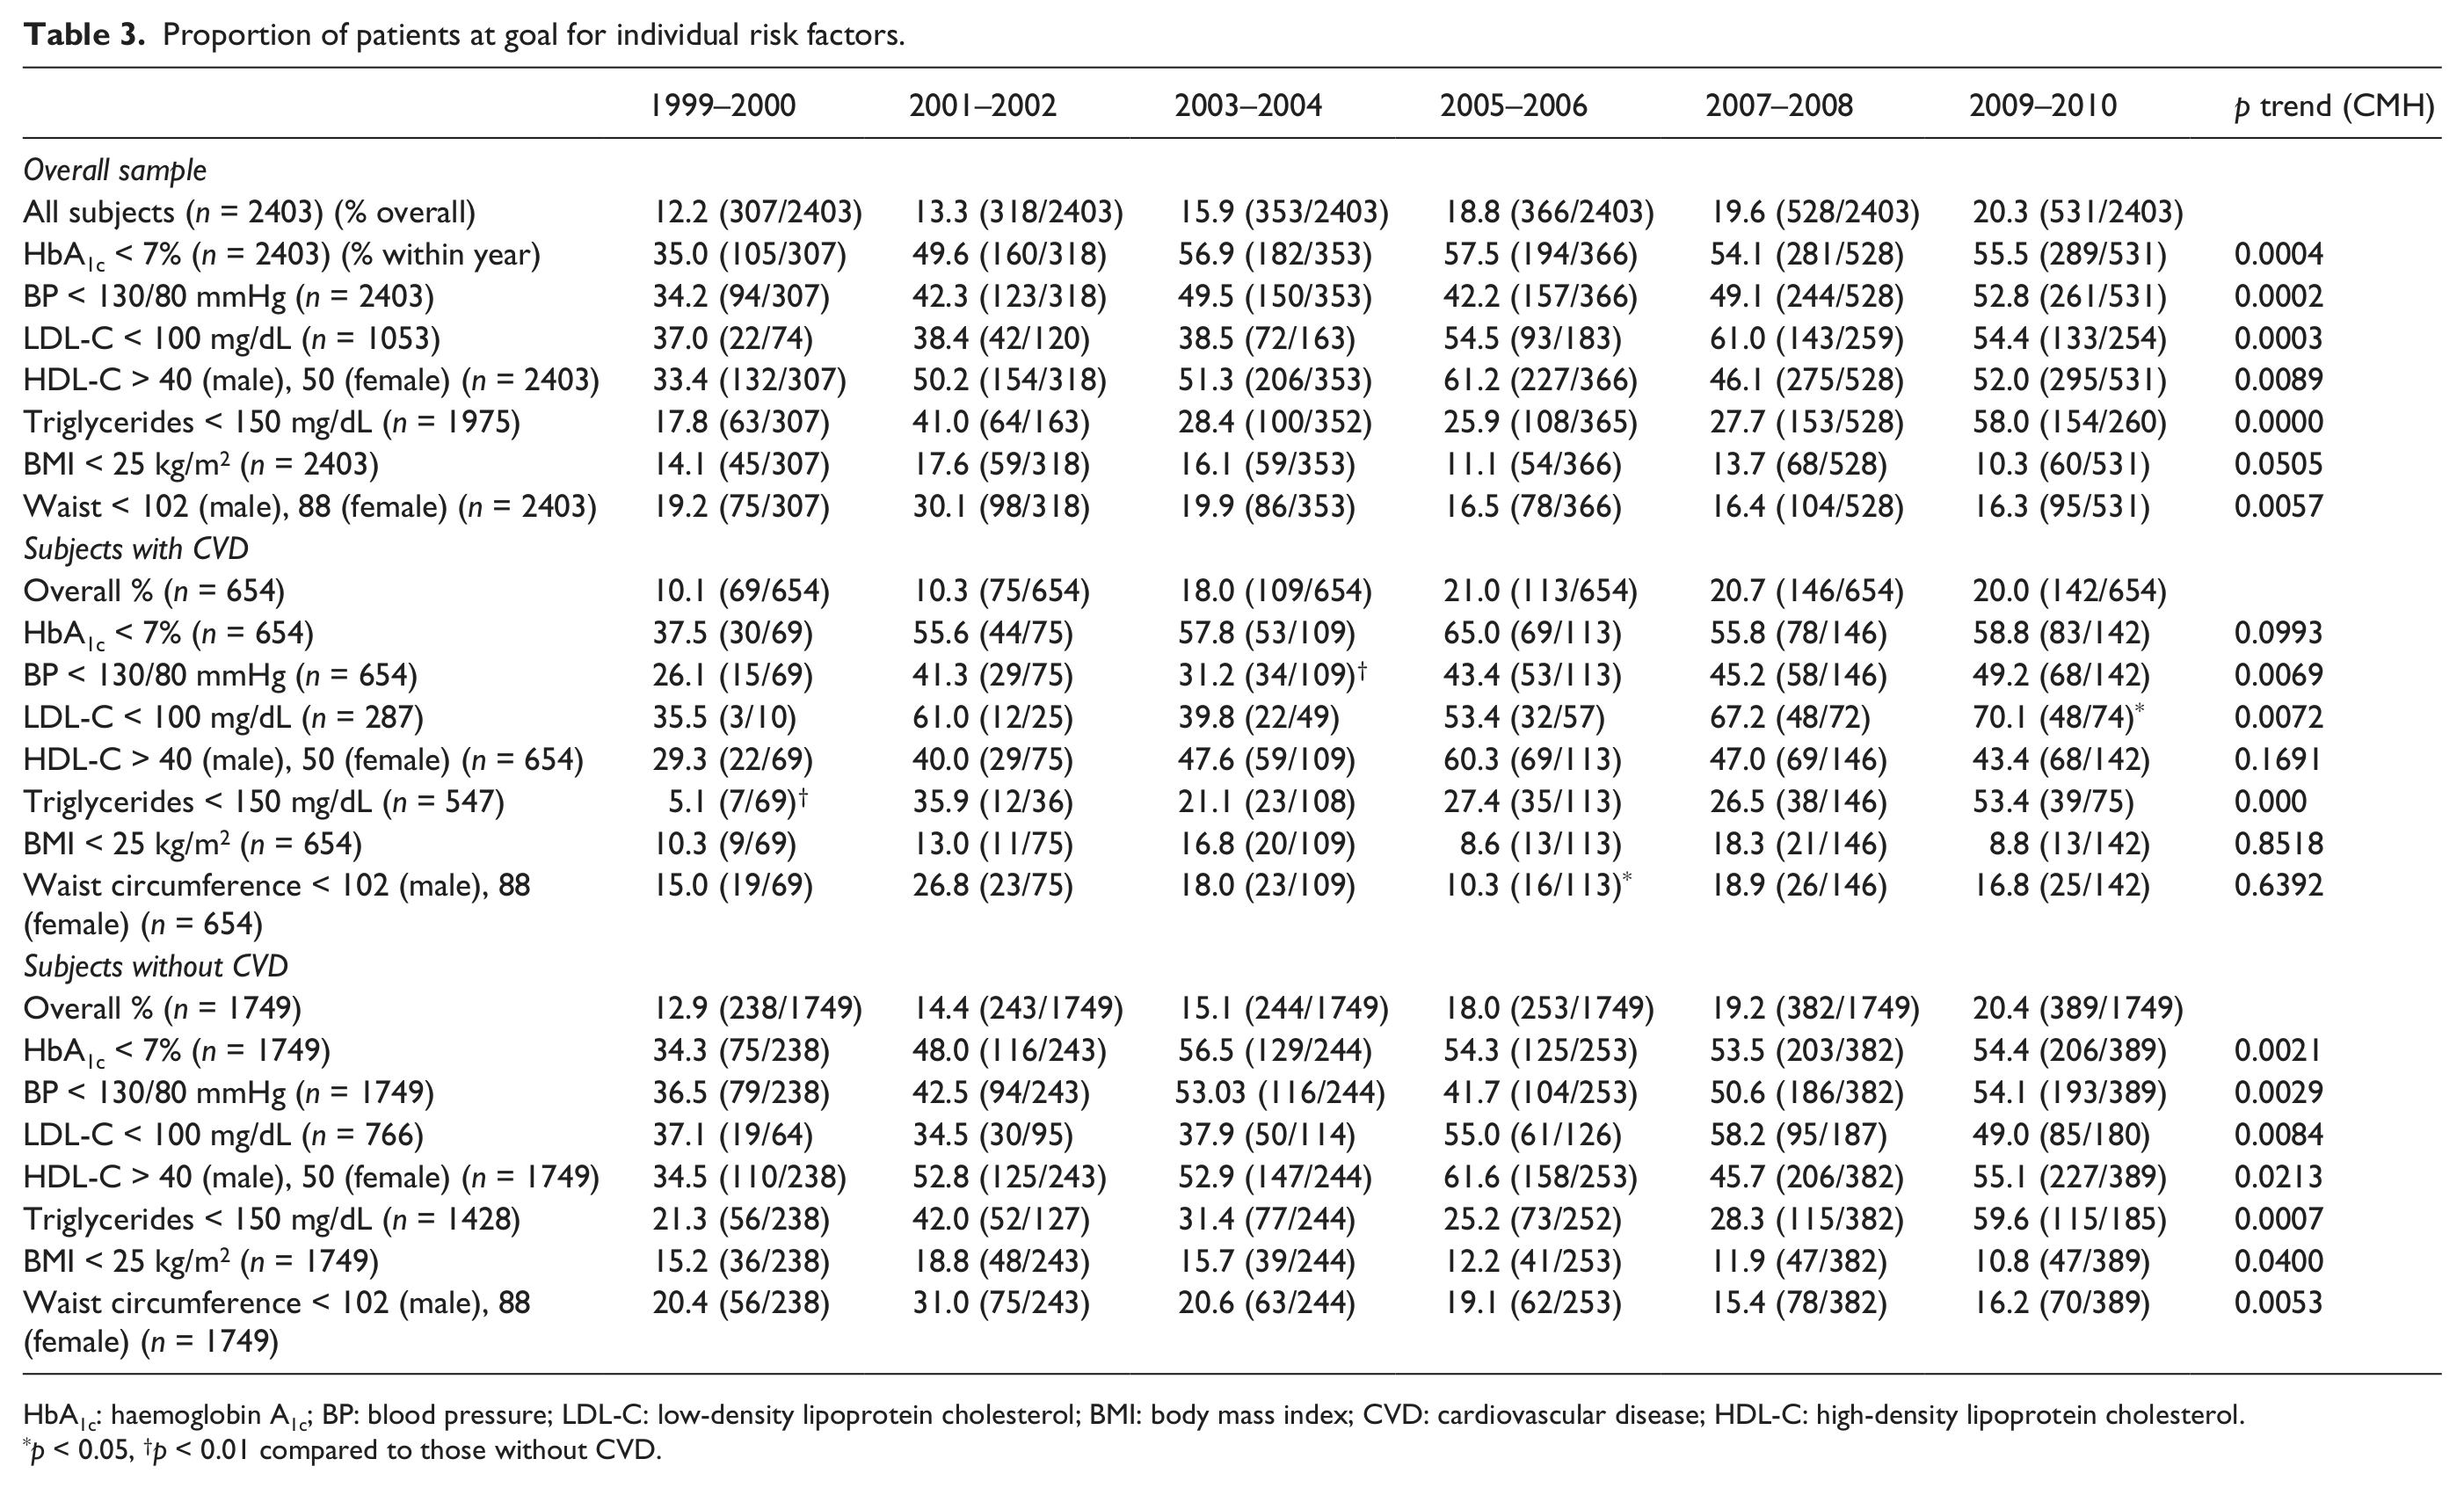
HbA1c: haemoglobin A1c; BP: blood pressure; LDL-C: low-density lipoprotein cholesterol; BMI: body mass index; CVD: cardiovascular disease; HDL-C: high-density lipoprotein cholesterol.
p < 0.05, †p < 0.01 compared to those without CVD.
In the CVD subgroup, significant improvements were seen only in BP, LDL-C and triglycerides. There was a big improvement in the proportion at goal for HbA1c and triglycerides between the first and second surveys; however, no further improvements were observed. The changes in BMI and waist circumference were only modest.
In those without CVD, there were statistically significant improvements for all risk factors except BMI and waist circumference where an overall significant decline (worsening) was observed. The improvement in the proportion at target for HbA1c was more gradual here than in the population with CVD; however, the proportions at goal during the most recent survey period were almost identical between the CVD and the non-CVD subgroups (55.5% and 54.3%, respectively). During the most recent survey period, only 11% of all T2DM individuals have a BMI < 25 kg/m2.
Proportion of patients at goal for composite CV risk factor combinations over time
Table 4 examines the proportion of individuals who are at goal for different combinations of CVD risk factors. For the study population as a whole, very few patients were at goal in any survey period for any combination of three or more risk factors. The best results were seen for the proportion at goal for the combination of HbA1c, BP and LDL-C during the most recent survey period with 24.9% of patients being at goal, a significant trend in improvement over the survey periods (p = 0.0000). Significant improvements were also observed in the combination of HbA1c, BP, LDL-C and BMI < 30 kg/m2 (p = 0.0033). However, only 8.0% were at goal during the most recent survey period, which was also the best period reported. When examining the data for a trend over the 12 years, though significant improvements were noted among individuals who achieved the composite goals [HbA1c, BP and LDL-C (p < 0.0001); HbA1c, BP, LDL-C and BMI < 30 kg/m2 (p < 0.05)], the absolute numbers at goal remain very low.
Proportion of patients at goal for composite risk factors.
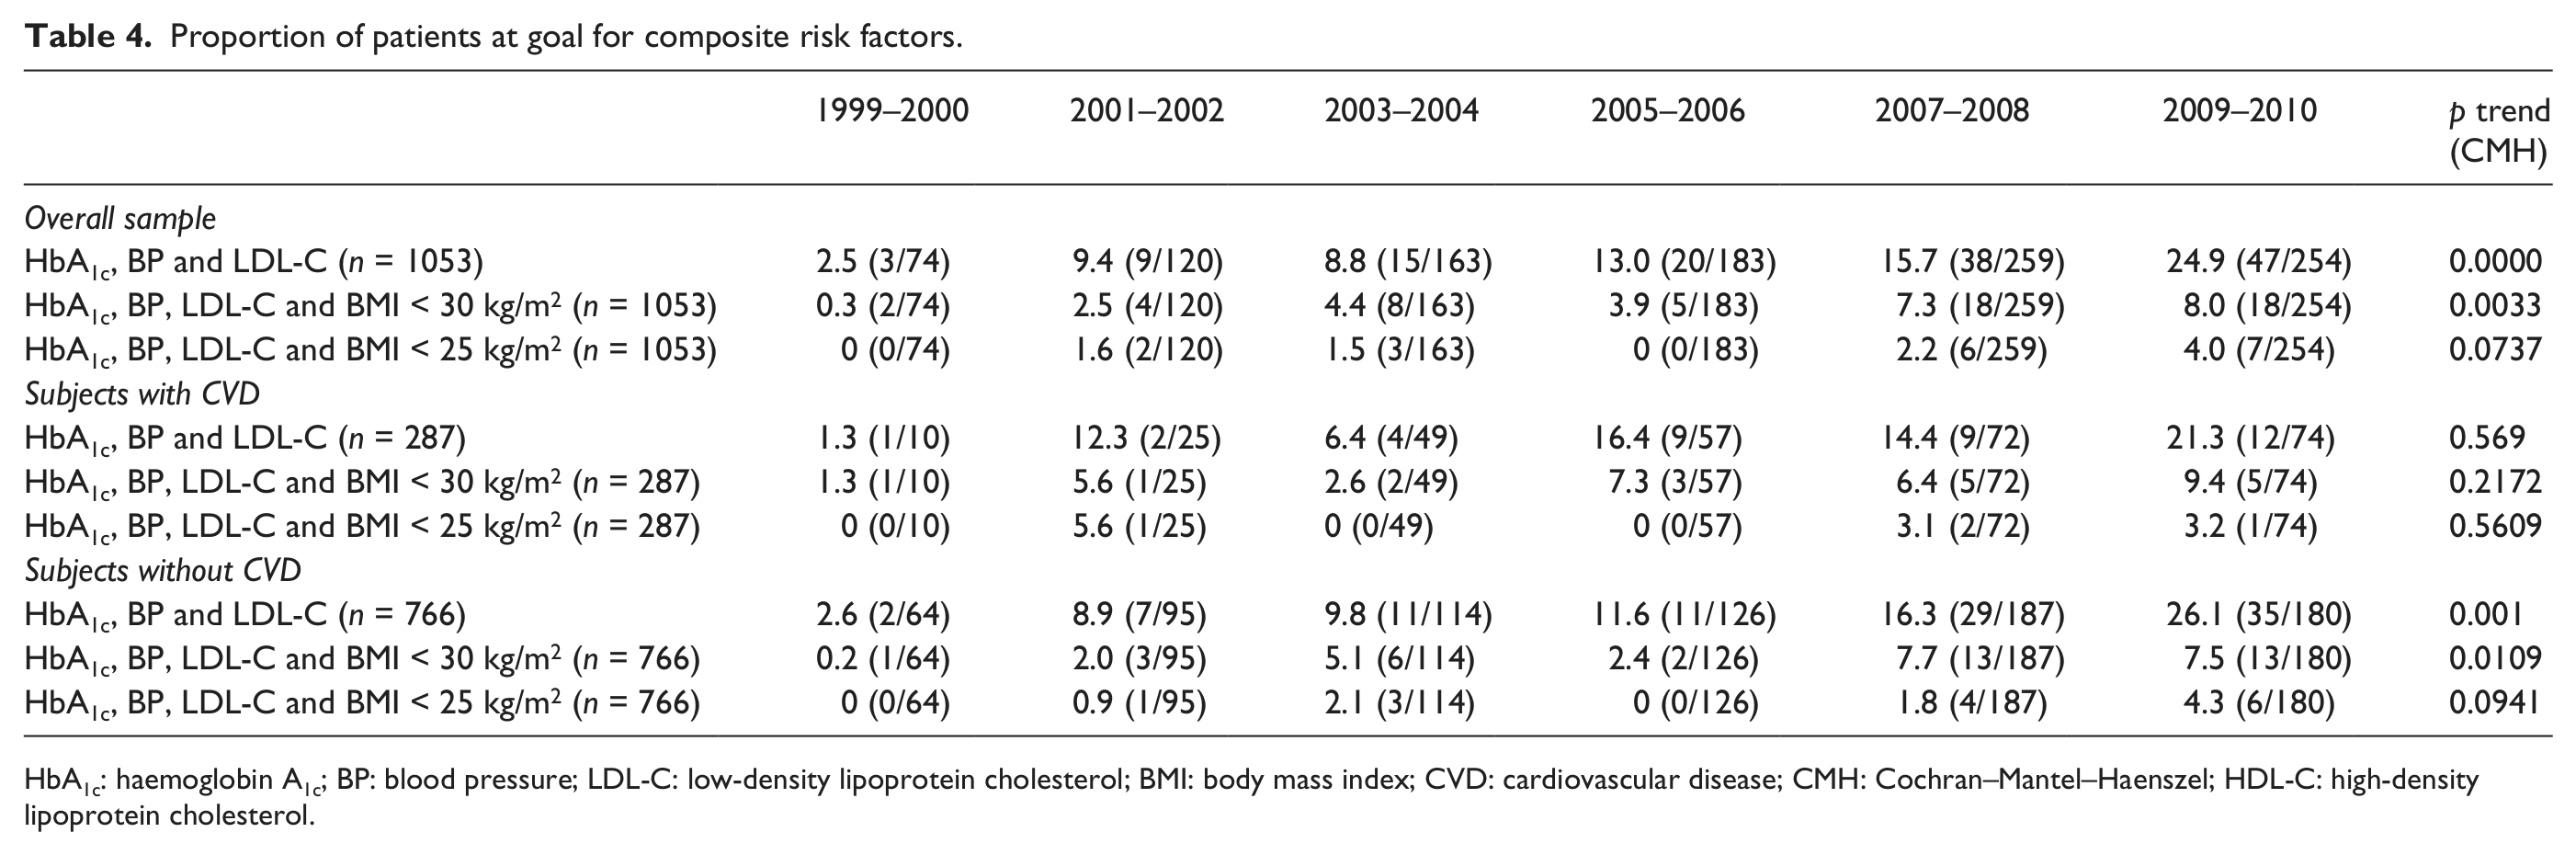
HbA1c: haemoglobin A1c; BP: blood pressure; LDL-C: low-density lipoprotein cholesterol; BMI: body mass index; CVD: cardiovascular disease; CMH: Cochran–Mantel–Haenszel; HDL-C: high-density lipoprotein cholesterol.
For the subgroup with CVD, no statistically significant tends were observed. However, the proportion at goal for the composite of HbA1c, BP and LDL-C during the most recent period was 21.3% (only 3% less than the overall), a marked improvement from earlier years. For the non-CVD subgroup, there were significant improvements in the composite end points of HbA1c, BP and LDL-C, as well as HbA1c, BP, LDL-C and BMI < 30 kg/m2. Across all three groups (overall population and the two subgroups stratified by CVD status), changing the BMI threshold to 25 kg/m2 resulted in no significant improvement for this composite.
Discussion
This report is focused on US adults with T2DM using the NHANES survey data over more than a decade (1999–2010). Recent publications indicate that significant progress has been made in improving glycaemic control among US T2DM patients, a likely result of increased awareness for screening and treatment.9,18,19 However, the proportion of patients in control for several other risk factors including weight remains dismal. In these current analyses, we were interested in understanding the trends in control of some key risk factors for CVD among diabetic patients, stratified by CVD status in the United States over a 12-year period. This question is particularly relevant because about two-thirds of those with diabetes have CVD as the primary cause of death; 20 however, recent lessons from studies such as Action to Control Cardiovascular Risk in Diabetes (ACCORD), Action in Diabetes and Vascular Disease: Preterax and Diamicron MR Controlled Evaluation (ADVANCE) and Veterans Affairs Diabetes Trial (VADT) showing lack of efficacy in reducing CVD outcomes of more aggressive treatment of A1c, BP and lipids may also impact practice patterns going forward. It is therefore important that the current trends are established as an important epidemiological reference point for future analyses. Since the analyses period covers surveys from 1999 through 2010 and the first of these three large studies was published in 2008, our results should reflect practice patterns uninfluenced by these studies.
We observe a slow but steady improvement in mean HbA1c levels over the six survey periods, with mean levels consistent with recommended guidelines through 2010; 17 clinicians may have made the judgment that more aggressive attempts to lower this may not be beneficial or safe based upon currently available medications or evidence. The results of the ADVANCE, VADT and ACCORD studies appear to have validated this judgment. But despite average HbA1c levels being satisfactory, only 56% of patients were at target for HbA1c during the most recent survey period analysed, leaving many in need of better glycaemic control. Contrasting the control between subjects with prevalent CVD and those without reveals the mean LDL-C level started off higher in the CVD subgroup in 1999–2000 (121.1 mg/dL) versus the non-CVD subgroup (113.1 mg/dL); by the last survey, the numbers were reversed (92.6 vs 104.1 mg/dL). This is consistent with a greater focus on driving LDL-C lower in people with existing CVD as part of secondary prevention. Examining the proportion at target for the individual risk factors over the survey periods shows more marked improvement among CVD patients. Important quality improvement programmes focused on patients with CHD such as Get with the Guidelines have been in part responsible for improvements over the recent decade. 21 However, still certain risk factors remain far from being optimally controlled. Approximately half of the patients remain uncontrolled for BP. We have previously reported 22 that among persons with DM who have BP not at goal, SBP remains the primary culprit, averaging 19 mmHg from goal, thus multiple medications and intensified efforts at lifestyle modifications are crucial for these individuals.
Weight remains the most poorly controlled risk factor in those with T2DM, with mean BMI remaining in the obese range (33 kg/m2) and waist circumference in the range defining abdominal obesity (averaging 111.5 cm in men and 106.9 cm in women). Only 10% and 16% of patients had BMI < 25 kg/m2 and met recommended waist circumference levels, respectively, during the most recent survey period. This has implications for long-term control of HbA1c and the development of diabetes-related complications, including CVD, CKD, retinopathy and neuropathy. 23
Even though control of other CVD risk factors improved across the six survey periods, the proportions not at target, particularly for risk factors in composite (such as A1c, BP and LDL-C together), remain unacceptably high. This represents a clear residual unmet need that future treatment options and strategies should be focused on. These analyses show that even as significant progress has been made in other risk factors, there has been a significant worsening in the proportion of patients at BMI or waist circumference goal overall; this is particularly true of subjects without prevalent CVD. Though we did not analyse the medication classes to evaluate the role of medications on this, it is well known that certain drug classes (sulfonylureas, thiazolidinediones and insulin) can result in weight gain. Although lifestyle modification remains the first step in the efforts to address weight loss/control, the licensing of weight neutral/favourable agents such as DPP4-inhibitors and GLP-1 analogues afford clinicians the ability to balance the goal of HbA1c control and weight control as treatment decisions are made. It is also important to note that a similar change in risk factors (e.g. LDL-C or BP) among those with CVD who are at higher baseline risk to begin with can result in greater absolute event reductions than in those without CVD; thus, a lesser absolute improvement in a given risk factor in those with versus without CVD could actually translate to greater numbers of events being prevented.
There are several strengths and limitations to our study. A strength is that our results based on the NHANES sample can be extrapolated to the US population because of the sample weighting used in the survey. Second, standardization of all the risk factor measurements ensures internal validity within our sample. While our sample had significant proportions of non-Hispanic Whites, Hispanics and non-Hispanic Blacks, other major ethnic groups found in the United States, notably Asians, are not included due to them not being classified in NHANES. In addition, the reliance of self-report for comorbidities, particularly CVD, is a potential limitation that could result in some misclassification, as is the absence of subclinical CVD measures to accurately capture all CVD. Finally, our results are based on risk factor goals that were in effect during the time course of the survey and results may differ should more updated goals be utilized (e.g. revised 2013 cut-off points of BP control of <140/80 mmHg).
Conclusion
In summary, our NHANES investigation has shown that while there have been overall positive improvements over the past decade in the proportion of US adults with diabetes who are at recommended levels of HbA1c, BP and LDL-C, there have been no improvements in the extent of obesity, and glycaemic control has not improved as much in those with CVD as in those without CVD. Improved outreach both to patients and healthcare providers regarding the importance of CVD risk factor control in those with diabetes, particularly among those with pre-existing CVD where control may be more difficult, is needed.
Footnotes
Acknowledgements
Dr Wong and Mr Patao have full access to all of the data in the study and take responsibility for the integrity of the data and the accuracy of the data analysis. Drs Wong and Iloeje are responsible for study concept and design. Mr Patao, Ms Wong, Drs Wong, Malik, Franklin and Iloeje are responsible for writing of the manuscript and interpretation of data. Mr Patao and Ms Wong are responsible for statistical analysis.
Declaration of conflicting interests
Dr Iloeje was an employee of Bristol-Myers Squibb when this project was done.
Funding
Dr Wong has received research funding through the University of California, Irvine from Bristol-Myers Squibb and Merck. This project was supported by a grant from Bristol-Myers Squibb to the University of California, Irvine.