
Abstract
Aims:
We assessed the associations of fibrinogen levels with cardiovascular disease (CVD) risks in people with and without diabetes, and quantified the value of adding fibrinogen to the established predictive algorithms for CVD.
Methods:
We used Cox models to analyse data from prospective cohorts totalling 33,091 adults (1006 with diabetes) who took part in British and Scottish general population-based health surveys. Discrimination was assessed through c-statistic.
Results:
During a median follow-up of 116 months, 351 deaths (119 CVD) were recorded in participants with diabetes and 4157 deaths (1167 CVD) in those without. After adjustment for age and sex, fibrinogen (per standard deviation loge) was positively associated with a 34% (26–42%) higher risk of cardiovascular disease and 30% (26–35%) greater risk all-cause mortality. These associations were log-linear, similar in people with and without diabetes (p-value for interaction ≥0.21), robust to the adjustment of additional major CVD risk factors. Adding fibrinogen to a model containing conventional CVD risk factors resulted in only modest improvement in risk prediction.
Conclusions:
The associations of fibrinogen with CVD and all-cause mortality are broadly similar in people with and without diabetes status. Improvement in predictive accuracy after adding fibrinogen to established risk factors is not clinically important.
Introduction
Fibrinogen, a positive acute phase reactant, is an important circulating clotting factor and the precursor of fibrin, 1 itself a co-factor in platelet aggregation and a determinant of blood viscosity. 1 Plasma concentrations of fibrinogen have been shown to be associated with future risk of cardiovascular disease (CVD) and all-cause mortality.2,3
A possible connection between fibrinogen levels and CVD risk was suspected nearly six decades ago, and over the last three decades, prospective studies – individual or pooled – have confirmed the increased risk of CVD with higher fibrinogen levels.2–4 These have generated interest about the possibility that modification of fibrinogen levels could be useful for disease prevention. 5
While several studies of general population groups exist, the fibrinogen–CVD relationship in people with diabetes, in whom fibrinogen levels are higher than non-diabetics, 6 has been little investigated. In the few studies conducted, there is a suggestion that fibrinogen is a more powerful risk factor for CVD in diabetics.7,8 Given this paucity of evidence and absence of large scale studies, we used individual participant data of English and Scottish Health Survey cohorts to investigate: (1) the association, if any, between fibrinogen and mortality from all-causes and cardiovascular disease in people with and without diabetes; (2) whether measurement of fibrinogen improves discrimination of these outcomes relative to risk algorithms containing established risk factors in people with and without diabetes.
Methods
Participants were 33,091 individuals (17,965 female) taken from nine prospective British studies comprising either Scottish Health Surveys (six cohorts: 1994, 1998, 1999, 2000, 2003 and 2004) and the Health Surveys for England (three cohorts: 1995, 1998 and 2003). All cohorts were representative of the general population, sampling individuals living in households in each country. Duration of mortality surveillance was between 0 and 169 months (median 116). Study participants gave full informed consent and ethical approval was obtained from the London Research Ethics Council.
The full study protocol has been described in detail elsewhere.9,10 In brief, study members were visited twice in their homes. During the first of these visits, trained interviewers collected data on demographics and health behaviours, including socioeconomic status (as indexed by occupational social class), self-reported smoking, alcohol (frequency/week) and physical activity (frequency of moderate to vigorous sessions/week). Interviewers also collected information about physician-diagnosed CVD (stroke, ischaemic heart disease, angina symptoms), other medical conditions (hypertension and diabetes) and anti-hypertensive medication (beta-blockers, angiotensin converting enzyme-inhibitors, diuretics, calcium blockers). During the second visit, conducted within a few days of the first, nurses gathered clinical data. In the seated position, systolic and diastolic blood pressures were measured on three occasions using an Omron HEM-907 with five-minute rest between each reading; an average of the second and third readings was used in the present analyses. Height and weight were measured directly by the interviewers using Chasmors stadiometers (Chasmors Ltd, London, UK) and Tanita electronic digital scales (Tanita Corporation, Tokyo, Japan), respectively. BMI was calculated using the usual formula (weight (kg)/height (m2)). Waist and hip circumferences were measured using a tape with an insertion buckle at one end. Waist circumference was measured at the midpoint between the lower rib and the upper margin of the iliac crest. Hip circumference was denoted by the widest circumference around the buttocks, below the iliac crest. Both measurements were taken twice, using the same tape, and were recorded to the nearest even millimetre. Those whose two waist or hip measurements differed by more than 3 cm had a third measurement taken. The mean of the two valid measurements was used in our analysis. Diabetes diagnosis was based on self-reported history of doctor-diagnosed diabetes at baseline.
Biochemical measures
Peripheral blood sample was collected in serum tubes and centrifuged at room temperature. All serum samples were frozen at −70°C until assay. Fibrinogen concentrations were determined with the Organon Teknika MDA 180 analyser, with a modification of the Clauss thrombin clotting method, with a coefficient of variation of less than 10%. Cholesterol was measured using cholesterol oxidase assays on an Olympus 640 analyser. All analyses were carried out in the same laboratory according to standard operating procedures by state registered medical laboratory scientific officers.
Ascertainment of disease-specific mortality
Consenting study members were linked to National Health Service mortality records, from which a death certificate was located. Classification of the underlying cause of death was based on information on the death certificate together with any additional observations made by the certifying physician. Diagnoses for primary cause of death were made using the ninth and tenth revisions of the International Classification of Diseases 11 with 390–459 (ICD-9) denoting cardiovascular disease deaths.
Statistical methods
The initial sample comprised 79,562 participants, among whom 36,723 (46.2%) had provided blood sample for fibrinogen assays. Thirteen were excluded for missing data on diabetes status assessed. Another 3621 participants who did not consent for mortality follow-up were also excluded. Therefore primary analyses were based on 33,091 individuals (17,965 female) with data available on age, sex, diabetes status and fibrinogen at baseline (Figure 1). Of these participants, 29,281 had complete data on covariates and were included in multivariable model analyses. In supplementary material Table 1 we present the baseline characteristics of study members included and excluded from the analytical sample. Differences were small in magnitude and clinically trivial but attained statistical significance owing to the large numbers. For instance, mean values (participants in the primary analysis versus those excluded) were 135 vs. 137 mmHg for systolic blood pressure, 27.0 vs. 27.5 kg/m2 for body mass index, 90 vs. 92 cm for waist circumference and 0.87 vs. 0.88 for waist/hip ratio (all p<0.0001 for difference, after adjustment for multiple testing using the method of Benjamini and Hochberg 12 ).
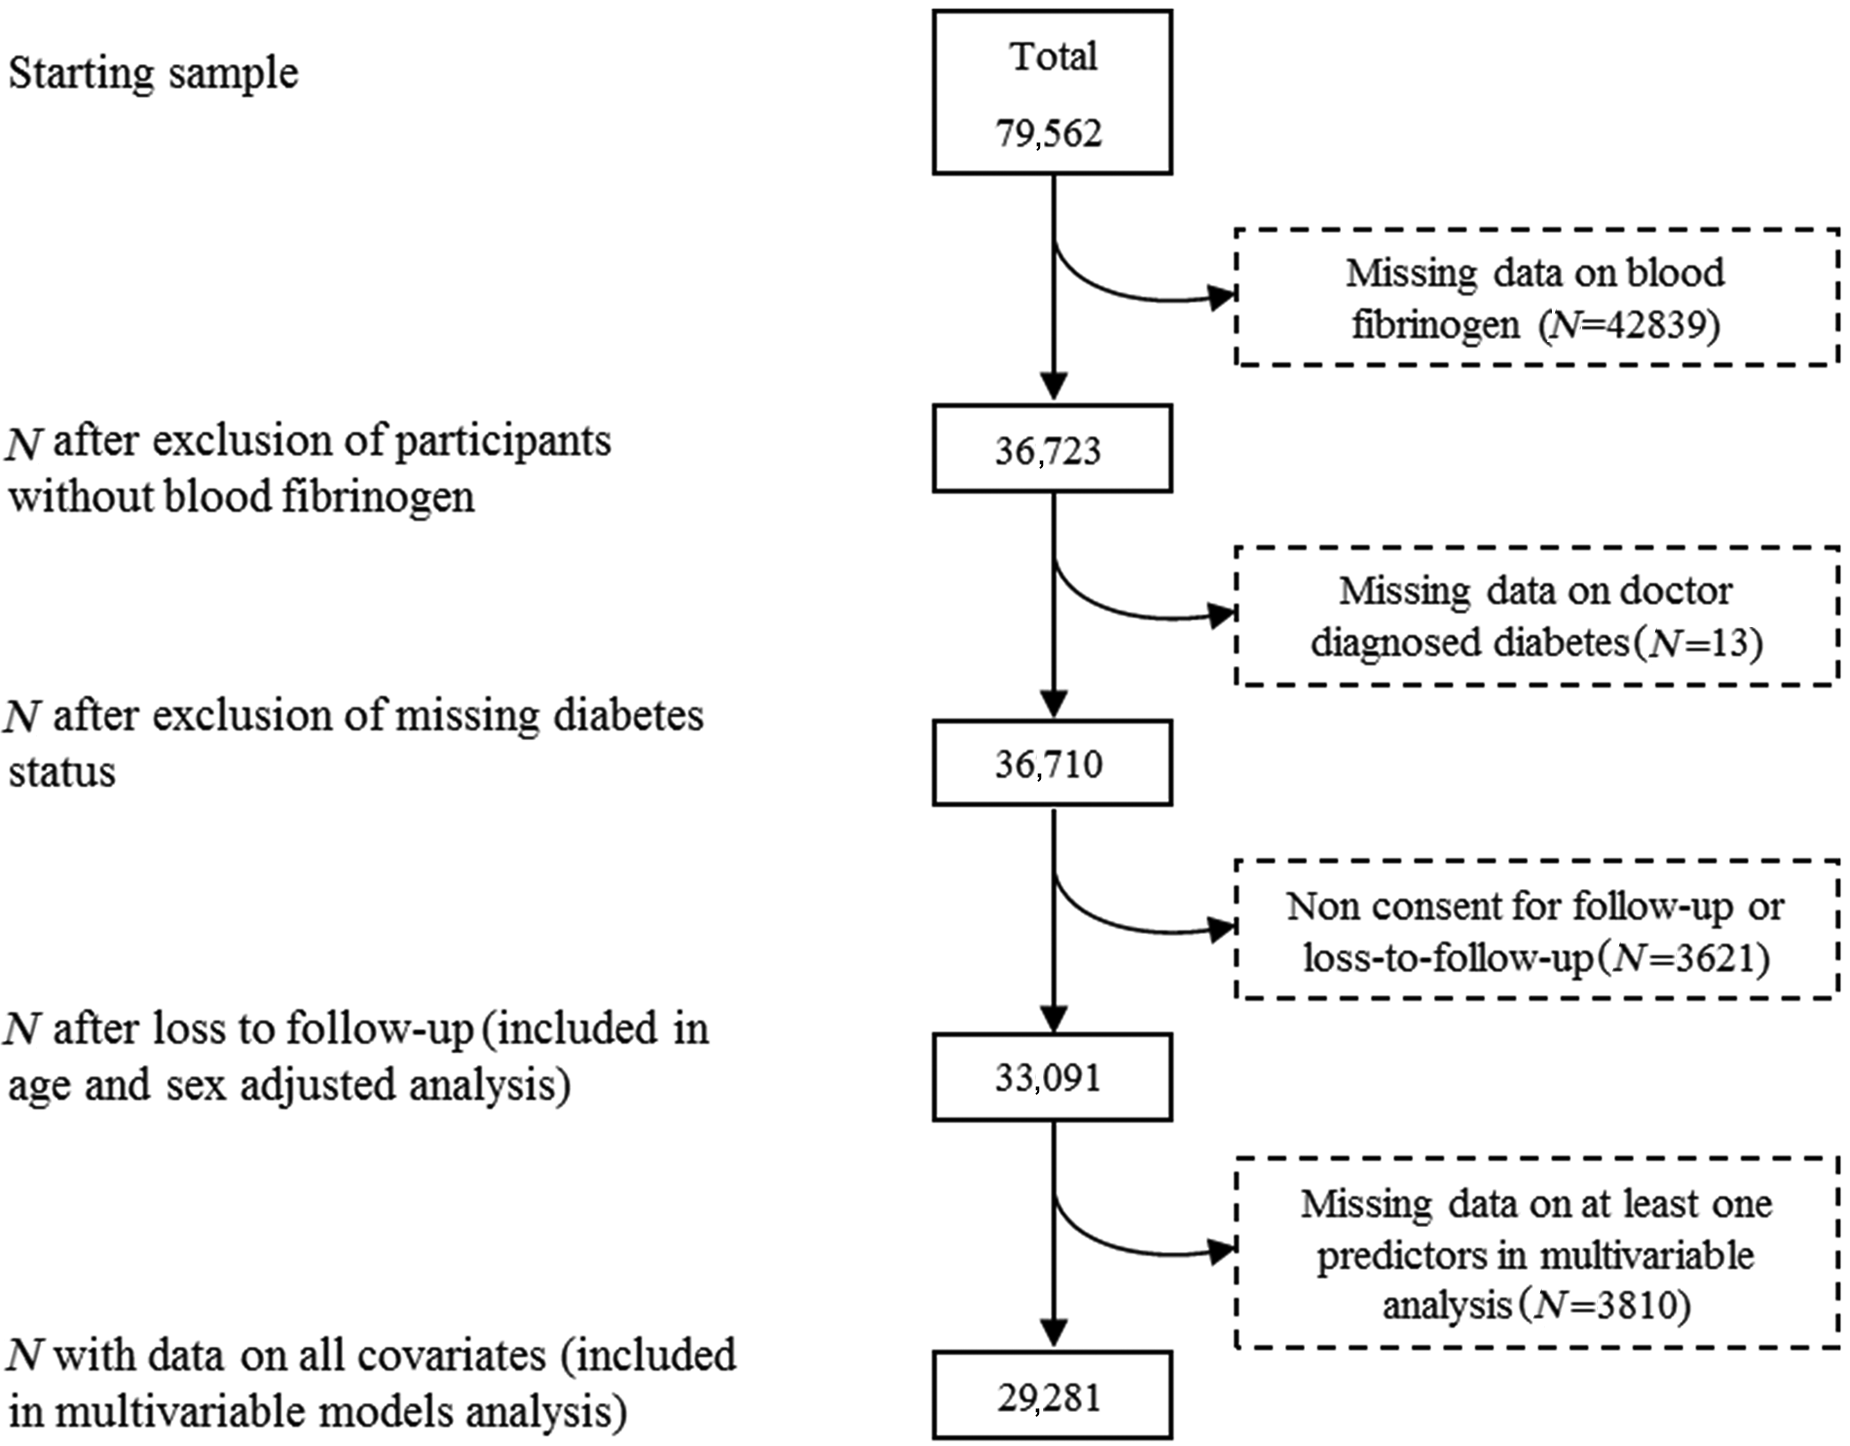
Derivation of the analytic sample.
Baseline characteristics of study members by diabetes status across fifths of fibrinogen.
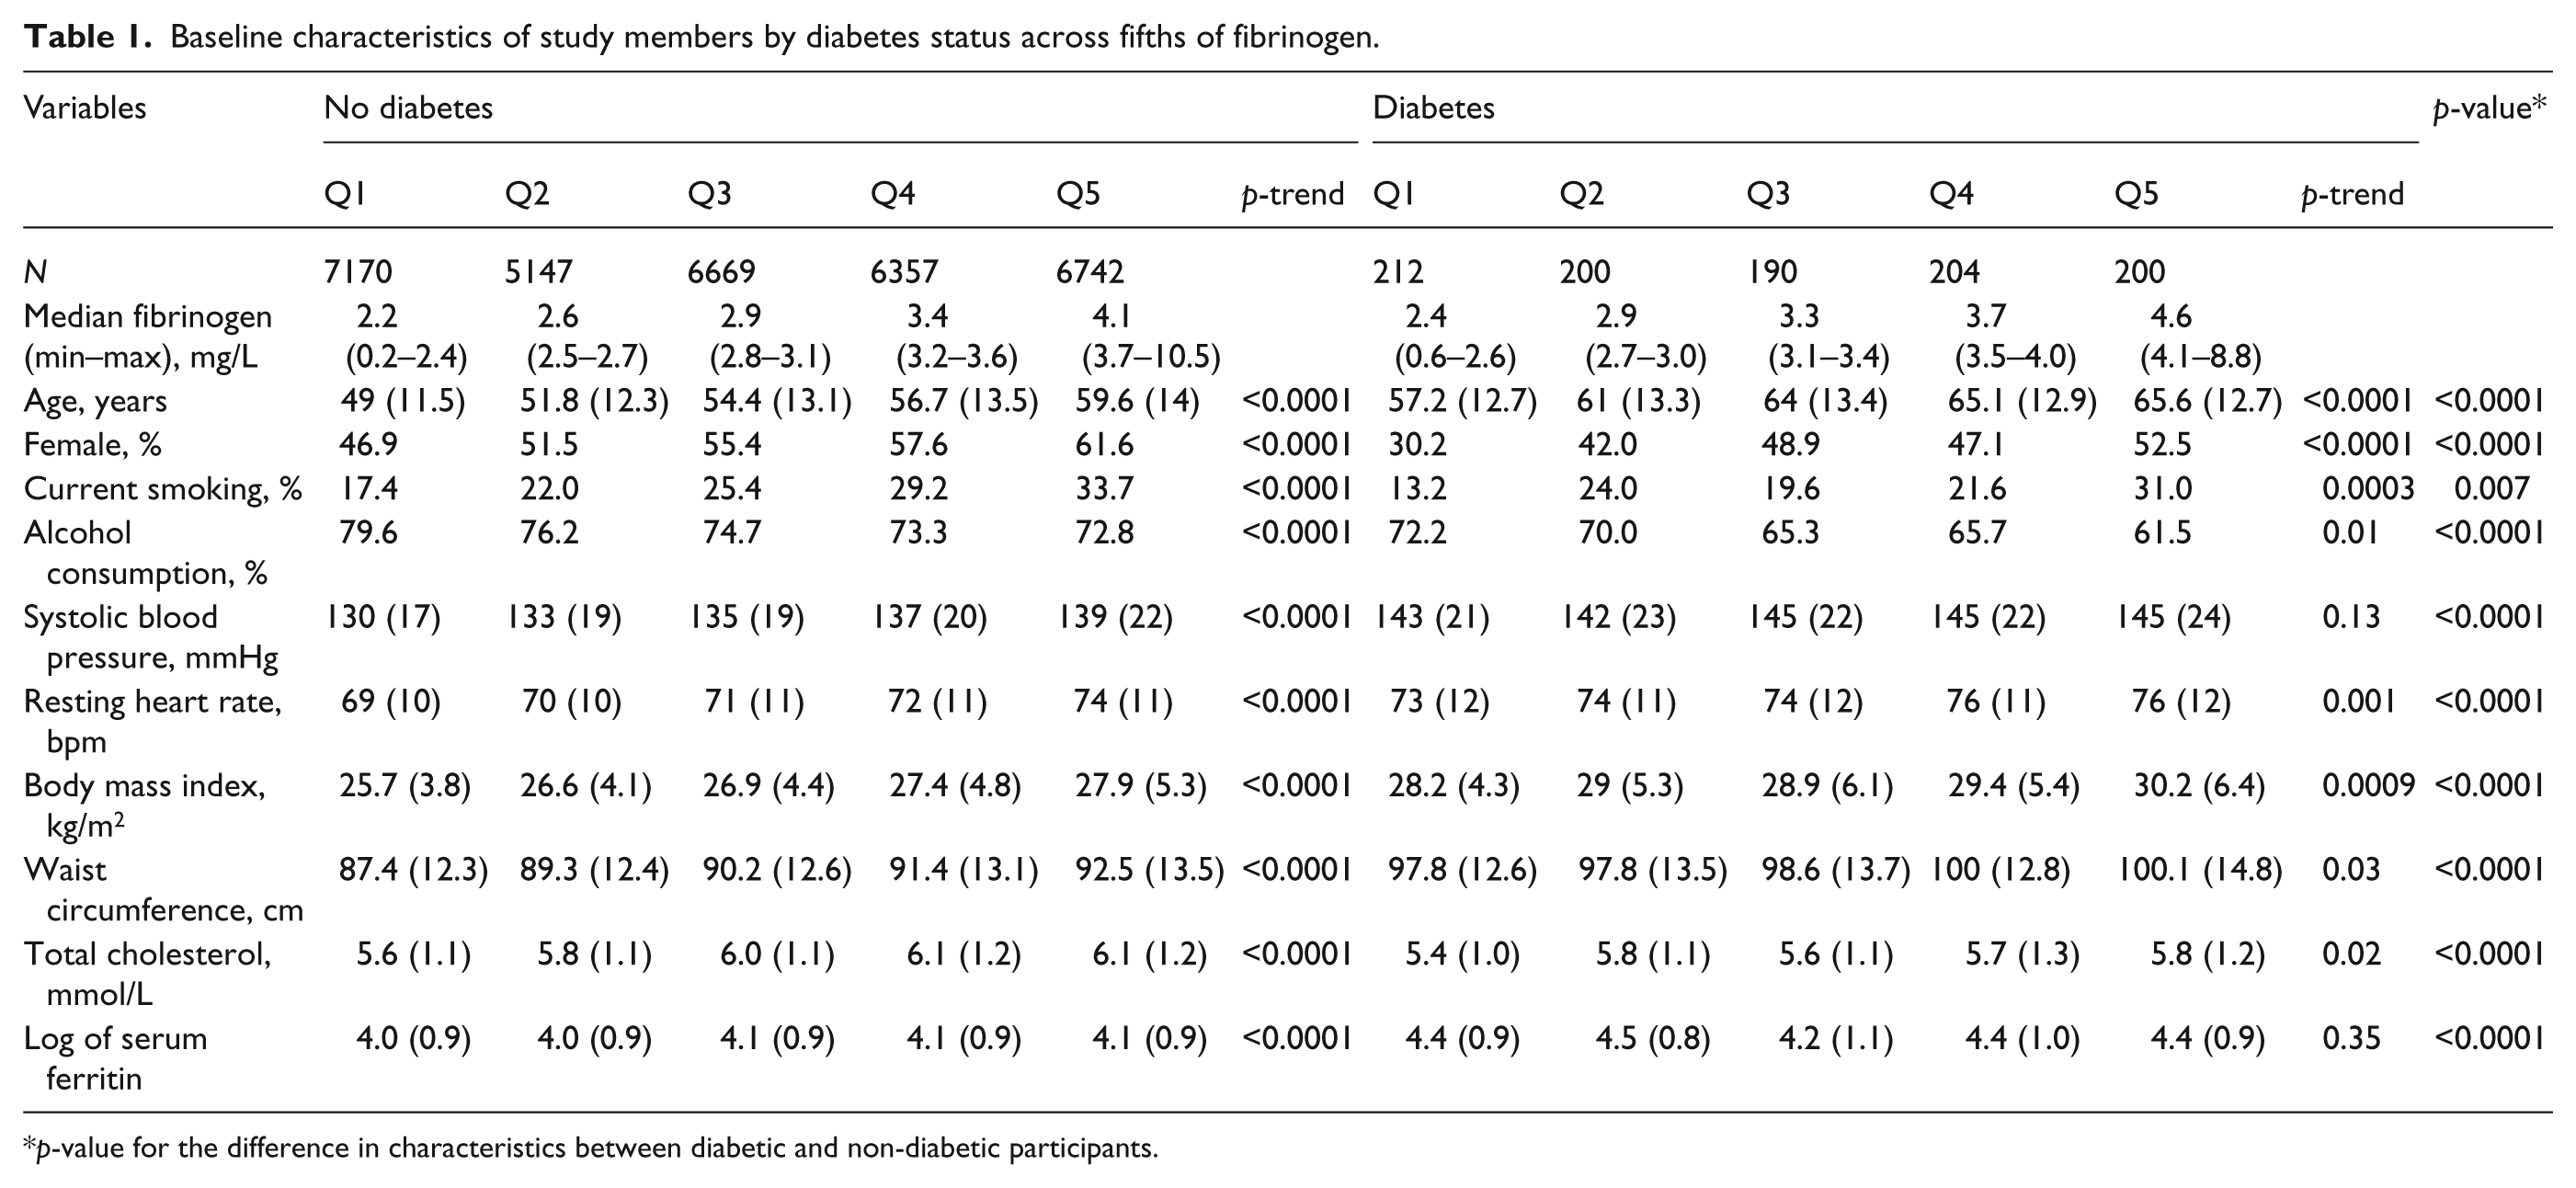
p-value for the difference in characteristics between diabetic and non-diabetic participants.
Normal distribution was obtained with the natural logarithm (loge) of the positively skewed fibrinogen. Cox proportional hazard regression models were used to compute the hazard ratio (HR) and accompanying 95% confidence interval (95% CI) per standard deviation (SD) increase in loge fibrinogen with all-cause and CVD mortality as the outcome. The proportional hazard assumption was tested with the use of the cumulative sums of Martingale-based residuals methods. 13 Similar Cox models were used to compare mortality risk across fifths of fibrinogen, with accompanying 95% CI derived with the use of floating absolute risk methods. 14 Interaction between diabetes and fibrinogen was ascertained by adding an interaction term to models that included the main effect of diabetes and log fibrinogen. Cox models were stratified by cohort and adjusted for sex and age.
The age and sex adjusted HRs (95% CI) for a one SD loge (fibrinogen) in relation with CVD mortality risk was 1.34 (1.26–1.42) in the primary analytical sample. The equivalents were 1.32 (1.23–1.43) in the multivariable analyses sample and 1.34 (1.20–1.50) in the primary analyses subcohort excluded from the multivariable model sample (p = 0.64 for interaction) according to diabetes status.
The predictive utility of the models was assessed separately for participants with and without diabetes by computing the area under the receiver operating characteristic curve (AUC). AUC comparisons used non-parametric methods. 15 The relative integrated discrimination improvement (RIDI%), which measures the percentage improvement in discrimination when an extra variable is added to a prediction model, 16 was computed. The RIDIs’ 95% CIs were derived with the use of non-parametric bootstrap percentiles confidence interval method, based on 1000 replications. We calculated: 1) the likelihood ratio χ2, which compares the adequacy of a model with covariates fitted to a set of data with that of the null model (without covariates) fitted to the same data set; 2) the Akaike’s information criterion (AIC), which allows for comparisons between models (nested or not); the smaller the value of the statistic, the better the model fits the data; 17 and 3) the Hosmer and Lemeshow calibration test, which assesses the closeness between predicted and observed outcomes rates. 18 The standard Framingham model for predicting CVD mortality risk 19 uses diabetes status and the interaction term of it with gender as predictor, which makes a fair assessment of the incremental value of fibrinogen to the performance of this model by diabetes status impossible. Therefore a basic model was constructed with the following predictors: age, sex, smoking, systolic blood pressure, body mass index, waist circumference, physical activity and total cholesterol. Additional models were constructed by adding fibrinogen to the basic model as well as interaction terms of fibrinogen with gender. All data analysis used SAS/STAT® v. 9.1 for windows (SAS Institute Inc., Cary, NC, USA).
Results
Of the 33,091 participants included in the analytical sample, 1006 (3.04%) had diabetes at baseline. The characteristics of participants with and without diabetes according to fifths of fibrinogen levels are summarised in Table 1. The expected differences were noted in the distribution of major characteristics between participants with and those without diabetes. Among participants without diabetes, there was an increasing linear trend in the levels of other risk factors across fifths of fibrinogen distribution, whereby less favourable levels of risk factors were apparent in the higher fibrinogen groups. Such a trend was also seen in participants with diabetes, with the exception of systolic blood pressure).
Cardiovascular and all-cause mortality during follow-up
The median (25th–75th percentiles) follow-up duration was 102 (54–121) and 116 (59–153) respectively in participants with and without diabetes. During this period, 351 deaths (cumulative frequency 34.9%), including 119 from cardiovascular disease (cumulative frequency 11.8%), were recorded in participants with diabetes. The equivalents in those without diabetes were 4157 all-cause deaths (13%) and 1169 (3.6%) cardiovascular deaths.
In participants with and without diabetes, fibrinogen was positively associated with the risk of cardiovascular mortality. The HRs (95% CI) for a SD higher loge (fibrinogen) in relation with CVD mortality were 1.48 (1.21–1.81) in participants with diabetes and 1.31 (1.23–1.39) in those without diabetes. There was no evidence of statistical interaction according to diabetes status (p-interaction = 0.47). Graded associations were also observed across fifths of fibrinogen. The HRs (95% CI) comparing participants in the upper with those in the bottom fifths of fibrinogen were 2.67 (1.83–3.75) in participants with diabetes and 2.07 (1.86–2.30) in their non-diabetic counterparts (Figure 2). Associations were log-linear (both p < 0.0001 for log-linearity). Patterns of the associations of fibrinogen with CVD mortality were similar when men and women were examined separately and by diabetes status, with no evidence of diabetes*fibrinogen interaction (both p-interaction ≥ 0.61; Figure 2).
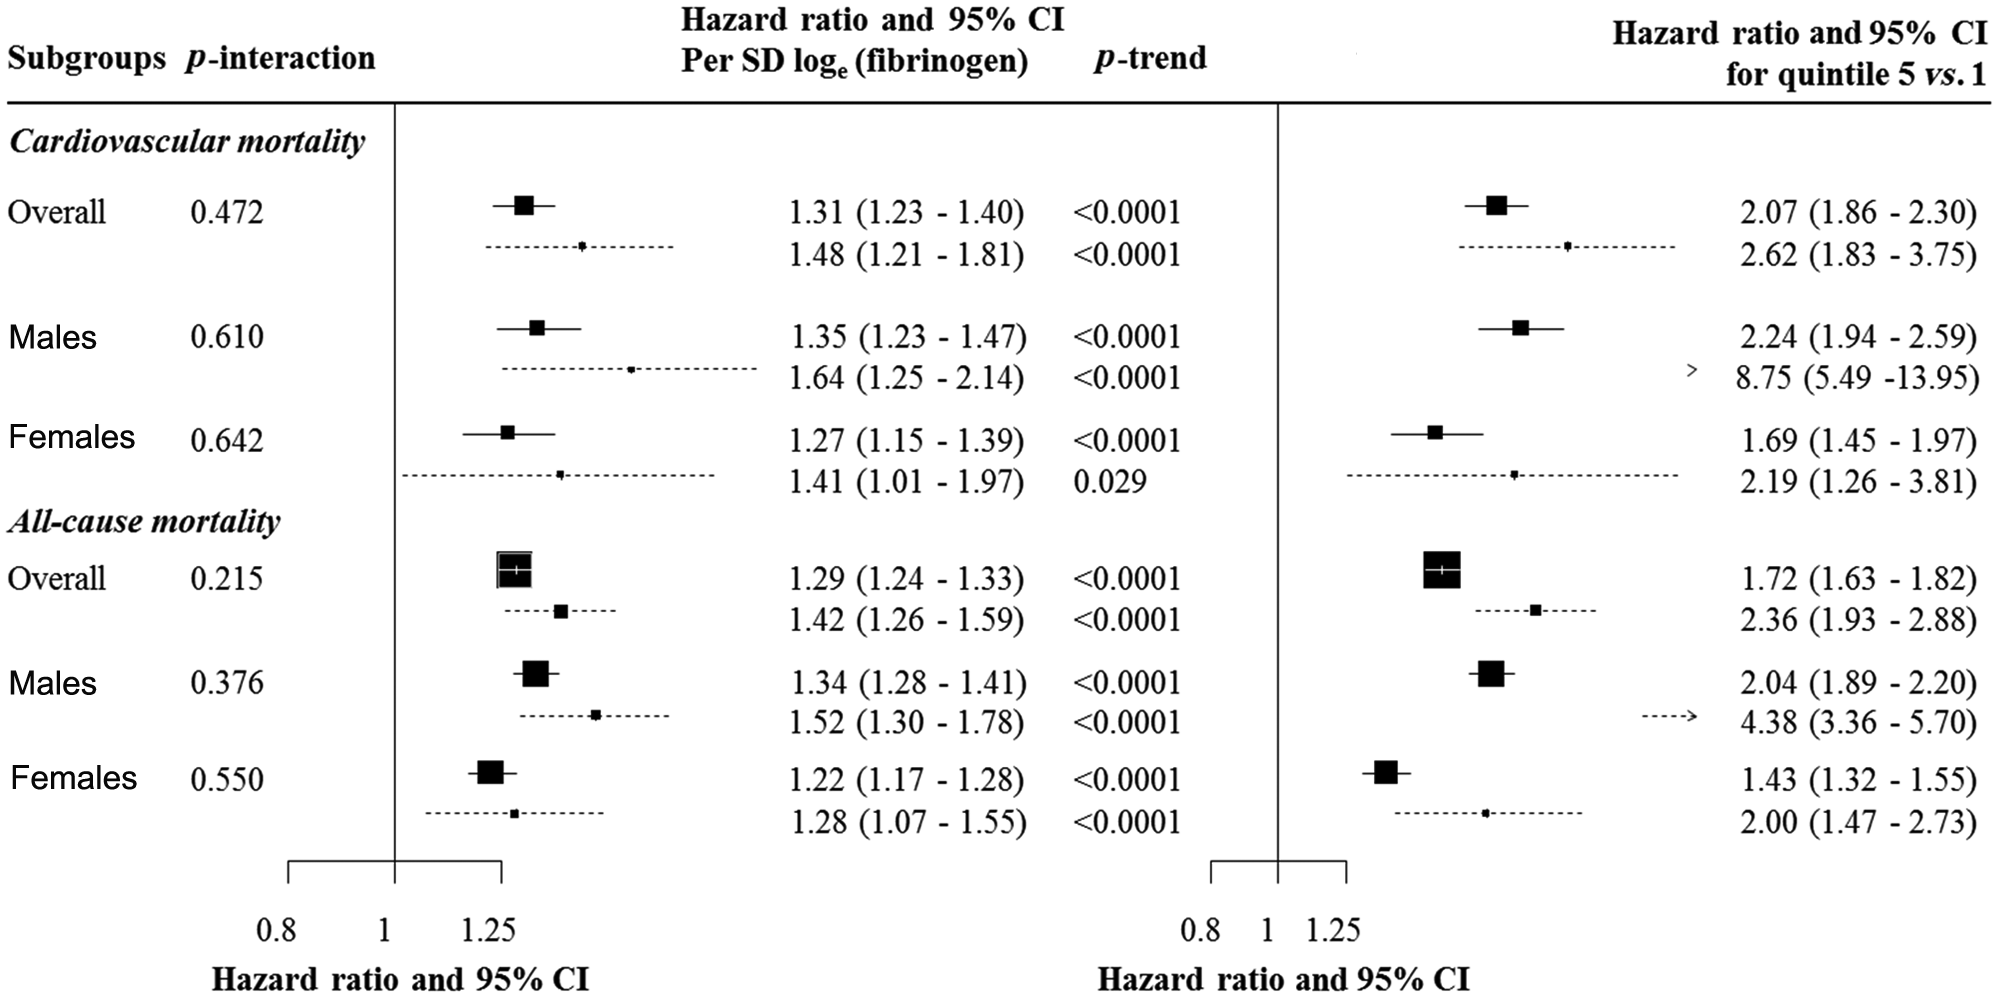
Hazard ratios and 95% confidence interval (95% CI) for mortality risk by diabetes status overall and in males and females. The left panel is for the effects associated with a standard deviation (SD) higher loge (fibrinogen), together with p-value for the statistical interaction by diabetes status (p-interaction). The right panel is for the effects comparing participants within the top quintile of fibrinogen distribution with those in the lowest quintile, together with p-values for log-linearity of the association (p-trend). Cox models are stratified by cohort and adjusted for sex and age. For each figure panel, the black boxes are for the effect sizes (hazard ratio), and are proportional to the inverse variance of log(hazard ratio). The horizontal lines are for the 95% CI, separately for participants with diabetes (broken lines) and those without (solid lines). Arrowheads indicate that the confidences interval bars have been truncated.
Fibrinogen was also positively associated with risks of all-cause mortality. There was no evidence of statistical interaction according to diabetes status (p-interaction p = 0.21), although the point estimate for the associations in participants with diabetes was higher than that in their non-diabetic counterparts. The HRs (95% CI) for a SD higher loge (fibrinogen) were 1.42 (1.26–1.59) in diabetic and 1.29 (1.24–1.33) in non-diabetic participants (Figure 2). When males and females stratified by diabetes status were examined separately, patterns of the association were similar, again with no significant statistical fibrinogen*diabetes interaction (both p ≥ 0.38). Graded associations were also observed across fifths of fibrinogen, with indication that associations were mostly linear (Figure 2).
Fibrinogen was positively associated with CVD mortality in the full cohort, with a one SD higher loge (fibrinogen) being associated with a 34% (95% CI: 26–42%) higher risk of cardiovascular death. The equivalents in males and females were 38% (27–50%) and 29% (17–41%). Across fifths of fibrinogen distribution, there was also a graded association between fibrinogen and mortality overall and in males or females. These associations were log linear for cardiovascular mortality (all p < 0.0001 for log-linearity).
There was also a positive association between fibrinogen and all-cause mortality in the full cohort and by gender. A one SD higher loge (fibrinogen) was associated with a 30% (95% CI: 26–35%) higher risk of all-cause mortality at the total cohort level, 36% (30–43%) in males and 23% (18–29%) in females. There was a grade association across fifths of fibrinogen, and the shape of the associations with all-cause mortality was log-linear (all p < 0.0001 for log-linearity).
Fibrinogen and risk prediction
Measures of models performance are summarised in Table 2. The basic model (without fibrinogen) had acceptable to good discriminatory power in predicting cardiovascular and all-cause mortality with AUC ranging from 0.751 for cardiovascular mortality in people with diabetes to 0.844 for the same outcome in participants without diabetes. Adding fibrinogen to the basic model improved both the model goodness of fit and its discriminatory power. In participants with diabetes, however, there was no evidence for improvements in the AUC for the prediction of cardiovascular death (p = 0.19 for difference in AUC). Despite some attenuation in the effect sizes, fibrinogen was always positively associated with the outcomes in all multivariable models (supplementary material Table 2). Adding the interaction terms of sex and fibrinogen did not improve the performance of the model (Table 2).
Goodness of fit, discrimination and calibration statistics of models for the prediction of CVD and all-cause mortality in participants with and without diabetes.
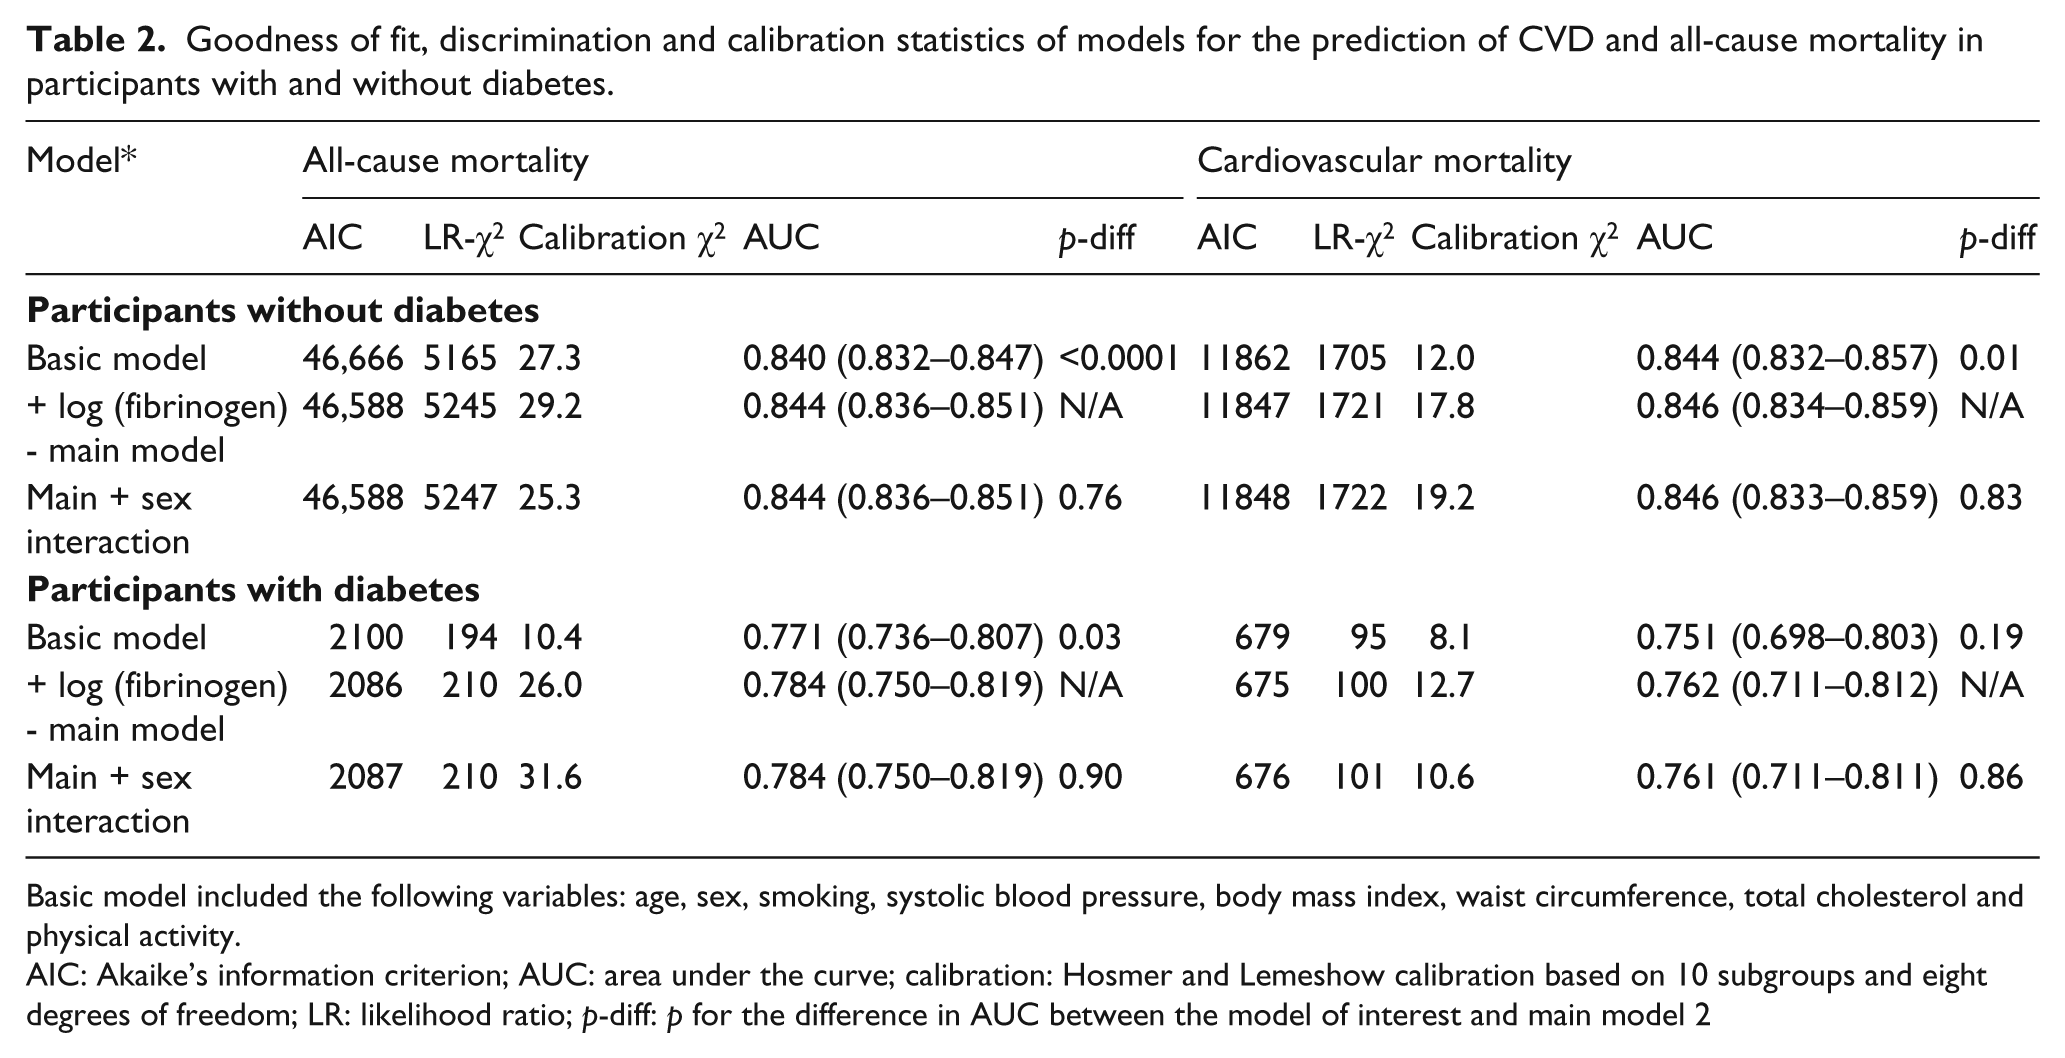
Basic model included the following variables: age, sex, smoking, systolic blood pressure, body mass index, waist circumference, total cholesterol and physical activity.
AIC: Akaike’s information criterion; AUC: area under the curve; calibration: Hosmer and Lemeshow calibration based on 10 subgroups and eight degrees of freedom; LR: likelihood ratio; p-diff: p for the difference in AUC between the model of interest and main model 2
Based on RIDI% estimates, adding fibrinogen to the basic model conferred a similar level of improvement for cardiovascular mortality prediction in the total cohort and in participants with and without diabetes taken separately (Table 3). For the prediction of all-cause mortality, the magnitude of the improvement was greater for participants with diabetes (RIDI 4.17 (95% CI: 1.41–7.37%)), although the confidence interval was large and always overlapped with other estimates.
Relative integrated discrimination improvement (RIDI%) statistics and 95% confidence interval for nested models comparisons.
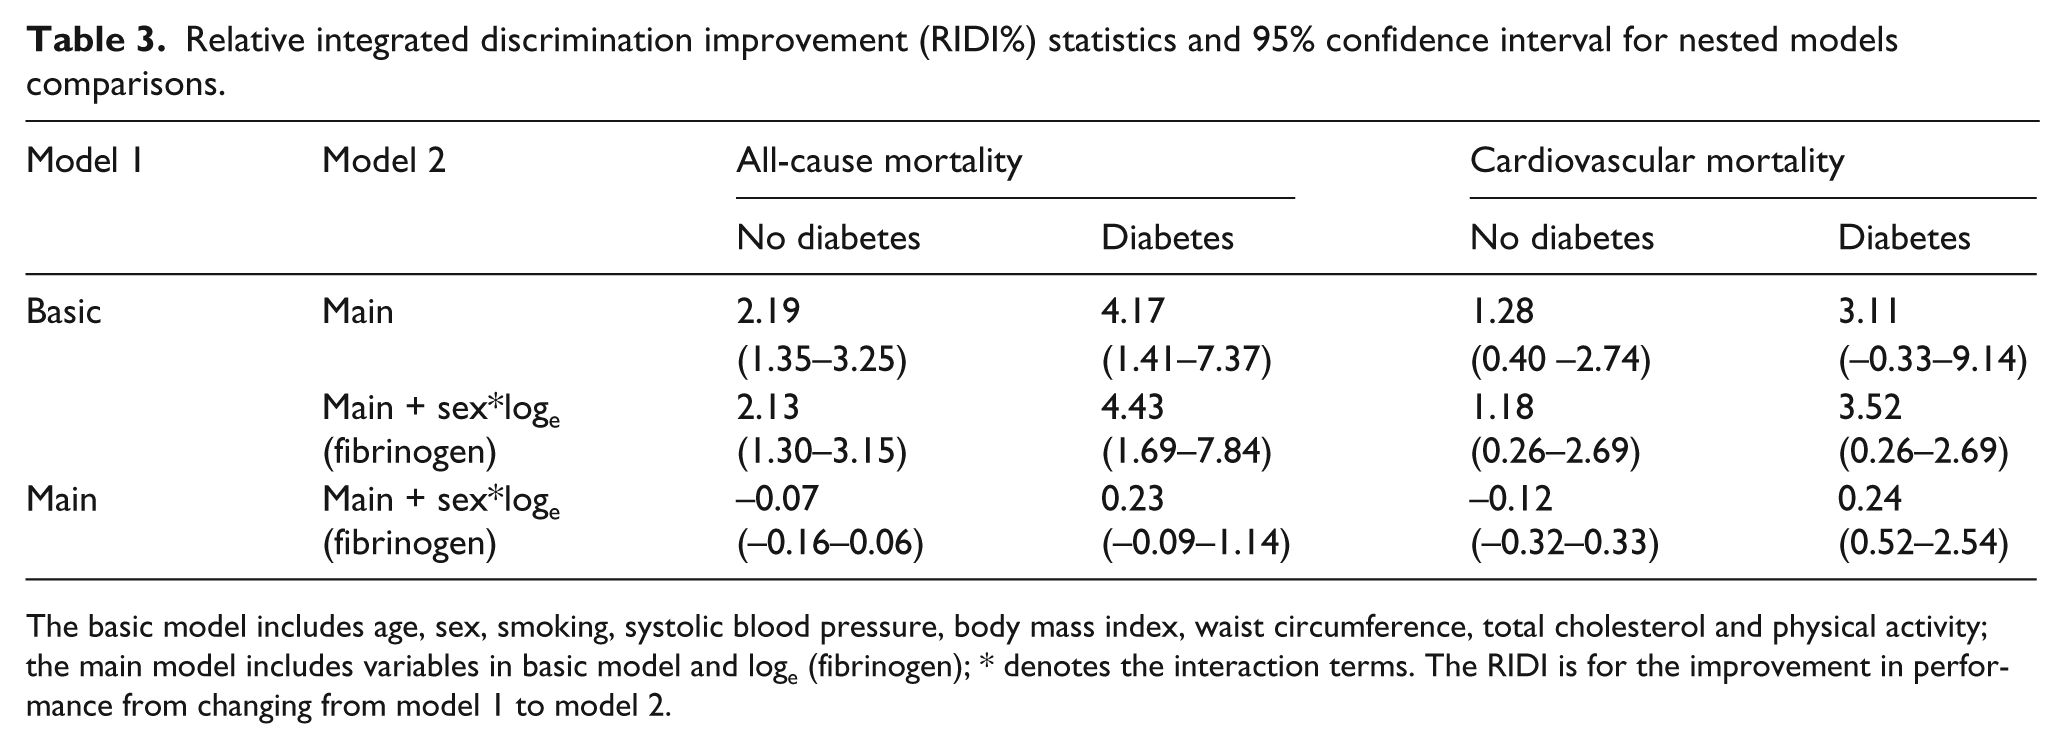
The basic model includes age, sex, smoking, systolic blood pressure, body mass index, waist circumference, total cholesterol and physical activity; the main model includes variables in basic model and loge (fibrinogen); * denotes the interaction terms. The RIDI is for the improvement in performance from changing from model 1 to model 2.
Discussion
In this individual participant meta-analysis, we demonstrate that shape and strength of associations of fibrinogen with all-cause and cardiovascular mortality are similar in people with and without diabetes. These associations were log-linear and independent of established cardiovascular risk factors. The added value of fibrinogen to outcome prediction based upon established risk factors was marginal in both groups.
Prior studies and mechanisms of effects
While there is an abundant literature on the association of fibrinogen with major outcomes in the general population,2–4 few studies have also prospectively investigated the relationship of fibrinogen with health outcomes in people with diabetes.8,20,21 In the Fibrinogen Studies Collaboration, 2 there was no heterogeneity in the association of fibrinogen with coronary heart disease and stroke when effect estimates were compared for participants with diabetes, participants without diabetes and those with unknown status for diabetes. There was, however, some suggestion of differential association by subtype of CVD such that the highest effect estimate (HR per 1 g/L of fibrinogen) was recorded in participants with diabetes for stroke and the lowest for coronary heart disease. There was also evidence of substantial heterogeneity among participating studies. 2 In the Strong Heart Study, 7 there was no heterogeneity by diabetes status in the association of fibrinogen and CVD or all-cause mortality. Our findings therefore consolidate and extend those above by further demonstrating the similarities in the association of fibrinogen and outcomes by diabetes status within and across gender subgroups.
Fibrinogen is associated with both established and emerging risk factors. 6 Both our study and previous investigations confirm that those correlations do not fully explain the relationship of fibrinogen with CVD and mortality risk. 2 Possible clinical utility of the independent association of fibrinogen with outcomes has been assessed in terms of whether measurement or modification of fibrinogen could be helpful in disease prediction or prevention. With regard to disease prediction, interest has focused on whether fibrinogen alone or alongside other novel biomarkers had utility beyond established risk factors in predicting the future risk of outcomes. The range of improvement in predictive accuracy by adding fibrinogen to basic models in our study was similar to those reported by the Strong Heart Study investigators, 7 and better than those from the Lower Extremity Arterial Disease Event Reduction (LEADER) cohort. 22
Fibrinogen and risk prediction
We are not aware of any previous effort to assess the added value of fibrinogen to predictions specifically in people with diabetes. Although models based on established risk factors had already a good-to-acceptable performance in our cohort, point estimates for AUC were typically lower in participants with diabetes for the two outcomes; and confidence interval indicated that this was not only an issue with statistical power (smaller number of outcomes). This low performance of established risk factors based models in people with diabetes has been substantially described already, 23 and would tend to suggest that there is more scope for improving predictions in people with diabetes than in those without. Effects sizes for change in AUC or for RIDI% from adding fibrinogen to the basic model were greater for participants with diabetes than those without. However, confidence intervals about RIDI always overlapped, suggesting that magnitudes of improvement were likely similar.
Fibrinogen as a target for cardiovascular prevention
Lifestyle factors that affect levels of established CVD risk factors can lower fibrinogen levels. 24 However, correlation studies suggest that modifiable lifestyle characteristics all together explain only a modest proportion of variation in fibrinogen levels, 6 indicating that potential for controlling fibrinogen levels through lifestyle changes would be modest. Whether achieving fibrinogen control will result in improved outcome is already uncertain. In the Bezafibrate Infarction Prevention (BIP) Study for instance, intervention was associated with a 14% reduction in fibrinogen levels, with, however, no difference in six-year cardiovascular outcomes between participants receiving bezafibrate and those receiving a placebo. 25 About 20–51% of variations in fibrinogen levels are explained by genetic factors. 1 However, studies have suggested that genotypes that control fibrinogen levels are only weakly associated with cardiovascular disease,26–28 casting doubt about plausibility of any causal association between fibrinogen and CVD. The more elaborated of those studies, however, have been limited by their focus on single genetic variants.28,29 Indeed, recently, several functional sites in the fibrinogen gene cluster that determine an individual’s plasma fibrinogen levels have been identified. 30 Therefore, large scale Mendelian randomisation studies which utilise one or more gene variants for fibrinogen would be of value, not least because this design has the potential to circumvent the perennial problem of confounding in epidemiology. Unfortunately, we do not have genetic material in the cohort studies featured in the present analyses.
Limitations and strengths
The present study has some limitations. These include the use of doctor diagnosed diabetes with no further objective test of glycaemia in those who did not report such a status. Therefore, some participants classified as non-diabetics could have undiagnosed diabetes. This will have the undesirable effect of diluting any true difference between participants with diabetes and those without, although they needed to be in very large number for such an effect to be significant. Our analyses were based on a single measurement of fibrinogen at baseline, with no opportunity for correction for the within-person variation in fibrinogen levels. 2 Our findings therefore likely underestimate the true effect of the association of fibrinogen with outcomes. For many variables we had missing values in our datasets. Missing data is a major concern when attempting to estimate the prevalence of a given exposure or disease; however, it is of less concern when estimating risk factor-disease associations as we do here. Multiple imputation has been suggested as one approach for dealing with missing data. 31 However, approaches for estimating the standard errors (which is required to combine estimates from different imputed datasets) for some performance measures in our study are not straightforward. Our study was based on a large sample, a reasonably large number of outcomes, and used robust analytic methods. However, yet much larger studies could be useful in investigating the observed effects.
Conclusions and perspectives
In conclusion, fibrinogen is positively and continuously associated with CVD and all-cause mortality. These associations are similar in people with diabetes and people without. Knowledge of information about fibrinogen significantly improves predictive accuracy of models based upon established risk factors similarly in people with diabetes and those without. Such improvement, however, is only modest and, alone, fibrinogen will achieve little in clinically reclassifying patients already risk stratified based on established risk factors. However, that established risk factors achieve only modest to acceptable predictive accuracy in people with diabetes indicates the existing scope for improving risk prediction in this population. Based on the existing knowledge, such improvement may actually be achievable only through a combination of novel biomarkers and not a single one.32–34 Fibrinogen would be a possible candidate in such an approach. However, the cost of acquiring biomarkers and complexity of the ensuing models would be severe limitations to the implementation of such approaches from a global perspective.
Footnotes
Acknowledgements
We would like to thank the Health Survey for England and Scottish Health Survey respondents for offering their valuable time and the Information Services Division Scotland team for their outstanding Scottish Health Survey data provision and data updating services.
Funding
This work was supported by the Wellcome Trust (Wellcome Trust Career Development Fellowship to GDB), the UK MRC and the Chief Scientist Office at the Scottish Government Health Directorates (to the Medical Research Council (MRC) Social and Public Health Sciences Unit).
Conflict of interest
None for all authors.
Author contribution
ES had full access to all of the data in the study and takes responsibility for the integrity of the data and the accuracy of the data analysis. Study concept and design: APK, GDB, SC; acquisition of data: ES; analysis and interpretation: ES, GDB, APK, SC; drafting of the manuscript: APK; critical revision of the manuscript for important intellectual content: APK, GD, SC, ES, MH.