
Abstract
Diabetes mellitus (DM) is strongly related to an increased risk for coronary heart disease (CHD) and cardiovascular disease (CVD) which includes CHD, stroke, heart failure, myocardial infarction and peripheral arterial disease.1–3 Persons with DM without prior myocardial infarction (MI) have been observed to have a similar risk for future CHD events to those without DM but who have a prior MI 2 and total mortality is also similar in persons with prior CVD without DM as compared with those with DM without CVD.4,5 The Third Adult Treatment Panel of the National Cholesterol Education Program designated DM as a CHD risk equivalent, thus indicating such persons for aggressive low density lipoprotein-cholesterol (LDL-C) lowering as in persons with pre-existing CHD. 6 However, a recent meta-analysis of 13 studies involving 45,108 subjects shows many of those with DM to have lower CHD event rates than persons with known CHD; those with DM without prior myocardial infarction had a 43% lower risk of developing total CHD events compared with those without DM but with a previous myocardial infarction. 3 Also, we have previously reported among persons with metabolic syndrome that a significant proportion (>30%) are at low estimated CHD risk. 7 Thus, these observations raise question as to whether DM is typically a CHD or CVD risk equivalent.
Accordingly, it was of interest in this study to examine the global CVD risk associated with DM in US persons with DM. We examined the 10 year risk of total CVD in US persons with diabetes using global risk assessment equations for total CVD across gender and ethnicity, by DM type and treatment, as well as examined risk factor differences and goal attainment by global risk categories.
Methods
Study sample
The participants used in this analysis were derived from the National Health and Examination Survey (NHANES) 2003–2006. 8 NHANES is a complex, multistage sample design of the civilian, non-institutionalised US population that is conducted by the National Center for Health Statistics. The survey includes individual-reported demographic and socioeconomic information as well as medical examination data including laboratory tests and physiological measurements administered by trained medical personnel.
Definitions
We included in our study 1114 adults aged 18 years and older in NHANES 2003–2006 with DM (representing 18.2 million in the US) and who were aged 30–74 years; 889 (14.3 million) had type 2 DM, 131 (2.3 million) had type 1 DM and 94 (1.6 million) had undiagnosed DM. DM was overall defined as by the modified NCEP definition if one of the following conditions was met: 1) fasting glucose ≥7.0 mmol/L (126 mg/dl) after a 12 hour fast, 2) casual glucose ≥11.1 mmol/L (200 mg/dl), 3) use of oral hypoglycaemic agents, 4) taking insulin, or 5) a self-reported diagnosis of diabetes. 1 Participants were classified in three groups: type 1 DM, type 2 DM, undiagnosed. Type 2 DM was defined as those who were told of their diabetes at age 30 years or greater, type 1 DM as those who were told of their diabetes prior to the age of 30 (as others have defined previously utilising NHANES data 9 ) and undiagnosed DM based on a fasting glucose of ≥126 mg/dl (or non-fasting glucose ≥ 200 mg/dl), but who were not told by a health care professional that they had diabetes. Insulin users were defined as self-reported insulin use or taking insulin as one of their medications, treated insulin non-users were defined as denying the self-reported insulin use and not taking insulin as one of their medications, but who were on another oral medication for diabetes, and untreated was defined as denying the self-reported insulin use, not taking insulin and not taking any oral anti-diabetes agents. Additionally, metabolic syndrome (MetS) was determined to be present if ≥3 of the following criteria were met: fasting glucose ≥ 5.55 mmol/L (100 mg/dl) or on glycaemic medication, blood pressure (BP) ≥ 130/85 mmHg or higher or on hypertensive medication, abdominal obesity defined as >88cm in females or >102 cm in males, fasting triglycerides ≥ 1.7 mmol/L (150 mg/dl), or HDL-C <1.1 mmol/L (40 mg/dl) if male or <1.3 mmol/L (50 mg/dl) if female. 10
LDL cholesterol was calculated and defined by the Friedwald equation (LDL cholesterol = total cholesterol- HDL cholesterol- 1/5 triglycerides) if triglycerides were <400 mg/dl. Albumin/creatinine ratio is defined by 0.1*urine albumin (mg/dL)/0.001*urine creatinine (g/dL). Microalbuminuria is defined by the range of the albumin/creatinine ratio between 30 and 300 mg/L. Macroalbuminuria is defined by a ratio above 300 mg/L. 11 Renal disease was defined as a glomerular filtration rate (GFR) <60 ml/min by the MDRD equation {186 × [serum creatinine (mg/dl)-1.154] × [age-0.203] × 0.742 (if female) × 1.210 (if Black)}. Prevalent chronic kidney disease (CKD) was defined as being in stages 3 or greater, with stage 3 as GFR 30–59 ml/min, stage 4 as GFR 15–30 ml/min and stage 5 being GFR < 15 ml/min. 12
Medication treatment information of survey participants was obtained by self-reported answers to questions about taking any medications for hypertension or cholesterol within the past 30 days. Participants were also asked to show the interviewer the medication containers for all the products used. If there was no medication container available, the participant was asked to verbally report the name of the medication.
Data analysis
The updated Framingham risk algorithm developed by D’Agostino and colleagues 13 was used to estimate the 10 year risk of total CVD events including CHD, stroke, congestive heart failure and peripheral arterial disease (given these are all important complications of diabetes). The gender-specific algorithm allocated points to each individual based on age, high density lipoprotein-cholesterol (HDL-C), total cholesterol, systolic blood pressure, treatment for hypertension, current smoking and diabetes. The points assigned were then summed to estimate 10-year risk of CVD. Since the Framingham risk algorithm that we used was developed for those aged ≥ 30 years and assigns 0 points to the lowest age group (30–34), we used 0 points for the age factor for those aged < 30 years in our analysis. Low risk was classified as <10%, moderate risk as 10–20%, high risk as >20% risk of CVD in 10 years and pre-existing CVD was based on a self-report of being told by a doctor of prior coronary heart disease, heart attack, stroke or heart failure.
Cross tabulations procedures with SAS and SUDAAN software were used to compare baseline statistics across risk groups for the following: co-morbidities, gender, ethnicity, age, metabolic syndrome stratified by gender, diabetes groups and insulin groups. The proportion of subjects who met goals for Hgb1Ac < 7%, blood pressure <130/80 mmHg, LDL-C <100 mg/dl, HDL-C ≥ 40 mg/dl for females and ≥ 50 mg/dl for males, triglycerides <150 mg/dl (mg/dl), waist circumference <88 cm for females and <102 for males (cm), body mass index < 25 and < 30 (kg/m2) and the composite of A1c, BP and LDL were determined and compared across risk groups. Mean values were also calculated for various cardiometabolic risk factors across the risk groups and compared using ANOVA. All proportions and means reported are based on population-weighted analyses using SUDAAN.
Results
Figure 1 shows overall among those with DM, 22.9% were at low risk, 17.5% at intermediate risk, 31.4% at high risk and 28.2% with pre-existing CVD (59.6% total high risk or with CVD), with greater proportions at low and intermediate risk among females (26.8% and 20.9%, respectively) compared with males (18.6% and 13.7%, respectively) (p < 0.0001). When comparing CVD risk across ethnicity, Caucasians had the highest proportions at high risk (35.4%) or with pre-existing CVD (30.5%) with non-Hispanic Blacks and Hispanics having the highest proportions at low global risk (30.6% and 32.4%, respectively, vs. 18.8% for Caucasians) (p < 0.0001 across ethnicity) (Table 1). Across age groups (Figure 2), the younger the individual the lower the CVD risk (97% of those in the 20–29 age group were in the low risk group), with the proportion at high risk or with CVD ranging from 0% among those aged 20–29 to 85.4% in those aged 70–79 (p < 0.001 comparing risk distribution by age group). The higher age groups comprised predominantly persons with high CVD risk or with pre-existing CVD (of those aged 70–79, 41.2% were high risk and 44.2% had pre-existing CVD) (p < 0.0001 across age groups).
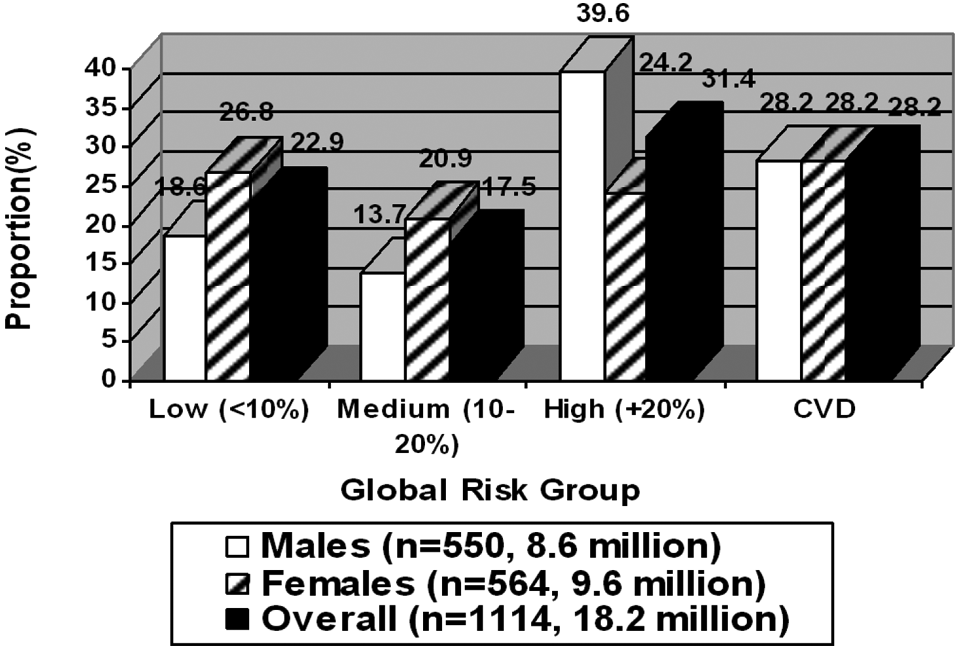
Distribution of 10-year global cardiovascular disease (CVD) risk by gender; p=0.0001 comparing risk distribution between males and females.
Gender, ethnic, risk factor and medication use comparisons across diabetes risk groups.
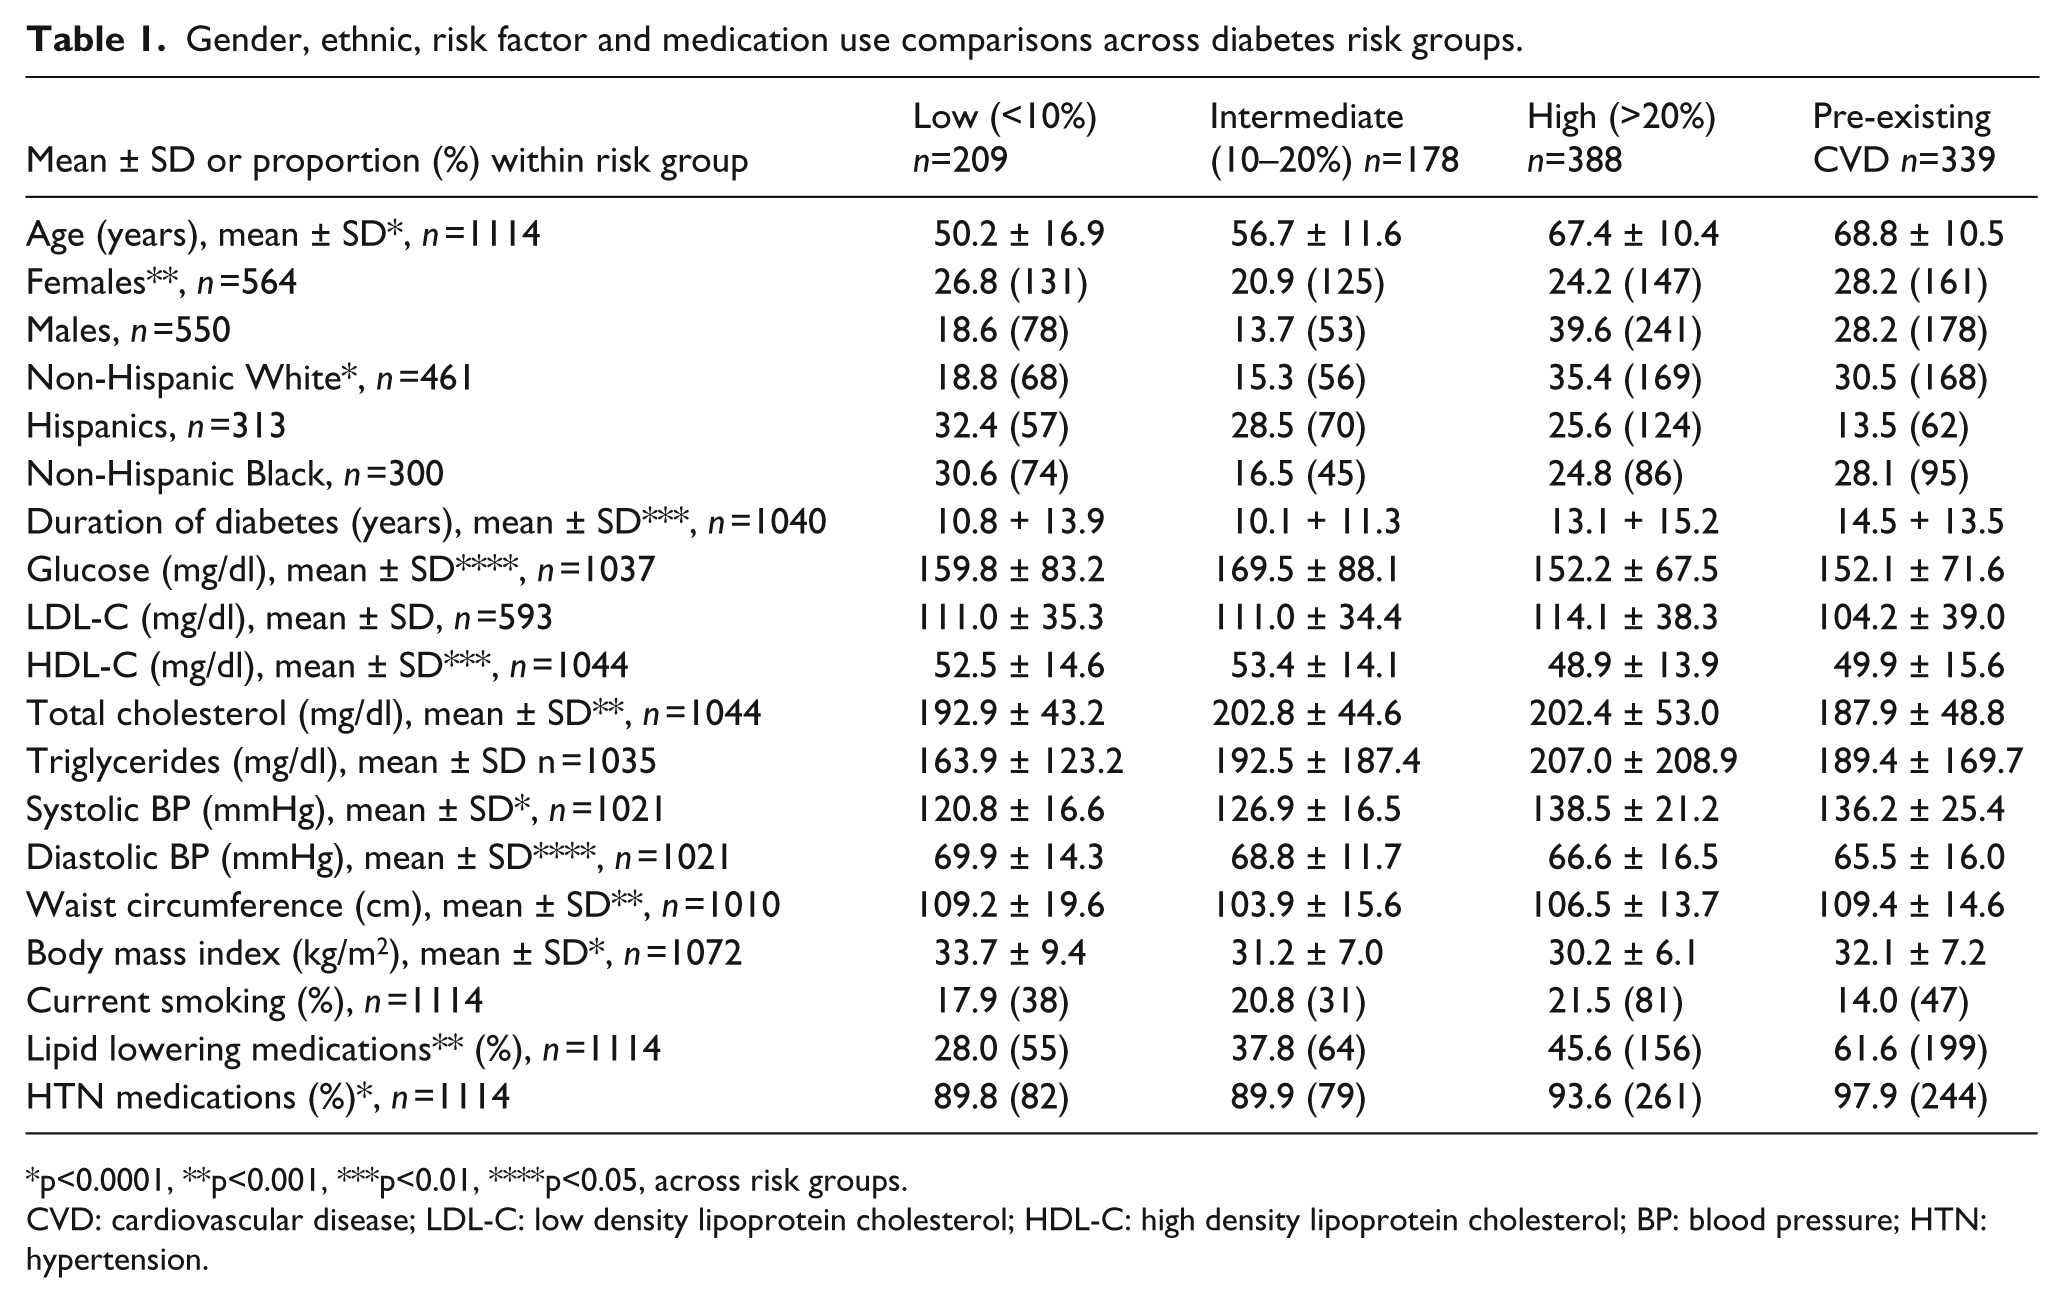
p<0.0001, **p<0.001, ***p<0.01, ****p<0.05, across risk groups.
CVD: cardiovascular disease; LDL-C: low density lipoprotein cholesterol; HDL-C: high density lipoprotein cholesterol; BP: blood pressure; HTN: hypertension.
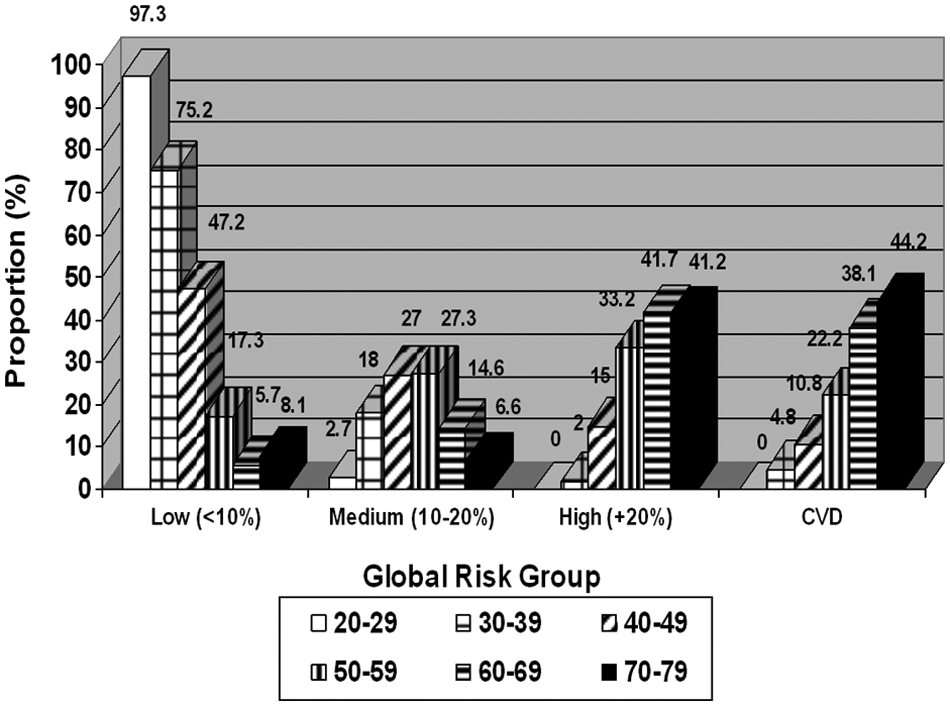
Distribution of 10-year global cardiovascular disease (CVD) risk across age groups; p=0.0001 comparing risk distribution across age groups.
Figure 3 compares the risk distribution in persons with type 2 diabetes according to those on insulin, on other oral diabetes medicines only or untreated. Those with untreated diabetes had the largest proportion in the low CVD risk group (21.1%) while non-insulin treated had the largest proportion in the high risk group (36.1%). However, insulin users had the highest percentage of pre-existing CVD (47.7%). Among insulin users, non-insulin treated and untreated subjects, 68.1%, 60.9% and 62.7%, respectively, were at high risk or with CVD) (p < 0.0001). Specifically among those we have defined as type 2 DM (age at diagnosis of 30 years or greater) shows 19.3% to be at low risk, 17.8% at intermediate risk, 31.6% at high risk and 31.4% with pre-existing CVD (total 63% with high risk or with CVD); this is similar to the overall DM population risk distribution, but expectedly contrasts with the distribution of risk in type 1 DM (nearly half at low FRS) and those undiagnosed (half at high risk but only 13.5% with CVD) (Figure 4).
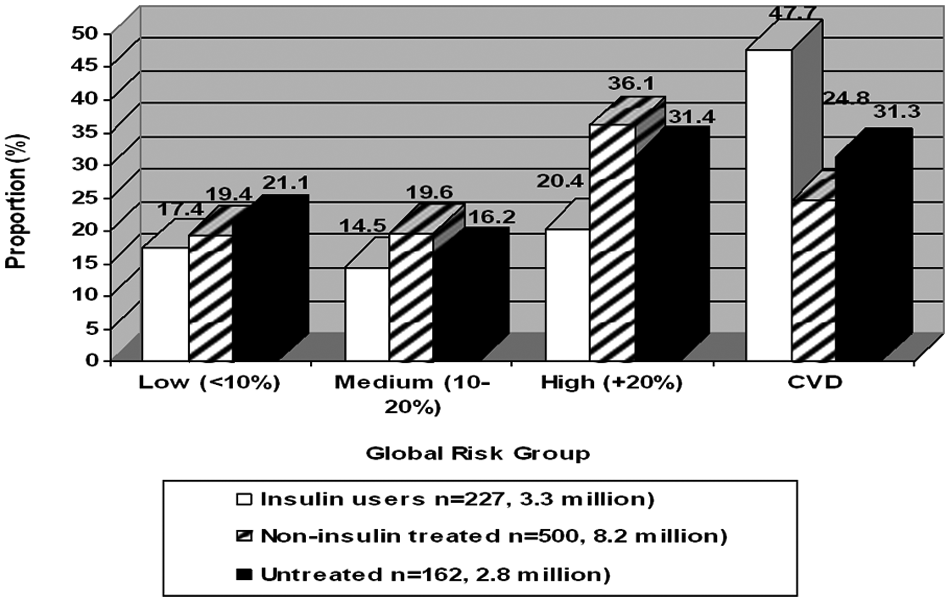
Distribution of 10-year global cardiovascular disease (CVD) risk by treatment status among diabetes treatment status; p<0.001 between insulin treated, non-insulin treated and untreated subjects.
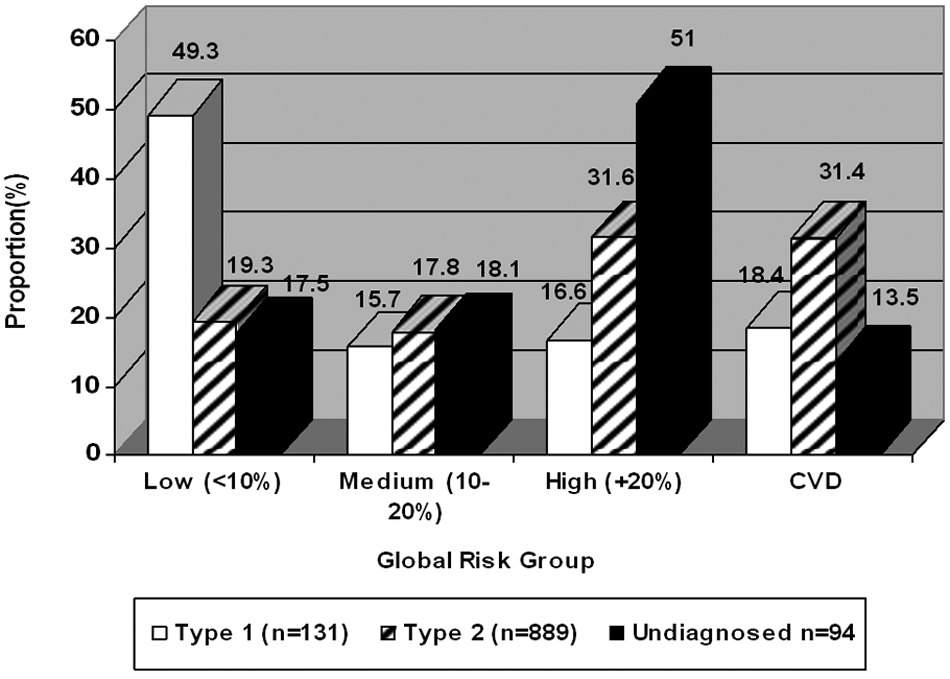
Distribution of 10-year global cardiovascular disease (CVD) risk by diabetes type; p<0.001 between type 1, type 2 and untreated subjects.
Table 1 compares risk factors across risk groups (low, intermediate, high and CVD). Mean age, LDL-C, total cholesterol, triglycerides, systolic BP, duration of diabetes, per cent smoking, lipid lowering medications and hypertension medications were progressively greater with higher risk groups, with the highest levels for the high and CVD risk groups. However, diastolic BP, waist circumference and body mass index unexpectedly were the highest in the low risk group. In particular, the high risk groups were nearly 20 years older and systolic blood pressures nearly 20mmHg greater than in the lower risk groups.
Table 2 shows the proportion of DM subjects at individual and composite risk factor goals by risk group. The intermediate risk group was least likely to be in control for A1c (47.2%) and the high risk groups least likely to be in control for blood pressure (high: 38.7%, CVD: 45.4%). Achievement of composite risk factor goals for A1c, BP and LDL-C were similarly low (< 15%) across all risk groups. The same trends were seen in the co-morbidities; renal disease was more common in the high and CVD risk groups compared with the low and intermediate risk groups (CKD prevalence: low 7.1%, intermediate 6.5%, high 21.6%, CVD 38.4%) (p < 0.001). Macroalbuminuria prevalence varied by risk group, being 8.5% in those at low risk compared with 4.5% in intermediate, 2.6% in high, and 13.6% in CVD groups (p < 0.01). Noteworthy was the high prevalence of metabolic syndrome, even among those at low (63.3%) and intermediate (69.3%) risk. Importantly, while 59.6% of our subjects with diabetes were at high risk or with CVD (from Figure 1), assigning those low and intermediate risk individuals with metabolic syndrome or with CKD (who may ultimately be at significant long-term risk) to the high risk would increase this total to 86.8%. We also get similar results if we restrict our sample to those defined as having type 2 DM; 63% were at high risk or with CVD and a similar assignment of low or intermediate risk persons with metabolic syndrome or with CKD to the high risk group would increase the total proportion at high risk to 89.8%.
Risk factor goal attainment and co-morbidities across diabetes risk groups.
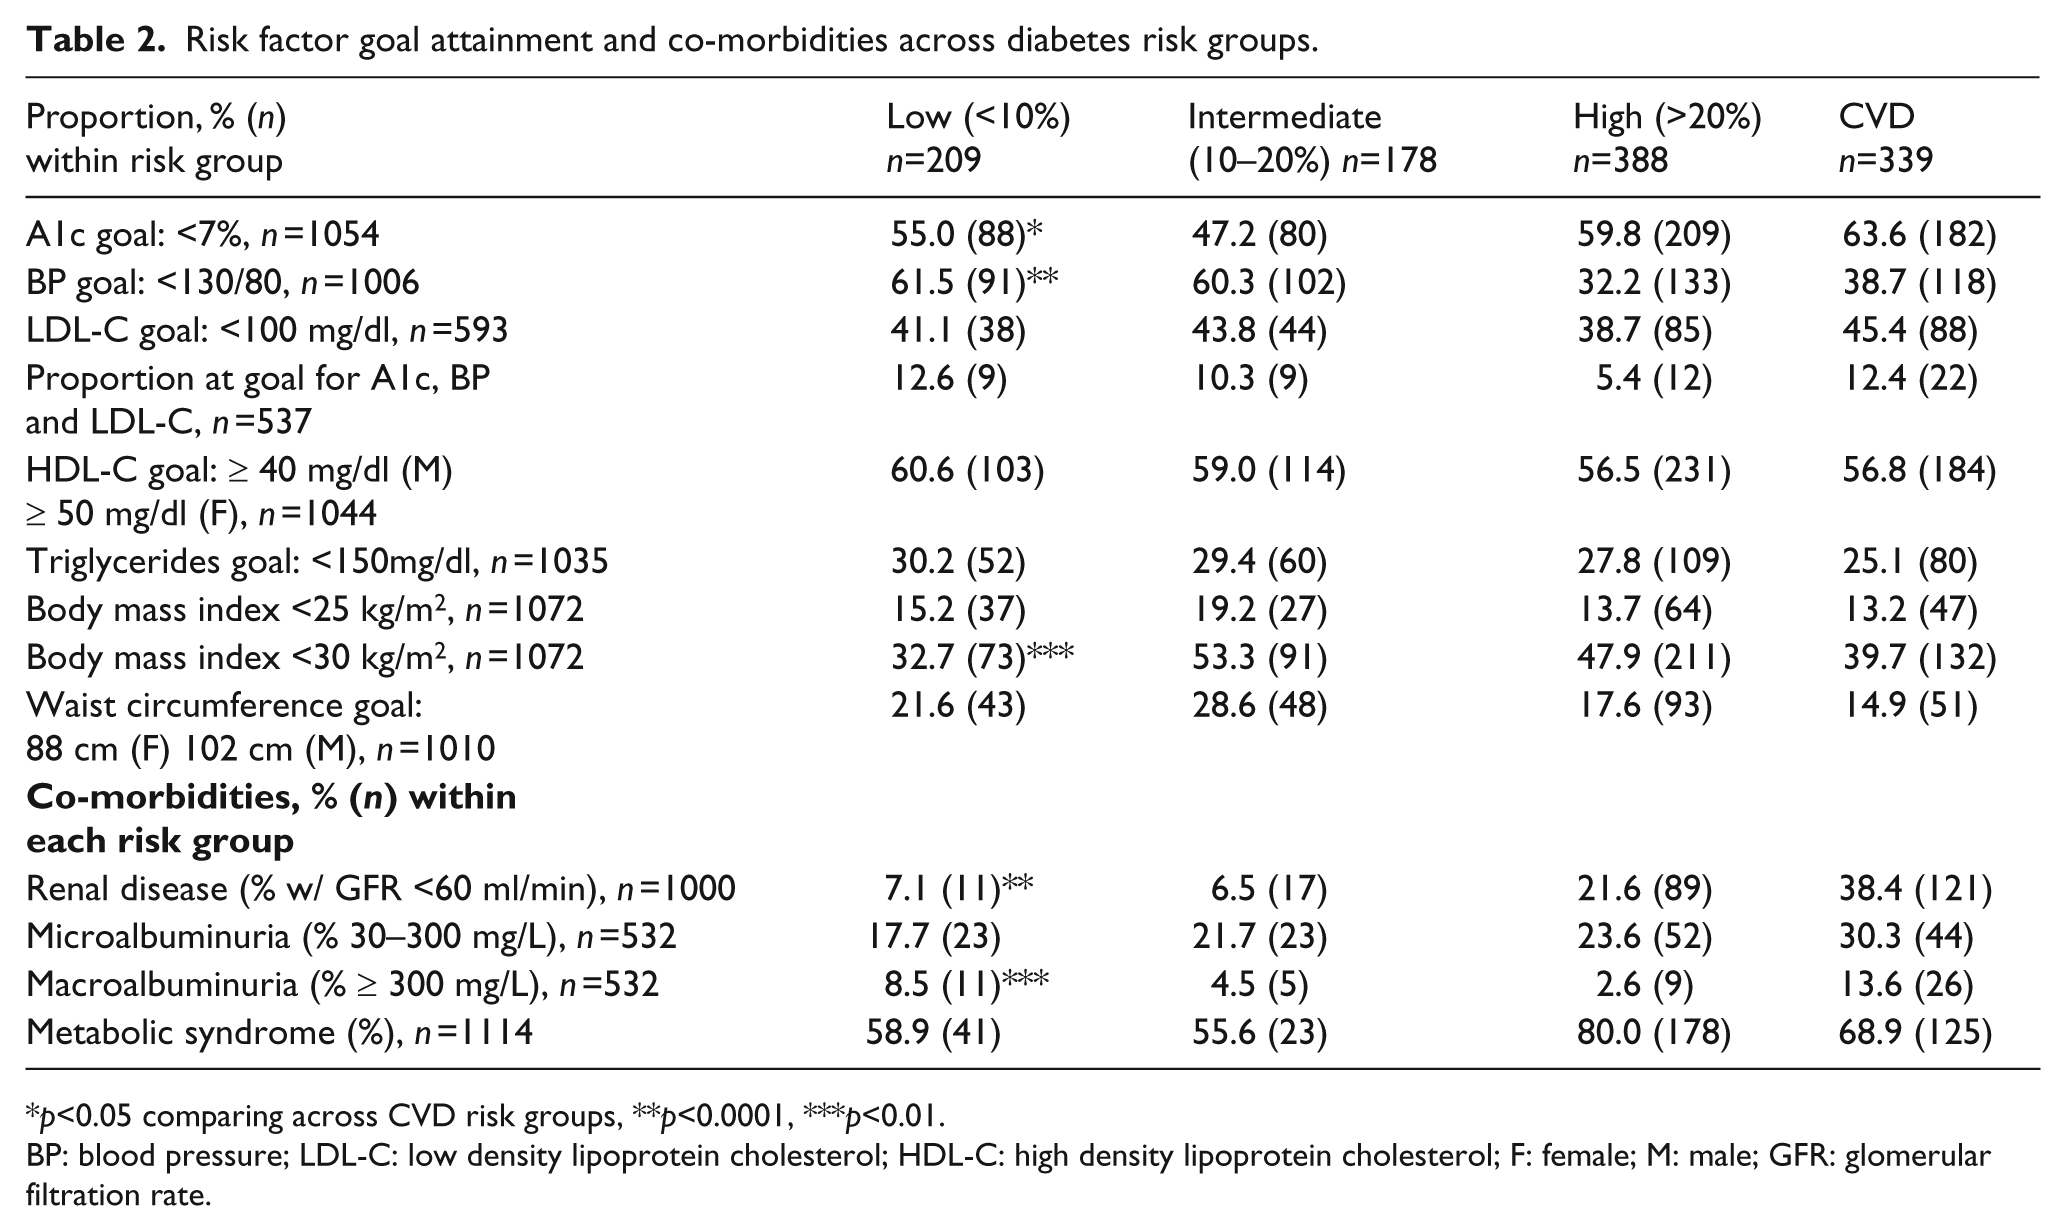
p<0.05 comparing across CVD risk groups, **p<0.0001, ***p<0.01.
BP: blood pressure; LDL-C: low density lipoprotein cholesterol; HDL-C: high density lipoprotein cholesterol; F: female; M: male; GFR: glomerular filtration rate.
In examining whether those DM at low risk were in part due to being on lipid and/or antihypertensive medications, in comparing the distribution of global CVD risk according to whether or not persons were on lipid-lowering or hypertension medications among DM persons without CVD, the proportion at high risk (>20% 10-year risk of CVD) was significantly greater in persons taking (54.1%) versus not taking (37.5%) lipid-lowering medication (p < 0.01). Similar results are seen for those on antihypertensive medication (p<0.0001). Medication use thus was identified mainly with those at higher risk.
Discussion
Many persons with DM in the US in 2003–2006 may be at lower short-term CVD risk than previously assumed with proportionately fewer high risk persons among females, Hispanics and younger persons with DM. Nearly half of females with DM are at low or intermediate CVD risk and approximately one-third of Hispanic and Black females with DM are at low calculated short-term CVD risk, in part because of their younger age at survey, based on Framingham risk algorithms. Given CHD risks would be even lower than our CVD risks, our data based on Framingham risk algorithms do not support DM as a universal CHD or CVD risk equivalent. Bulugahapitiya et al. 3 have also noted that the results of their meta-analysis do not support the hypothesis that DM is a CHD risk equivalent, and that decisions to initiate or intensify cardioprotective drugs for primary prevention of CHD should be based on each patient’s individual CVD risk assessment rather than a ‘blanket’ approach to treatment irrespective of the patient’s .absolute risk, especially in the scenario of where healthcare resources are limited. And most recently Ford 14 has noted mean Framingham and United Kingdom Prospective Diabetes Study (UKPDS) 10-year risk for CHD to be 12.6% and 11.6%, respectively, also confirming that many persons with diabetes do not reach CHD risk equivalent status. Our report is the first to describe global CVD risk in US adults with DM.
However, one could argue that the persistently high prevalence of metabolic syndrome, regardless of risk group, indicates that such persons, even if at low or intermediate short-term risk for CVD, may actually be at higher long-term risk, thus warranting an aggressive treatment approach recommended for all persons with DM. Moreover, many older persons with DM or those with insulin treated DM and/or type 2 DM in particular are at higher risk for CVD and should be aggressively treated. Long-term risk of CVD could be underestimated especially if other cardiometabolic risk factors not used in calculation of Framingham global risk such as obesity or elevated triglycerides or glucose/HbA1c are present. In our study, >50% of our low and intermediate risk adults with DM also have metabolic syndrome (and 7% have CKD), which would place them at greater longer-term risk. In fact, if these persons are classified as high risk, this would bring our proportion of diabetes subjects at high risk or with CVD from 59.6% to 86.8%, which more closely supports diabetes as being a CVD risk equivalent.
Our data showing poor attainment of HbA1c and CVD risk factor goals (less than two-thirds at HbA1c goal, under half at LDL-C goal, barely one-third of higher risk persons at blood pressure goal and <15% at goal simultaneously for HbA1c, blood pressure and LDL-C) indicate an important concern that should be a call-to-action to better educate healthcare providers on how to better address this important gap in care, particularly in those at highest CVD risk. In the evolution of guidelines for those with diabetes, particularly for HbA1c and blood pressure where recent studies have suggested stricter control may not provide added benefit in terms of CVD risk reduction,15,16 consideration of baseline CVD risk or co-morbidities may be important considerations with regard to therapeutic strategy. Our goals for blood pressure of <130/80 mmHg and HbA1c of <7%, in particular, may be changing paradigms given the findings of these recent studies.
There are important strengths and limitations to our analysis. The NHANES sample importantly ensures that we have a population of subjects representative of the US adult population from sample weighting methodologies; however, information on certain ethnic groups such as Asian-Americans was not available. Further, this study defines type 2 DM as being told of having DM at the age of 30 and older by a physician, the cutpoint used in previous NHANES investigations; 9 however, given that type 2 diabetes is often now being diagnosed at a younger age, there may be some under-identification in our definition. Thus, the cutpoint of age 30 may not be low enough to capture all those with type 2 DM and, in fact, estimates of the prevalence of type 1 DM among US adults are now closer to 5%, 17 lower than what our study reports based on our definition. Our findings regarding global risk distribution, however, are robust if we restrict our sample to those we define as having type 2 DM. Other limitations include the self-reported information for CVD morbidities and treatment; however, since participants brought in their medication containers, treatment information was largely verified. Moreover, our Framingham estimates of CVD risk are based on a limited set of CVD risk factors, place a great emphasis on age and do not include other cardiometabolic risk factors, HbA1c or duration of DM, which could impact on longer term risk. While the UKPDS risk score 18 does include these factors, a composite CVD risk score from UKPDS has not yet been made available; also, a close correspondence between UKPDS 10-year and Framingham 10-year CHD risk has been previously reported 14 , suggesting that our risk estimates are probably reasonably valid. However, since the total CVD risk algorithm used in our study was based on a larger Framingham primary prevention cohort and included only 428 subjects with diabetes, one could argue that the precision of the estimates obtained when we apply this to our cohort of DM subjects is uncertain. Hence, prospective validation is needed and ideally risk estimates should be based on a larger cohort of exclusively type 2 DM such as UKPDS. Also, short-term risk estimates may not be representative of longer-term or lifetime risk estimates. For instance, Marma et al. 19 have shown that while 82% of US adults free of CVD are at low short-term risk (<10% in 10 years), two-thirds of these individuals are at high lifetime predicted risk. Also, while our Framingham algorithm used was developed mainly on Caucasian subjects, the robustness of Framingham algorithms for use in other ethnic groups has been previously described. 20 Finally, our risk estimates are based on 10-year projections in a contemporary recent cohort of US adults with diabetes and may or may not represent absolute observed risks, for which prospective data would be required.
Many US adults with diabetes may be at lower short-term CVD risk than previously assumed, with proportionately fewer high-risk persons among females, Hispanics and younger persons with DM. However, older persons with DM or those undiagnosed or insulin treated are at particularly higher risk for CVD and need to be properly identified for aggressive clinical management. Future guidelines should consider combining both shorter and longer-term risk assessment approaches (incorporating factors such as metabolic syndrome, CKD, duration of diabetes and HbA1c) to identify persons where treatment will have the greatest impact on reducing morbidity and mortality from diabetes and associated CVD risk factors. The United Kingdom Prospective Diabetes Study Risk Engine 18 algorithms for the calculation of total CHD risk, while including HbA1c and diabetes duration, also focuses on short-term risk prediction and does not include metabolic syndrome or other factors beyond what is in the Framingham risk scores. An approach that bases the intensity of diabetes treatment on global risk, while also considering cardiometabolic risks not always apparent from short-term risk estimation, is needed to optimise opportunities for long-term prevention of cardiovascular complications. Most importantly, greater physician and patient education and emphasis on behavioural and lifestyle modification is required to focus DM treatment beyond the treatment of hyperglycaemia and to promote comprehensive management of all CVD risk factors.
Footnotes
Funding
This work was supported by a contract from Bristol Myers Squibb Pharmaceuticals.
Acknowledgements
This project was presented in part at the World Congress of Cardiology, Beijing, China, June 2010.
Conflict of interest statement
UI and GW are employees of Bristol Myers-Squibb. NW receives research funding from Bristol Myers-Squibb and Merck and is a consultant for Abbott Laboratories. KW is of no relation to NW.