
Abstract
States across the United States are enacting policies aimed at increasing computer science (CS) courses and content in K–12 schools. We explore the relationship between such policy with the capacity of high schools to teach CS courses and student access to and participation in CS courses. To do this, we focus on Georgia, a state that has had a robust CS education movement over the past two decades. This paper investigates two research questions: 1) What factors at the school or district level are related to whether a high school teaches CS in Georgia? 2) What factors are related to CS enrollment rates in Georgia high schools? We examine these questions within the context of national and state policy factors that increase capacity of schools to teach CS. We describe the results of correlation and regression analyses of publicly available data for each school and district from 2016 and school CS enrollment from 2012 to 2016 in answering these questions. Results indicate that the odds of a school offering CS in 2016 were greatest for schools that taught CS the prior year, although median income and school size were also significant factors when prior CS was not considered. For CS enrollment, the model that included prior CS enrollment rates explained the most variance, although school size, median income, and the percentage of students who identify as Asian were also significant when prior CS enrollment was not included in the model. CS-specific policy has the potential to mitigate the effects of school size and income by offering capacity supports to schools that do not currently offer CS and can contribute to the sustainability and growth of CS offerings. These results have implications for policy efforts beyond the state of Georgia and provide direction for future research examining the causes of sustained CS offerings and enrollment patterns.
Introduction
Despite the many national and state efforts to increase computer science (CS) learning opportunities, disparities still exist between which schools offer CS courses and which students have access to, participate in, and persist with computing. Current data shows that 47% of high schools in the United States (U.S.) offer a CS course (Code.org, CSTA, and ECEP, 2020), which shows growth from previous estimates over the past decade (Google Inc., Gallup Inc., 2015), but means that most schools still do not teach it. Many schools lack the necessary capacity to offer a CS course, such as a qualified teacher or necessary hardware (Google Inc., Gallup Inc., 2015). The availability of these types of resources determines whether or not a school is able to provide all students with access to CS or not. Schools that teach CS courses tend to be different from schools that do not teach CS: they tend to be in suburban areas, with predominantly white and Asian students and with low rates of poverty (Code.org, CSTA, and ECEP, 2020; Ericson and Guzdial, 2014; Lim and Lewis, 2020).
Even when students have access to CS learning opportunities, they may choose not to participate. Student enrollment in high school and university CS programs remains unrepresentative of the population. Students from marginalized races and ethnicities (Camp et al., 2017; Margolis et al., 2017), female students and women (Camp et al., 2017; Margolis and Fisher, 2002), students with disabilities (Ladner and Israel, 2016), students in urban and rural areas (Google Inc., Gallup Inc, 2017; Warner et al., 2019), and economically disadvantaged students (Margolis et al., 2017; Ericson and Guzdial, 2014; Bort et al., 2018) remain disproportionately underrepresented in CS courses. And even when students participate, their positive or negative experience in computing may determine whether or not they choose to continue their study of CS. Research has found that numerous aspects of a students’ CS education experience can affect the student’s intent to persist, such as a sense of belonging (Lewis, 2017), attitudes toward computing (Wanzer et al., 2020), self-efficacy (Ericson and McKlin, 2018), and student perceptions of computers, computer users, and computer scientists (Hansen et al., 2017).
Federal, state, or local policy can provide resources and guidance to increase school capacity to provide access to students and, to an extent, to support school efforts at recruiting representative participation and providing positive experiences in CS. To be effective at increasing equity and decreasing barriers, policy must be informed by the current disparities in computing education.
This work seeks to address questions relating to capacity, access, and participation in order to assess equity in secondary CS across the state of Georgia. Both top-down policy changes at the state level and grassroots efforts at the school and district levels have focused on increasing access to CS courses and instruction in Georgia. This paper focuses on two research questions: 1. What factors at the school or district level are related to whether a high school teaches CS in Georgia? 2. What factors are related to CS enrollment rates in Georgia high schools?
In this paper, we outline the policies and initiatives that have affected the CS landscape in high schools in Georgia. We then provide a review of the literature on K–12 CS capacity, access, participation, and experience. We describe our study design and data collection methods, followed by a summary of the correlation and regression analyses conducted with publicly available data. We discuss the implications of our findings, including how policy may relate to these results and how these results can, in turn, inform future policy. We conclude with an acknowledgment of the limitations of this study and how this study of one state can be situated into the national landscape of computing education.
Computer science education policy
National policy landscape
National programs and initiatives that affected the Georgia CS landscape.
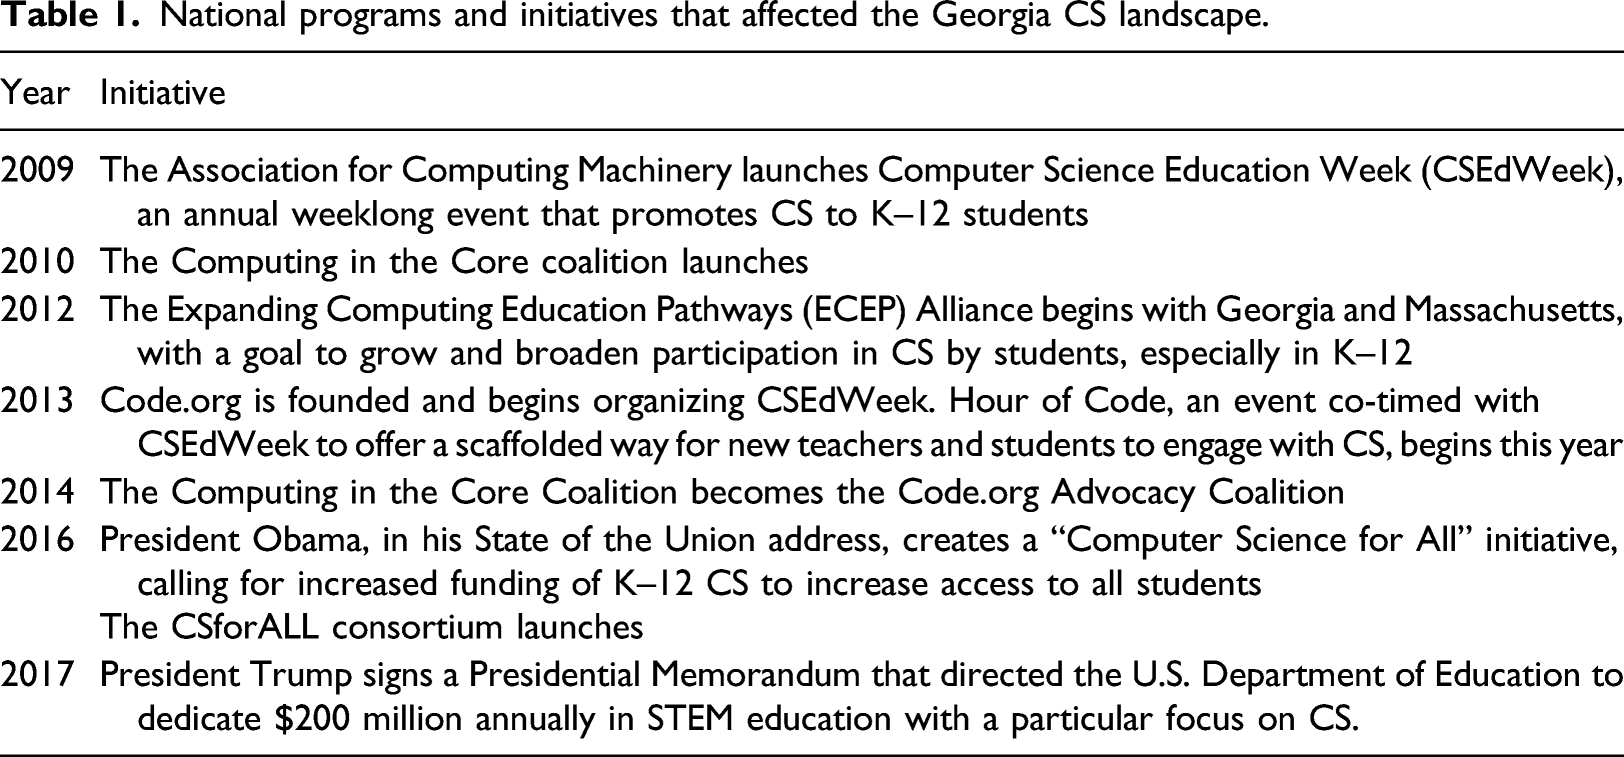
Computing in the Core initially launched in 2010 as a coalition between the Computer Science Teachers Association (CSTA), the Association for Computing Machinery (ACM), Microsoft, Google, the National Center for Women and Information Technology (NCWIT), and others in order to bring together the technology industry and nonprofit organizations to advocate for K–12 CS. The Code.org Advocacy Coalition grew out of the Computing in the Core coalition in 2014 and currently comprises over 70 members from industry, nonprofit, and advocacy organizations. The group developed a framework of nine state policy actions that have driven their work and are based on principles of equity, capacity, leadership, clarity, and sustainability. These nine policies have driven much of the policy work in states since 2014.
The ECEP Alliance, funded by the National Science Foundation’s Broadening Participation in Computing program since 2012, focuses on systemic change to educational pathways in order to increase and broaden participation in CS (Adrion et al., 2016; Ericson et al., 2016). The number of states with ECEP teams has grown to 22 states and Puerto Rico.
The CSforALL consortium, launched in 2016, is a national effort to support teachers, schools, and students in making rigorous CS integral to the K–12 student experience. The movement grew out of the CS4All and CSNYC efforts to bring high-quality CS education to every New York City (NYC) public school student over 10 years (DeLyser et al., 2016).
Due to the work of these organizations and others, the CS education policy movement has scaled up rapidly over the past decade. Prior to 2013, only 13 states and the District of Columbia (D.C.) had policies that supported CS education. By the end of 2020, all 50 states and D.C. have enacted at least one policy, and 44 states have three or more CS policies in place (Code.org, CSTA, and ECEP, 2020). These policies comprise key components of the education system that are important for ensuring that CS is a core part of K–12 education. The policies are intended to provide clarity about what CS is, increase capacity at the state and district levels, create formal leadership guiding the efforts, and ensure long-term sustainability of this new subject in K–12 schools. Generally, analysis of state policy has supported that these CS policies are correlated with broader implementation of K–12 CS (Code.org, CSTA, and ECEP, 2019).
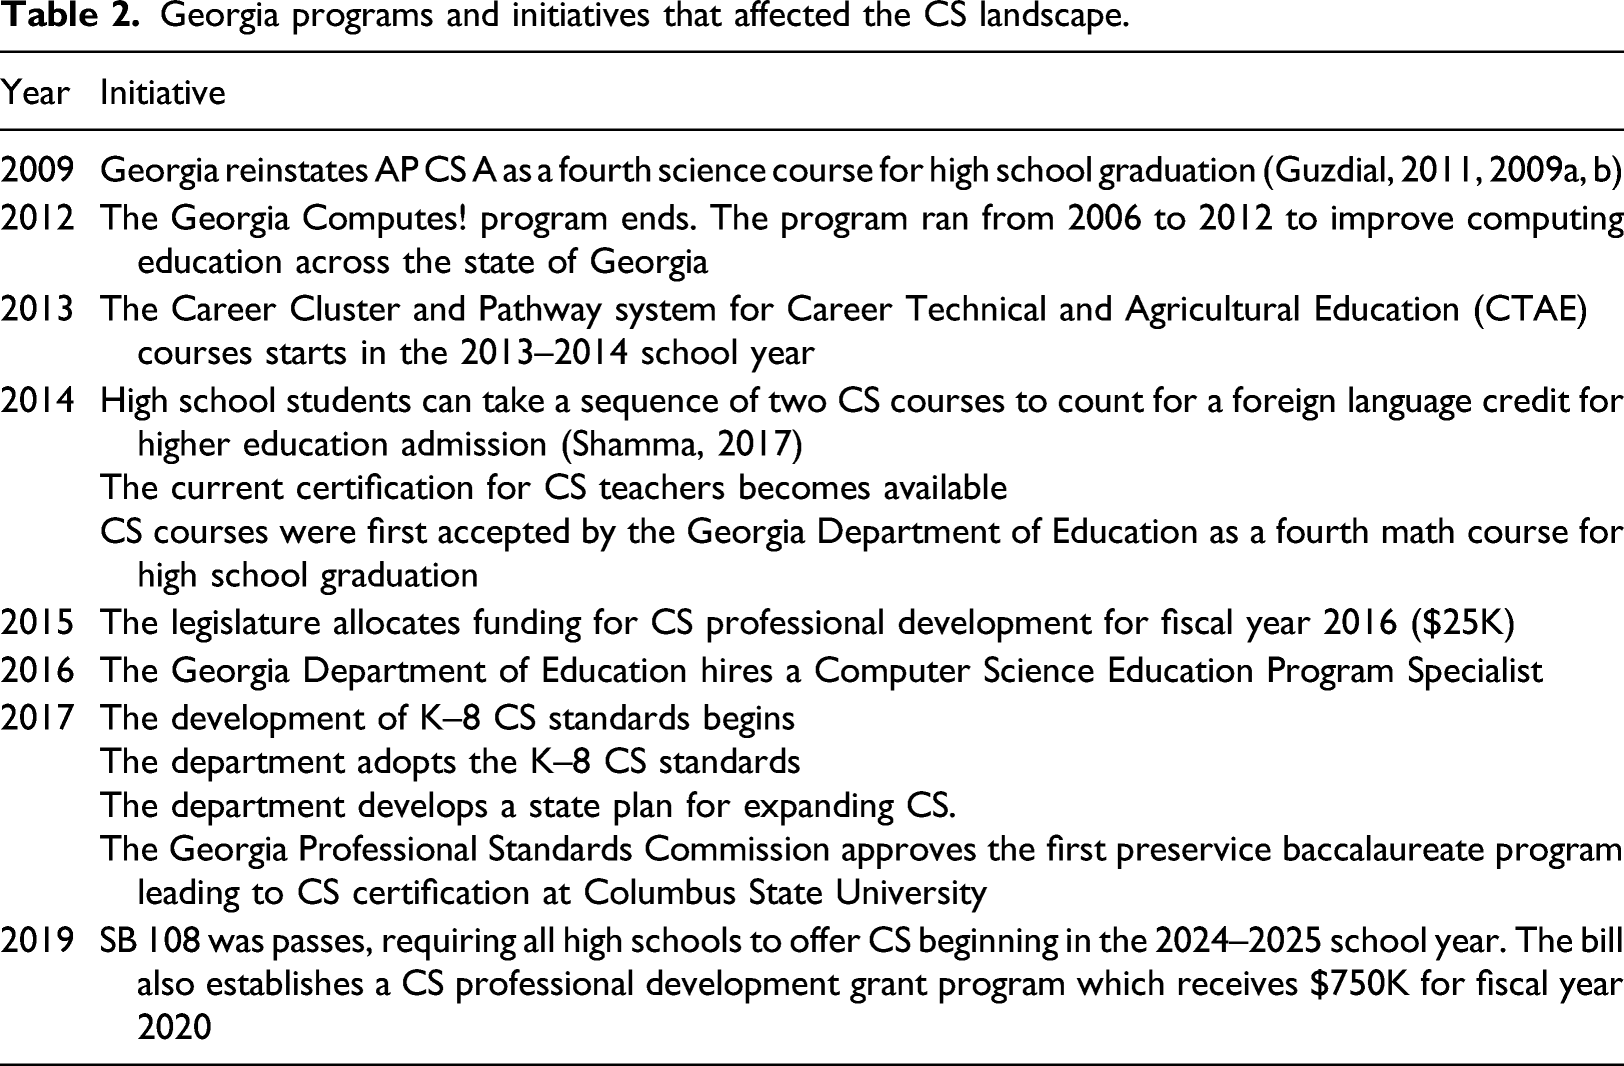
K–12 computing in the state of Georgia has benefited from the national efforts described above as well as local advocates and coalitions. While graduation requirements and course codes are decisions made at the state level, decisions on budgets, course schedules, and teacher assignments are made at the district level; Georgia has 180 school districts.
Georgia programs and initiatives that affected the CS landscape.
Literature review
The CAPE framework provides a useful structure for the organization and analysis of K–12 CS policy and implementation studies (Fletcher and Warner, 2021). The CAPE framework presents four levels of CS education: Capacity for, Access to, Participation in, and Experience of CS education (CAPE). These levels build upon one another and compound issues of inequity; for example, questions of access first require an understanding of capacity, and experience in CS education cannot be understood without opportunities for participation in CS education. The CAPE framework provides a structure for understanding systemic barriers at each level of CS education, which is necessary to begin the work of dismantling these barriers. This structure is useful for organizing the relevant literature as well as our analysis and discussion.
The following sections summarize the existing literature around the capacity for, access to, participation in, and experience of CS education. Our work focuses primarily on capacity, access, and participation, but the literature summary that follows briefly addresses experience in order to provide context for this and future work.
Capacity for CS education
Capacity for CS education refers to the availability of resources to support and maintain CS instruction in schools. Capacity can be affected by graduation requirements, such as when Georgia began to allow AP CS A to count as a science credit (Guzdial and Ericson, 2014; Guzdial et al., 2012) or Utah allowed the Exploring Computing Science (ECS) course to fulfill an existing graduation requirement (Hu et al., 2016). Capacity is also affected by inadequate resources, such as lack of funding or equipment, and by teacher capacity, including trained and credentialed teachers. A representative survey of school administrators revealed that the main reasons for not offering CS were related to capacity: lack of time to dedicate to courses not directly addressing testing requirements, not enough money to train or hire teachers, and no trained teachers available (Google Inc., Gallup Inc., 2015).
Several state initiatives have been borne out of CS education task force reports or landscape surveys of the field. Such reports, while summarizing capacity, access, and participation data, often set goals around access and participation and make recommendations around capacity-building. For example, Arkansas’s 2016 Computer Science and Technology in Public School Task Force report and the subsequent 2020 Computer Science and Cyber Security Task Force Report both featured strong recommendations for statewide capacity-building, such as the importance of ongoing state funding (Arkansas Computer Science and Technology in Public School Task Force, 2016) and increasing teacher capacity (Arkansas Computer Science and Technology in Public School Task Force, 2020).
Similarly, state members of the ECEP Alliance are encouraged to create a landscape report as an early step in their CS efforts (ECEP, 2020). These reports vary in terms of focus. Some reports take a diversity approach, focusing on access to and equity in CS for students (Martin et al., 2015). Other reports focus on the pipeline of students to jobs by discussing the development of a technology workforce (Massachusetts Department of Higher Education, 2014; Fletcher, 2014). There are also reports that take a broad-stroke summary approach to what is happening in K–12 CS education across the state (DesJardins and Martin, 2013; Burke et al., 2017; Ottenbreit-Leftwich and Biggers, 2017; Deloge et al., 2016). No matter their focus, these reports generally compile data to answer questions around statewide capacity for expanding CS education, such as available CS offerings, organizations working on expanding CS education, availability of teacher professional development, industry job gaps and intern capacity, and other existing partnerships and efforts. As a result, state leaders have a better idea of existing capacity as well as gaps at the state level.
Several research studies on CS offerings highlight the importance of resources and teacher preparation, and how school access to these resources varies based on urbanicity, socioeconomics, or demographics. Park and Lee studied 12 rural high schools in Oklahoma and found that rural schools face a lack of curriculum and other resources, such as computers and software, more than urban or suburban schools (Park and Lee, 2016). Similarly, research on CS classrooms in Maryland found that the percent of CS teachers who were certified in CS varied alarmingly across geographic region (e.g., urban, suburban, and rural) (DesJardins and Martin, 2013). Further, challenges reported by CS teachers in Maryland revealed disparities in teacher responses by geographic region but included rapidly changing technology, lack of school support, and lack of resources and opportunities to advance their own knowledge.
Statewide summits have been used as a strategy for building out teacher and administrator capacity, such as in Maryland and North Carolina (DesJardins and Martin, 2013; Frye et al., 2017). After identifying CS teacher needs in Maryland, DesJardins and Martin focused on community building by way of professional development for high school teachers, development of a CSTA chapter, and statewide summits for teachers, administrators, university representatives, and industry leaders (DesJardins and Martin, 2013). In North Carolina, CS4NC planned summits for 2017 and 2020, bringing together representatives from various efforts to build a shared vision. The 2017 summit addressed issues of access by laying a groundwork of policy recommendations around capacity, including the need for CS standards and the alignment of high school graduation requirements with higher education admission policies (Frye et al., 2017).
Access to CS education
Access to CS education in the CAPE framework centers around the opportunities for students to learn CS, such as a school offering a CS course. The College Board’s Advanced Placement (AP) courses in CS are the only standardized measure of K–12 CS learning in the U.S. Currently, there are two AP CS courses: AP CS Principles (CSP) and AP CS A. Killen et al. explored Maryland schools before and after AP CSP was introduced as an AP course in the 2016-2017 school year (Killen et al., 2019). The introduction of AP CSP increased the number of CS courses offered by Maryland public high schools overall, but it did not appear to have a large effect on bringing CS into schools where it had not been taught previously. On the other hand, during the time frame of the Georgia Computes! Project, the number of schools offering and students taking CS courses increased (Guzdial and Ericson, 2014). This project targeted multiple stages of the computing education pipeline across the state of Georgia (Bruckman et al., 2009; Guzdial and Ericson, 2014; Guzdial et al., 2012).
Access to CS education can describe not only whether a school has CS courses but also whether those opportunities are available in schools in low-income areas or with high percentages of historically disadvantaged students. Ericson and Guzdial used AP CS A data to see who takes the exam and how they performed on the AP test (Ericson and Guzdial, 2014). They found that wealth indirectly influenced the number of students taking the exam, by way of making the course more available. During a statewide rollout of the ECS curriculum in Wisconsin, Bort et al. reported a greater effect on schools with an economic disadvantage, increasing their likelihood of offering a CS course (Bort et al., 2018). Rhoton, upon examining CS course offerings across the state of Virginia, found significant disparity in access for students in rural areas as compared to suburban or city areas (Rhoton, 2018). The most recent nationwide analyses on the effect of geographic areas on access to CS shows 57% of suburban schools offer a CS course in high school, whereas only 44% of urban schools and 43% of rural schools offer CS at the same level (Code.org, CSTA, and ECEP, 2020). In New York City, among the CSNYC and CSforALL efforts, Fancsali et al. found that CS was more likely to be in schools that served more white and Asian students than Black and Latino students (Fancsali et al., 2018).
Participation in CS education
Equitable participation in CS education involves asking questions of who enrolls in a CS course when it is offered at a school and whether that participation is representative of the school population. A disparity index comparing demographics of students taking the AP CS exams to student demographics in the schools that offer AP CS found that Native Hawaiian/Pacific Islander students, Black/African American Students, Native American/Alaskan students, and Hispanic/Latino/Latina students were 2–3 times less likely to take an exam than their white and Asian peers, even when they attended a school that taught it (Code.org, CSTA, and ECEP, 2020). Participation has also been found to vary according to students’ math backgrounds. Torbey et al. used multilevel mixed-effects logistic regression models to analyze factors that might predict student participation in CS courses (Torbey et al., 2020). They found that students who took Algebra I before high school had more than double the odds of enrolling in a high school CS course.
One specific course that is often shown to improve equity in participation is ECS, an introductory CS course that was created in response to findings in Stuck in the Shallow End (Margolis et al., 2017). This course is often adopted on city- and state-wide levels (Ryoo et al., 2013; Goode and Margolis, 2011). ECS began in Los Angeles where, during 2012–2013, ECS enrollment included 45% female students, 81% Latino students, and 6% African American students, which is nearly representative of Los Angeles’ population (Goode et al., 2014). Chicago is another city-wide adopter of the ECS curriculum, reporting equitable learning gains for students (Reed et al., 2015; McGee et al., 2018). An analysis of ECS efforts in Utah showed an increase in enrollment in CS courses, as well as increased participation by female and Hispanic/Latino students (Rich and Hu, 2019). Alabama has also engaged in statewide interventions with ECS, where 78% of the enrollment in their ECS courses are students from underrepresented racial and ethnic groups and half are female students (Qazi et al., 2020).
Experience of CS education
Experience of CS education considers the various outcomes of participating in computing courses and how the outcomes differ among subpopulations, such as women or students that identify as Black, Indigenous, or a Person of Color. Research has shown that attitudes toward computing differ across gender, race, and ethnicity (Badagliacco, 1990), which can affect students’ intentions to persist in the field (Barker et al., 2009). Dempsey et al. found that, among students enrolled in an introductory computing course, there is a gap between men’s and women’s CS identity and, in turn, their intention to major in CS (Dempsey et al., 2015). Additionally, students’ perceptions of computing stereotypes can affect whether they feel they fit in computing (Lewis et al., 2016).
These gaps can be mitigated with careful interventions designed to improve student experiences. Projects catered towards improving students’ experiences with computing can improve their retention (Freeman et al., 2014; DiSalvo et al., 2014; Ericson et al., 2014). Excellent teacher pedagogy and instruction can also affect students’ decisions to pursue future CS courses (Beyer, 2014). Additionally, creating an environment that promotes a sense of belonging can help students persist in CS (Lewis, 2017).
Literature summary
The research summarized above highlights the importance of considering equity in all four dimensions—capacity, access, participation, and experience.
Our work differentiates itself from these valuable studies by exploring a given state as is, rather than assessing the effects of a particular intervention or curriculum. This is important for bridging theory with implementation in a complex system. The methods used in this study align with prior work but also expand upon it with the use of regression analyses to model the current landscape of CS in Georgia and various factors that may correlate with access to and participation in CS education in schools.
Methods
For this study, we focused on public high schools in Georgia. In the U.S., education is run by each of the states. Some states choose a top-down approach with state-level policy decisions, while other states have a bottom-up approach with districts deciding the policy for each of their schools. In Georgia, most decisions are made at the state level within the Georgia Department of Education. Schools are organized into districts which are either county- or city-based. Georgia has 159 counties, and thus 159 county-based school districts, as well as 21 city-based school districts. The relationship between county and school district is relevant for data collection on our variables, as some information is available at the county level that is not typically reported at the district level.
Our study uses the time frame of 2012–2016. We refer to school years by the ending year. For example, CS enrollment rates in 2016 refer to the school year that starts in August 2015 and ends in May 2016. Unless otherwise noted, variables use data from 2016.
Definition of a computer science course
A persistently debated question is what qualifies as “computer science” at the K–12 level. Part of this is due to CS being classified into different departments in different states (Wilson et al., 2010). In Georgia, CS is within the Career Technical and Agricultural Education (CTAE) department, which provides nine different computing pathways. Each pathway consists of a progression of three computing-related courses related to a particular theme. Themes include CS, Information Technology, Cybersecurity, Web design and development, and game design.
Computer Science Courses in Georgia that count towards high school graduation requirements and the year they were created or counted towards graduation.
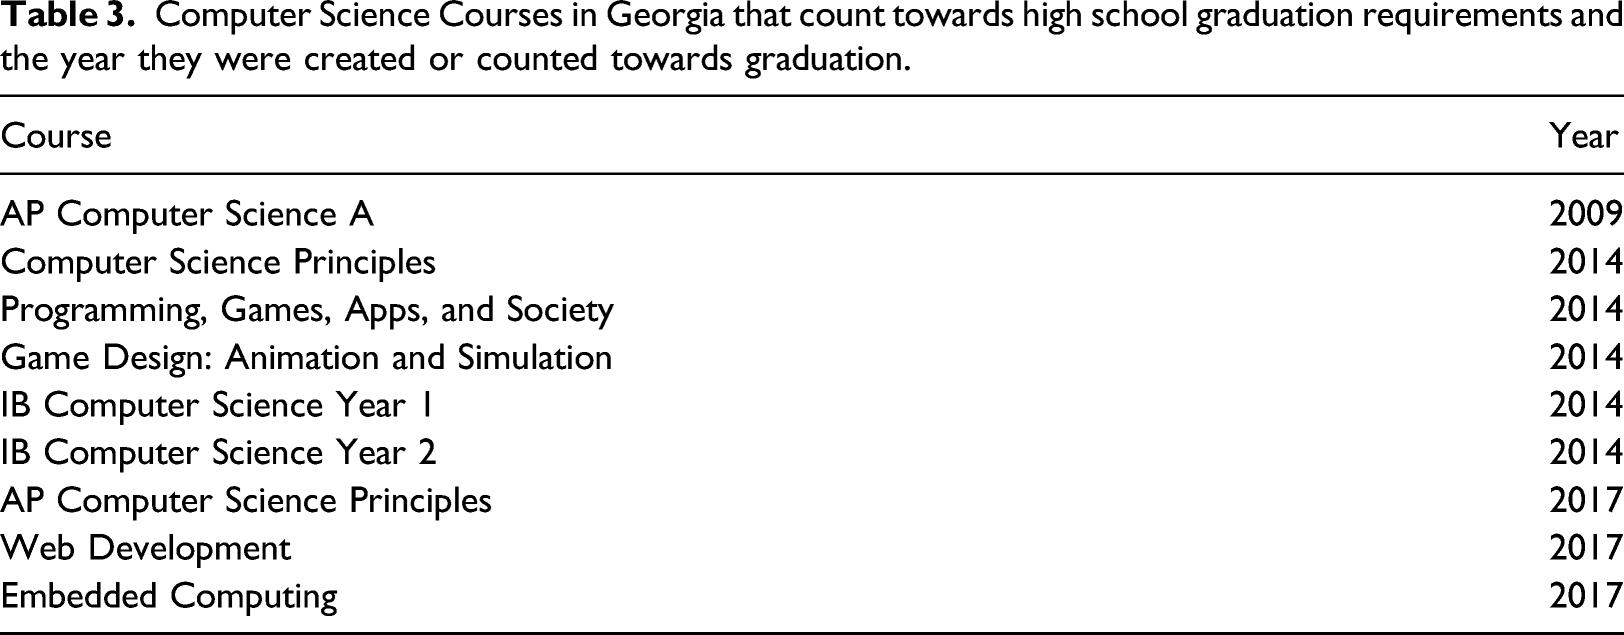
During the time frame of our analysis (2012–2016), not all nine of the courses were available. The only course we considered in 2012 and 2013 was AP CS A, because it was the only computing course that counted towards graduation requirements at the time. Five additional CS courses were added during the 2013-2014 school year when the Georgia Department of Education updated the CS course offerings. Three of these courses—AP CSP, Web Development, and Embedded Computing—were not released until after 2016.
References to CS in Georgia throughout the rest of this paper only include the six courses that counted for graduation requirements and were available at some point during the 2012–2016 time frame of this study.
Variable identification
We conducted a content analysis (Elo and Kyngäs, 2008) on ECEP Alliance state team landscape reports and similar surveys to select variables for our study. We reviewed the landscape reports available at the time to identify which variables to explore in our study of CS in Georgia. In addition to the ECEP reports, we also included a similarly styled report based on the landscape of CS in the United Kingdom (Kemp et al., 2016). In addition to informing our content analysis, the United Kingdom report conveys that the problem is larger than the local Georgia context and offers the potential that these analyses may be useful in international contexts.
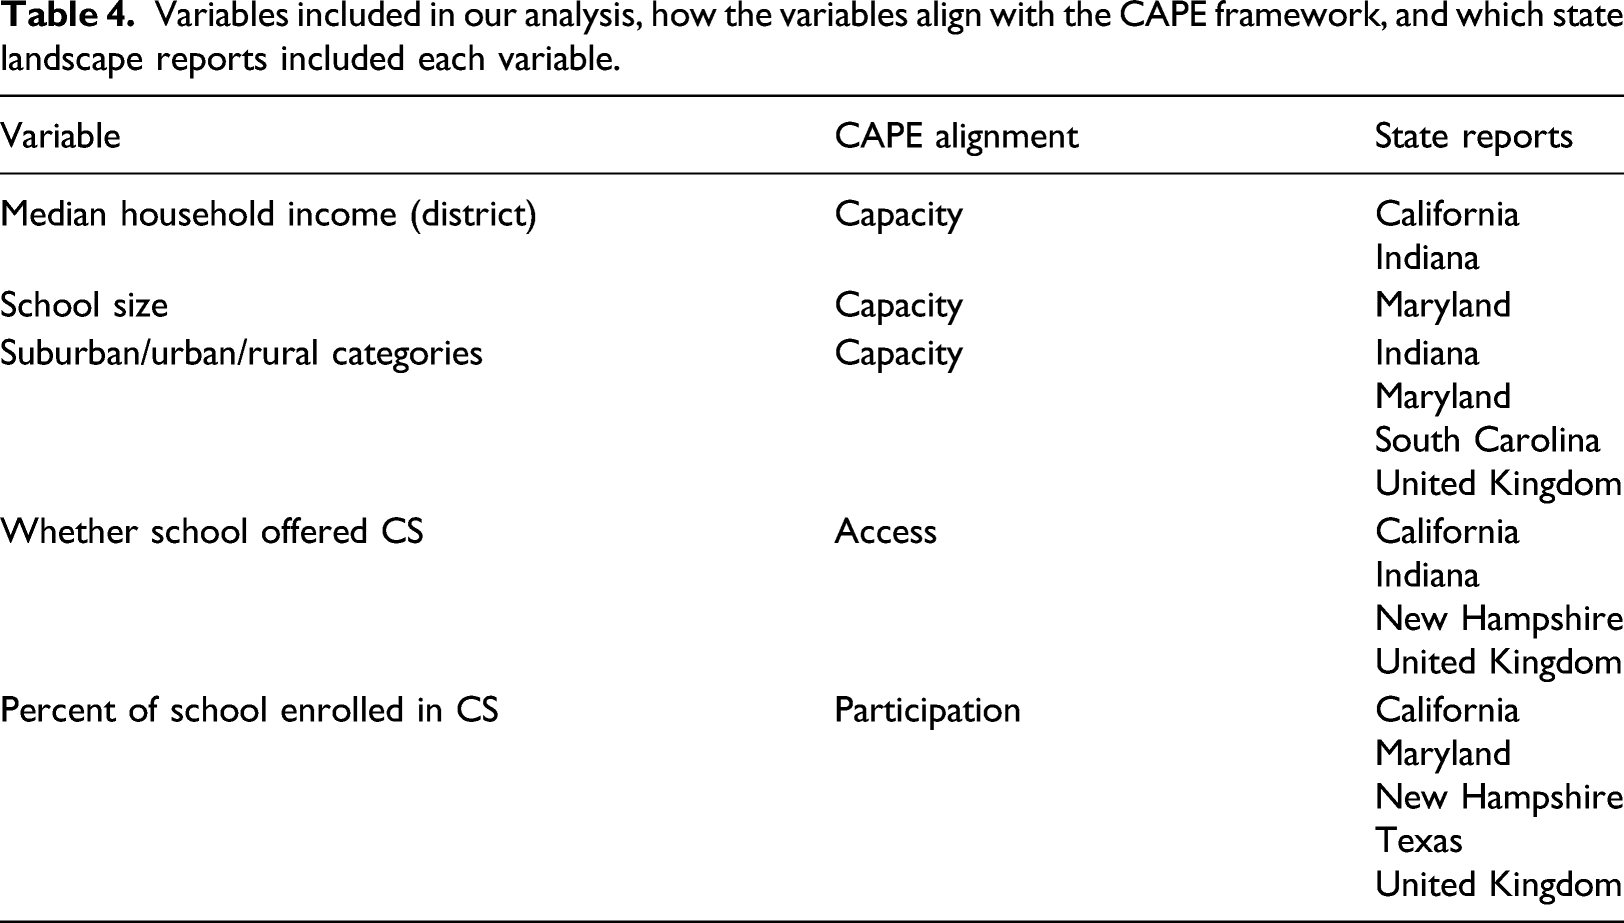
We selected variables for our study based on this content analysis of the landscape reports and whether the variables were included in publicly available data sets. Based on this requirement, we selected the variables of median household income, school size, suburban/urban/rural categorization, racial and ethnic demographics, whether a school offered CS, and the percent of the school population enrolled in a CS course. Some variables in the landscape reports were obtained via surveys sent to all schools or CS teachers; these variables could not be included in our study because they were not included in public data sets.
Variables included in our analysis, how the variables align with the CAPE framework, and which state landscape reports included each variable.
We chose to focus the urban/rural categorization variable on whether or not a school was situated in a suburban area. Prior work has found a lack of capacity and access to CS in rural (Rhoton, 2018; Park and Lee, 2016; Warner et al., 2019) and urban (DesJardins and Martin, 2013) environments. Conversely, there is evidence that suburban areas are more likely to have CS access than rural and urban areas (Code.org, CSTA, and ECEP, 2020; DesJardins and Martin, 2013). As such, we chose to model the suburban status of a school as a binary variable to align with previous findings on the effects of geography on CS access.
Although landscape reports often included the demographics of students in CS courses, including gender and race/ethnicity, we did not include classroom-level enrollment data in this study. Instead, student demographic variables, such as race and ethnicity, were analyzed in terms of overall student enrollment in each school. This allowed us to determine differences in access to computer science courses by each demographic group. This shifted our analysis from participation of students from various racial and ethnic groups to the access that these students had to a CS course.
Further, we chose to focus race and ethnicity variables on the percentage of white and Asian students enrolled at the school. As previously discussed, schools that teach CS courses tend to be predominately enrolled by students who identify as white and Asian (Camp, 2012; Code.org, CSTA, and ECEP, 2020; Lim and Lewis, 2020). As such, in a model of enrollment in CS, schools with higher percentages of white and Asian students could correlate with and predict schools with higher CS enrollments. Conversely, schools with higher percentages of Black, Hispanic, and Indigenous students could correlate with and predict schools with lower CS enrollments. We chose to model white and Asian demographics to align with and provide further evidence of the prior literature findings of the overrepresentation of white and Asian students in computing.
Additional variables included in state landscape reports.
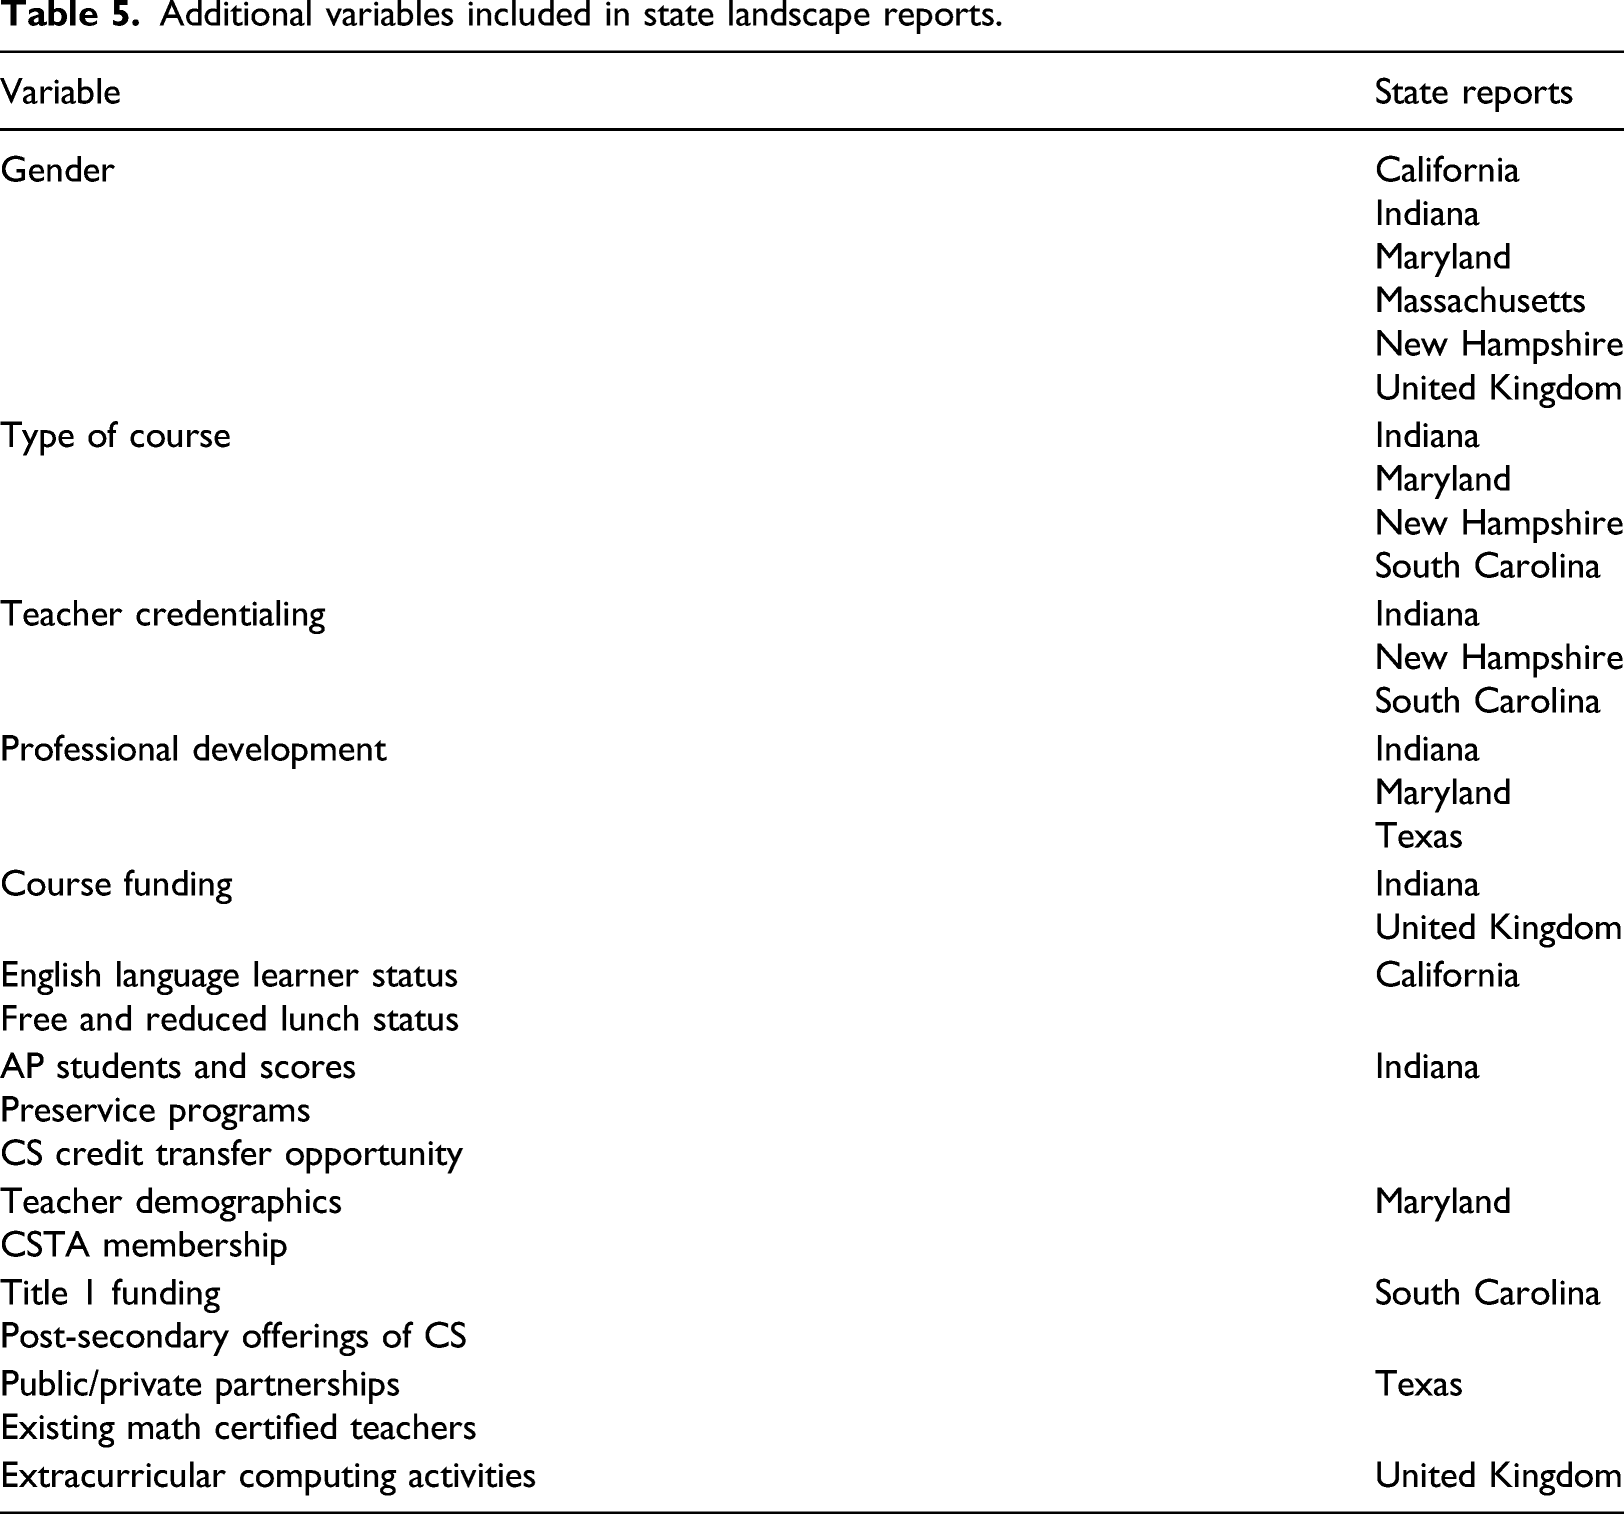
Some variables included in landscape reports had publicly available data, but we chose not to include in our analysis. Namely, free and reduced lunch was reported on in California’s landscape report (Martin et al., 2015), and that data is available through national repositories. We found, however, that the variable of median income was significantly and strongly correlated with free and reduced lunch status. Instead of including both and possibly obfuscating our findings and implication, we chose to only use median income in our model.
CAPE framework alignment
The CAPE framework (Fletcher and Warner, 2021), outlined in our Literature Review section, helped to guide the formulation of our research questions. Given the hierarchical nature of the CAPE framework, where each level depends on each prior level (e.g., student experiences in CS cannot occur without a school having the capacity to offer CS, subsequently providing access to CS, and then having students participate in CS), we focus our analyses on how capacity can affect access (RQ1) and how capacity and access can affect participation (RQ2). As such, we aligned our variables with the CAPE dimensions of capacity, access, and participation. These alignments are presented in Table 4 and discussed below.
We classified a variable as relating to capacity if it was a county- or district-level variable, and thus more focused on what resources may be available to the school beyond the school itself. This includes median income, which is measured on the county-level, and whether the school was classified as a suburban school, which was provided at a district-level. We also classified school size as a capacity variable, given that the number of students enrolled at a school can affect funding by the state and national governments.
Variables categorized as access included race and ethnicity as well as whether a school offered CS. As discussed in the literature review, access to computing opportunities varies for different groups of students. The binary variable of whether a school offered CS was classified as an access variable given the definition of access used in the CAPE framework: “access can be operationalized as attending a school that offers CS courses” (Fletcher and Warner, 2021). If a school has any students enrolled in a CS course, then students at the school have access to a CS course.
Given that the binary of if a school has CS was classified as access, we classified the continuous variable of how much of a school was enrolled in CS as participation. The CAPE framework “operationalize[s] participation as enrolling in CS courses when offered by the school” (Fletcher and Warner, 2021). How many students are enrolled in a school, even if scaled by school size, moves beyond the question of if a school has (i.e., offers access to) CS and onto the question of how many students, and which students, participate in the course.
It is important to note that how we align our variables to the CAPE framework is reflective of our interpretation of the framework, our research questions, and the data available to us. If others embark on similar analyses in the future, we encourage them to not adapt our alignment blindly. Rather, we suggest researchers carefully consider the context in which the research is taking place and make deliberate decisions about the alignment to the CAPE framework. Additionally, the CAPE framework is in its infancy, and as more work is done to build it out and support its theoretical structure, these alignments may shift over time. While we include outcome variables in our models based on access and participation, these are not the only variables that could serve as outcomes for these levels. These outcomes may vary according to the scope and intent of the project.
Data collection and processing
Data were collected on the variables identified from the landscape reports. Sources for each variable are as follows.
County-level data for 2016, such as median income, were obtained from the U.S. Census Bureau’s American Community Survey 5-year data. County-level data is useful because, as previously discussed, each county in Georgia is synonymous with a school district. This enables the inclusion of data that is not typically reported at the school level.
School-level data for 2016, such as school size and student demographics, were obtained from the National Center for Education Statistics (NCES) Elementary and Secondary Information System (ELSi). School size was measured as the total number of students enrolled in a school. Private schools, schools that closed or opened at any point between 2012 and 2016, and schools that changed status (e.g., from charter to public) at any point during that time period were removed from the data set. Additionally, state schools (e.g., Department of Juvenile Justice schools), alternative schools, and special education institutions were removed. This filtering resulted in 361 public high schools in Georgia for our analyses. As a result of this process, 25 schools that offer CS according to the Georgia Department of Education, and consequently, 1141 students enrolled in CS, were not included in our study.
The suburban variable data came from the NCES urban-centric locale codes. These codes include subcategorizations of city, suburban, town, or rural. We dummy-coded a variable to be true if the urban-centric locale code was within the suburban category and false otherwise.
The CS course offerings and enrollment data came from the Georgia Department of Education and included only the courses previously described for the schools listed in our data set. CS enrollment was calculated as the percentage of students at the school enrolled in a CS course to allow for relative comparison among schools of different sizes. For example, 10 students in CS at a school with 200 students should be represented differently than 10 students in CS at a school with 2000 students. The variable of prior CS participation is an average of the CS enrollment rates from 2012 through 2015 at each school.
Analysis
We modeled our data with correlation and regression analyses to explore the ways in which different variables are related to whether a Georgia public high school teaches CS and the percentage of students in a school enrolled in at least one CS course.
To answer our first research question (What factors at the school or district level are related to whether a high school teaches CS in Georgia?), we used binomial logistic regressions to explore the relationship between capacity variables and an access-based binary outcome variable of whether or not a school taught CS in 2016. To answer our second research question (What factors are related to CS enrollment rates in Georgia high schools?), we used hierarchical multiple regressions to build a model that includes capacity and access variables with a participation outcome variable of CS enrollment rates in 2016.
All analyses were run in IBM SPSS Statistics 24.
Descriptive statistics and correlation analysis
Descriptive statistics (n = 361 schools).
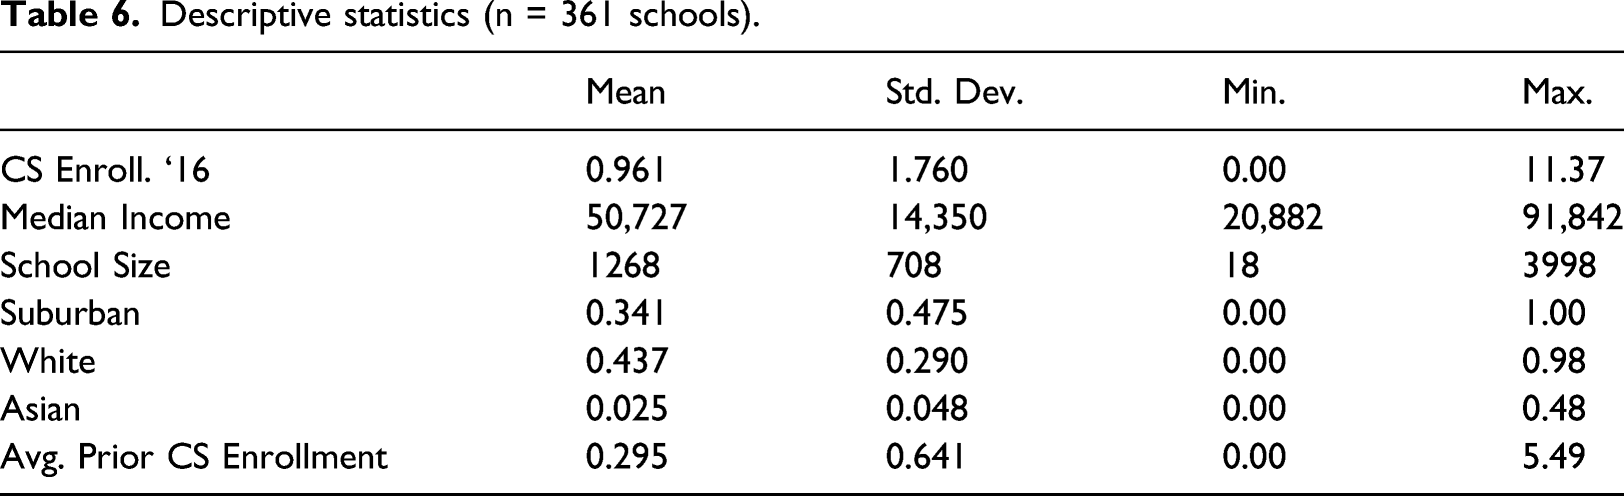
The relationship between each variable was assessed via a Pearson’s correlation. There was a statistically significant, strong (|r| > 0.5) positive correlation between the percentage of a school enrolled in a CS course in 2016 and average prior CS enrollment (r(359) = 0.70, p < 0.01)). Additionally, there was a statistically significant, strong positive correlation between school size (number of students enrolled in the school) and median income (r(359) = 0.60, p < 0.01)), as well as between percentage of students that identify as Asian enrolled at the school and the average CS enrollment rates from 2012 to 2015 (r(359) = 0.62, p < 0.01)). A significant, moderate (0.3 < |r| < 0.5) positive correlation was found between the percentage of a school enrolled in a CS course in 2016 and median income (r(359) = 0.32, p < 0.01)) and school size (r(359) = 0.33, p < 0.01)), which held true for average prior CS enrollment as well.
Analysis of factors related to school CS offering
Two binomial logistic regressions were used to explore the first research question related to whether a school offered CS.
The first binomial logistic regression included variables that relate to a school’s capacity: median income in the county, school size, and whether the school is in a suburban setting. Median income and school size were standardized using z-scores, and these standardized versions were used in the regression analyses. This means that the interpretation of the regression coefficient (B) changes to reflect a change in the outcome variable for a one standard deviation increase in these predictor variables. For the outcome variable, we assigned a binary value to each school based on whether any students were enrolled in CS in 2016. Any student enrollment indicated that the school taught CS, whereas zero student enrollment indicated that the school did not teach CS. Because we interpret from the CAPE framework that variables of capacity must be sufficient in order to achieve access, we opted to assign the capacity variables as predictors of an access variable.
Results of binomial logistic regression without prior CS (Nagelkerke R2 = 0.343).
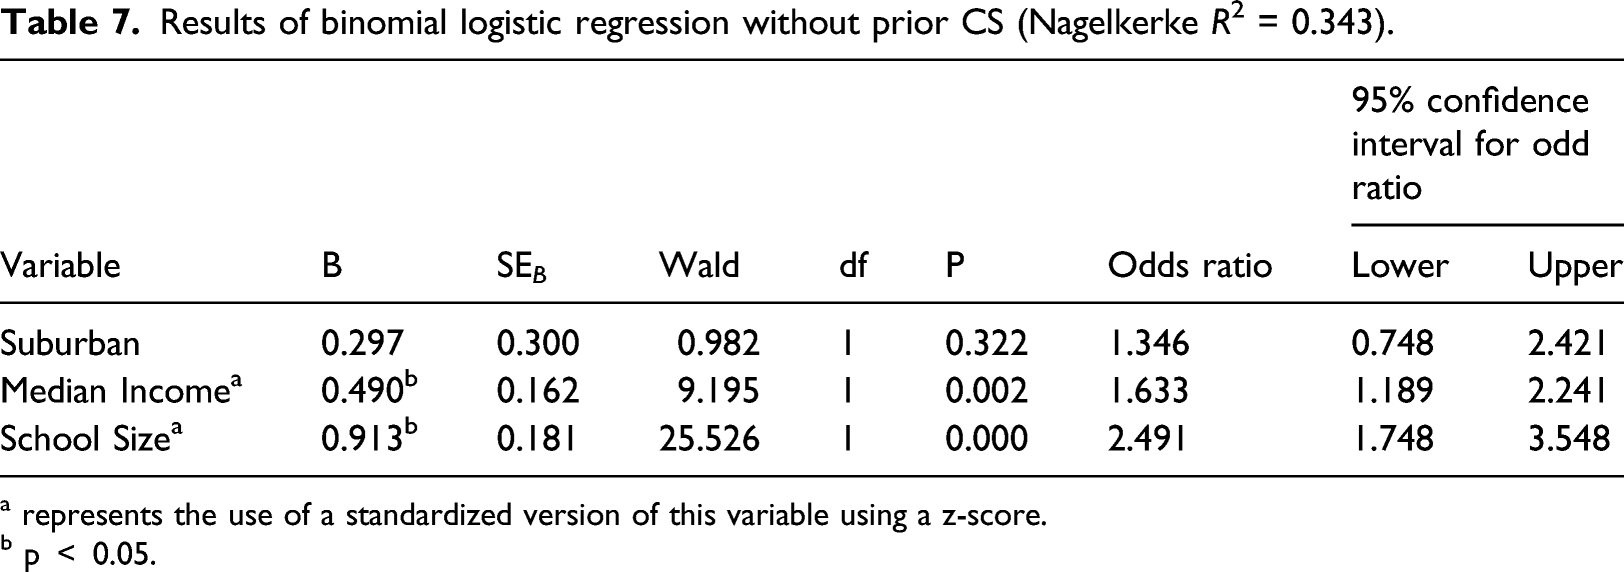
a represents the use of a standardized version of this variable using a z-score.
b p
Results of binomial logistic regression with prior CS (Nagelkerke R2 = 0.571).
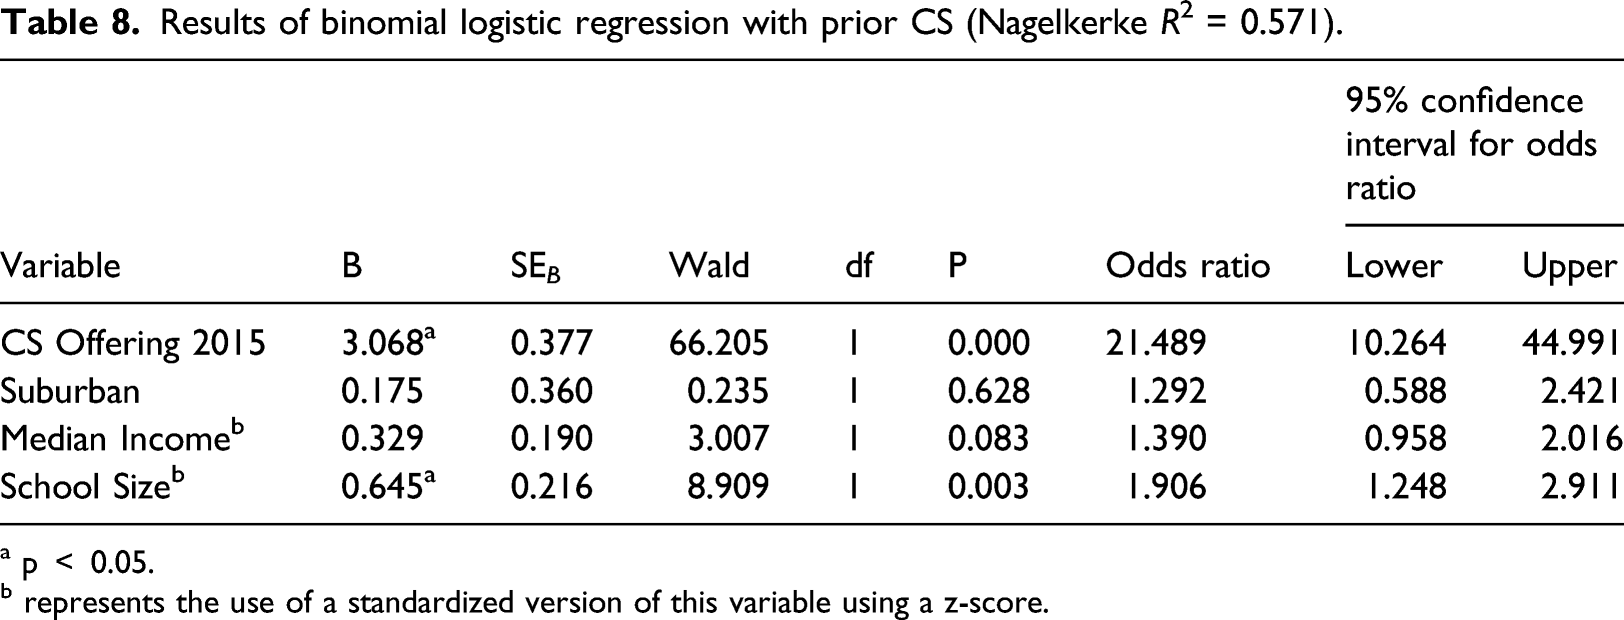
a p
b represents the use of a standardized version of this variable using a z-score.
In the second regression model, school size remained a significant factor in the model, though the estimated effect of school size on the odds of a school offering CS in 2016 was less than the model without prior CS. Median income in the county was no longer a significant factor, and suburban location status remained insignificant. However, not only was the binary prior CS offering variable a significant factor in the model, it also predicted an increase in the odds of offering a CS course. Using the odds ratio, a school, of average size and with the average median income, offering CS in 2015 had a 2048% increase in the odds for offering CS in 2016, compared to a school that did not have CS in 2015. These results indicate that prior CS offerings are significantly related to whether the school continues to offer CS, more so than variables related to capacity (i.e., median income and suburban status). However, this finding should be interpreted in the context of the other variables included in the model, hence the need to qualify the result with average school size and average median income; changes in these variables could result in changes in the probability. 57% of the variance was explained in this model, according to a Nagelkerke R2 value of 0.57. The regression had an area under the ROC curve of 0.88, corresponding to excellent discrimination (Hosmer et al., 2013).
Analysis of factors related to CS enrollment
We used hierarchical multiple regression (HMR) to explore the second research question of factors related to the rate of CS enrollment in a school. In HMR, blocks of variables are added into a regression equation in a fixed, sequential order to control for the effects of the variables on the model (Laerd Statistics, 2015). This allows for investigation into how much each block of variables adds to the prediction of the dependent variable, expressed as an increase in R2. The order is determined by the researcher, not the computer, and is motivated by theory. In this case, the theory that motivated the arrangement of the variables was the CAPE framework (Fletcher and Warner, 2021). We used HMR to understand the capacity, access, and participation factors that are related to CS participation. We drew upon the prior analyses to determine the included factors. The correlation analyses suggested that prior CS mattered, but we also wanted to know how much it mattered compared to median income and school size. The binomial logistic regressions suggested that these variables mattered when predicting if a school taught CS, but we wanted to know their effect on predicting how much of a school’s population is enrolled in CS.
In the HMR analysis, there was no evidence of multicollinearity, as assessed by tolerance values greater than 0.1 and through examination of the correlation coefficients. A visual inspection of a plot of studentized residuals versus unstandardized predicted values showed heteroskedastic residuals. To handle this heteroskedasticity, robust standard errors are provided.
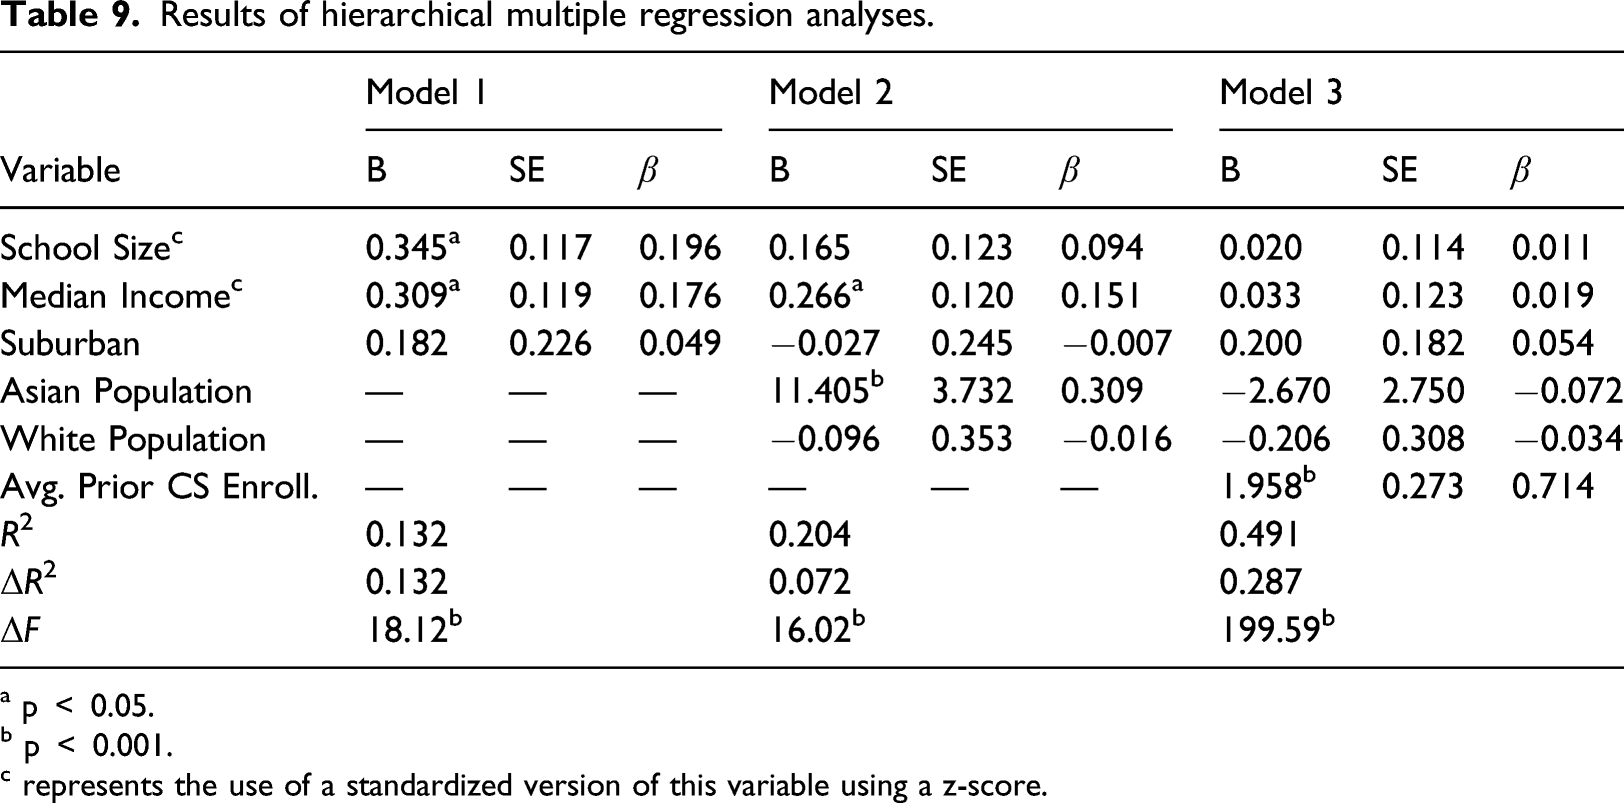
Results of hierarchical multiple regression analyses.
a p
b p
c represents the use of a standardized version of this variable using a z-score.
For Model 2, we added school-level access variables: the percentage of students at the school that identify as Asian and the percentage that identify as white. With this additional block of variables, median income and percentage of Asian students are significant factors in the model, with the percentage of Asian students having a higher β value. Additionally, by examining the change in R2 values, we see the variance explained in the model has increased from 13.2% to 20.4% with the addition of these access variables.
With the last model, we included average prior CS enrollment rates as a measure of prior participation in CS. In Model 3, the only significant factor in the model is this average prior CS enrollment rate variable. The B value for average prior CS indicates that for every one-unit increase in average prior CS (i.e., one percent of a school’s population enrolled in CS averaged over the past 4 years), the CS enrollment rate for 2016 is predicted to increase by nearly 2 units (i.e., an additional 2% of the school will be enrolled in CS in 2016). Furthermore, the R2 value increases to 49.1% in Model 3. This indicates that a model that includes prior participation in CS can explain almost 30% more variance in current CS enrollment rates than a model that only includes capacity and access variables.
Discussion
We approached this work by asking questions of how student access to and participation in CS courses differs across public high schools in the state of Georgia. In this discussion, we explore the implications of the regression analyses and the impact our findings have on equity and the CAPE framework. We also discuss the role of policy and how policy might relate to schools’ capacity to offer CS.
Discussion of factors related to school CS offering
The first research question asked which factors relate to whether high schools offer a CS course. We consider this outcome variable to be related to access, whereas the predictive variables relate to measures of capacity, or what amount of resources and support it takes to get CS in a school. We developed two models with a similar set of variables: the first included the variables of school size, median income, and suburban status, and the second model added a binary variable describing whether or not the school offered CS the year prior.
Our regression analyses revealed that there were differences in which schools offered CS courses. Schools in wealthier areas (higher median income) and larger schools were more likely to offer CS. Access, therefore, is not equitably distributed across the state.
School size was consistently significant in both models, where the odds of a school offering CS were upwards of 2.5 times higher with an increase in one standard deviation of school size. The school size factor suggests that it is somewhat easier to offer CS in a larger school than in a smaller school, but the implications of this needs further exploration. Based on the literature, we posit that a smaller school might not be able to recruit a teacher from the small pool of available and qualified instructors (Google Inc., Gallup Inc., 2015; Warner et al., 2019), or may not be able to sustain teacher or student interest in CS (Yadav et al., 2016). These are factors that could be examined in future studies. Median income was also a significant factor in the model without prior CS consideration, where one standard deviation increase in median income increases the odds of a school having CS by a factor of 1.6. Median income may have been a factor because almost half of all school funding in Georgia comes from local sources. In areas with higher median incomes, more funding is available for schools. Thus, schools in wealthier areas may be able to cover additional costs required to offer CS.
Neither model supported suburban status as a significant factor in whether or not a school offered CS. Although suburban status was correlated with all variables of CS access, it did not significantly predict CS access in our data.
In the second model, prior CS offering (i.e., whether CS was offered in the prior school year) was a significant factor in the model and was associated with a 2048% increase in the odds for offering CS in 2016. It makes intuitive sense that a school that offers CS one year is more likely to continue offering CS in the next year. If the factors that made it possible for the school to offer a CS course one year continue to exist the following year (e.g., if the school finds a teacher or secures the needed technology), the school can likely repeat the CS offering in the following year. Together, these factors create a strong model, explaining 57% of the variance, compared to 34% of the variance in the model that did not include prior CS offering.
Overall, these variables describe some of the differences in schools’ capacity to provide their students with access to a CS course.
Discussion of factors related to CS enrollment
The second research question explored which factors relate to the CS enrollment rate. This question is related to the participation layer of the CAPE framework because it examines which school population demographics (access) and community factors (capacity) predict higher levels of CS enrollment (participation).
In Model 1, which included only capacity-related variables, 13% of the variance was explained by school size, median income, and suburban status. Only school size and median income were significant. This aligns somewhat with our expectations that larger schools in more affluent areas may be more equipped to support CS courses and sustained enrollment. Although prior research suggests that CS course access is more prominent in suburban areas (Code.org, CSTA, and ECEP, 2020; DesJardins and Martin, 2013), we are encouraged by our results that found that suburban status was not a statistically significant factor in the model. This model suggests that the rate of CS enrollment is not necessarily related to the geographic area in which a school is located. That is, schools in suburban areas do not necessarily receive an advantage in CS participation due solely to their locale, and schools in rural or urban areas are not necessarily disadvantaged in CS participation based on their locale.
In Model 2, only one of the access-related variables is significant: the percentage of students at the school who identify as Asian. Additionally, median income (a capacity-related variable) remains significant while the school size, a significant factor in the binary models, does not have statistical significance. This suggests that although school size is a factor in predicting CS access, it may not matter as much as demographic variables when examining CS participation. The coefficients in Model 2 indicate that with an additional 1% of a school identifying as Asian, that school would have 11.4% more of its students enrolled in CS courses. This provides support for the literature that CS courses tend to be in schools with higher rates of Asian students (Camp, 2012; Code.org, CSTA, and ECEP, 2020; Fancsali et al., 2018; Lim and Lewis, 2020). However, our results do not provide support for similar findings for schools with predominately white students (Code.org, CSTA, and ECEP, 2020; Fancsali et al., 2018). The percentage of white students did not correlate with any CS enrollment rate, nor did it significantly factor into any model. Additional study of enrollment and demographic factors may help to further explain these findings.
Model 3, which included the participation-level variable of average prior CS enrollment rates, explained the most variance of the participation-outcome regression models, at 49.1%. This new variable was the only significant factor in Model 3. Thus, prior CS enrollment is the best predictor of CS enrollment in our analysis. There is a predicted increase in CS enrollment in 2016 of 1.96% for every additional percent of a school enrolled in a CS course from 2012 to 2015, on average. This result, coupled with the fact that the mean CS enrollment in 2016 was higher than the mean of average prior CS enrollments in 2012–2015 (see Table 6), is encouraging and suggests that CS participation is increasing over time in schools that teach CS. It is unclear from our analysis why that is, but the national and state efforts described in earlier sections may have contributed. The increase may be due to internal factors at the school related to recruitment or word of mouth encouraging more students to enroll, or it could be due to factors outside of the school, such as extracurricular activities introducing students to CS. Further, in this model, none of the other factors were significant. This suggests that when prior enrollment is considered, capacity and other access factors are outweighed in predicting current CS enrollment.
Implications for the CAPE framework and equity
Our results provide insights into the CAPE framework (Fletcher and Warner, 2021). Logically, the framework is tiered: participation is built on access, which is built on capacity. Students cannot participate in CS if the school does not provide access or loses its capacity to offer CS. Essentially, in order to achieve equitable experiences in CS, equitable participation, access, and capacity are necessary. Our regression models support this tiered relationship between capacity, access, and participation. However, our results have implications for understanding the continued effects of a given level of the framework on the subsequent level.
The best predictor for access was prior access and the best predictor for participation was prior participation. The binomial logistic models that explored whether schools taught CS suggested that prior access was the best predictor for current access. Similarly, the HMR models suggested that prior CS participation was the best predictor for current rates of participation. On face value, this is intuitive: if a school offers CS one year, they are likely to continue to offer CS; if a school has a large percentage of their students enrolled in CS, they likely have other factors that will continue to encourage participation in the future.
Our work implies that once equity is achieved at a given level, the importance of the prior level diminishes. That is, once equitable access is achieved, equitable capacity is no longer a strong predictor of access, and that once equitable participation is achieved, equitable access is no longer a strong predictor of participation. Instead, prior performance at the current level (e.g., access) is a stronger predictor of continued performance at that level. Based on these results, we suggest that future work consider how the CAPE framework may be visualized in such a way that reflects the necessity and effects of each level on the next.
The lack of significance of some factors, such as suburban status or percentage of students identifying as white, can be seen as encouraging when considering equitable opportunities and participation in CS. Because the models suggest that CS enrollment in schools is not significantly affected by, for example, the school being in a suburban area, being located in a suburb is not a necessary precursor for a student to take CS. This by no means implies that the current state of CS in Georgia is equitable; rather, we are optimistic about the ability for it to be equitable.
The effect of policy on factors related to capacity and access
Schools are influenced and supported by the state and national policies at play, particularly with regard to their capacity to offer CS. In Georgia and in the U.S., CS-related policies have gone through a period of tremendous growth and change over the past decade and over the course of the time frame of this analysis. Because of these changes, an analysis of CS education, particularly around capacity, access, and participation factors, is incomplete without a reflection on the policy environment.
State and federal policy directly or indirectly influence the variables under study in this paper. Our capacity variables—median county income, school size, and suburban location—are directly affected by broad state and federal K–12 policies, such as funding for public education. During the 2012–2016 time period, numerous national organizations and initiatives focused on K–12 CS launched and thrived, including Code.org, the ECEP Alliance, and the CSforALL consortium. These national efforts increased the potential capacity of schools by providing curriculum options and coordinated leadership in the CS education policy space, and bringing awareness of computer science education to more schools, teachers, and students.
At a more granular policy level, CS-specific policies in Georgia may not have directly affected our capacity variables. Yet CS-specific policy can mitigate effects of statistically significant factors, like median income or school size, by focusing incentives and resources, such as grant programs, on low-income areas, rural or urban areas, small schools, or schools that have not offered a CS course in the past. In this section, we examine each major CS-specific policy in Georgia between 2012 and 2016 (as seen in Table 2) in order to explore the ways that the evolving policy landscape in the state may have affected the data in our study.
The Georgia Department of Education’s creation of the CTAE pathway system and inclusion of a CS pathway formalized the department’s role in CS education and could have played a role in expanding CS offerings or increasing enrollment. As the department marketed the pathways to schools and supported the development of these pathways with staff time and resources, school capacity for and interest in offering CS may have been influenced. The state-level resources may have mitigated isolation and provided guidance and recruitment materials to existing teachers who are often the only CS teacher in their school. Further study of the implementation of the CS pathway may provide evidence for the ways in which the department’s efforts related to the increase in CS offerings and enrollment.
The creation of the teacher certification in CS served a few purposes: it elevated the subject of CS as a legitimate content area, set professional standards for CS teachers, and incentivized teachers to attend content-focused PD. Each of these also serves to bring awareness to CS as a K–12 subject area and may have increased the likelihood that a school administrator or a teacher decided to offer a course in CS. Similarly, the directed funding for CS teacher professional development provided further incentives for teachers to learn CS and could have helped schools who would not have otherwise offered a course. At the same time, policies and other factors that increase access to CS may also increase participation, given our findings from our HMR analyses. For example, more PD for more teachers may lead to a school offering a more accessible introductory CS course, or guidance counselors attending PD may guide more students to take a course and may add more course sections onto the school schedule.
The state policies related to graduation requirements could have influenced school administrators in choosing to offer CS because it can satisfy a required credit, or it could have an effect on student decisions to enroll in a CS course, thus boosting enrollment. Growing enrollment in CS in a school, as demonstrated by increased mean CS enrollment over time and our finding that each increase in average prior CS enrollment was associated with a 1.96% increase in current CS enrollment, may have been due to a teacher or school counselor recruiting students into the course with the knowledge that the course counted as a required credit.
Our results suggest that the schools that teach CS one year are likely to continue offering it in subsequent years. We are not able to determine, however, what causes this. It may be that the existing policy landscape during 2012–2016 supported schools in sustaining their CS offerings. It could also be the case that other unknown factors enabled the school to teach CS in prior years and continued to play a role in the course offerings in 2016, such as teacher availability or student demand. Or it could be that the largest barrier for schools to overcome is creating the initial offering. If this is the case, we need more robust policy efforts aimed at supporting schools in overcoming the activation energy to offer a CS course for the first time. Many of the policies and initiatives described in this article support schools—including schools in areas with lower median incomes or small schools—in beginning to offer CS. These include providing low-barrier entry points to CS that do not require specialized technology, providing professional development to teachers new to CS, or making a school administrator’s cost–benefit analysis of offering a CS course more enticing by allowing the course to count for high school graduation requirements.
Future work
Our results suggest some directions for future work. Although our models explain up to half the variance in the system, there is a need for additional insight to identify new factors to consider. It is unclear why some schools may not fit into our models; we know that there are schools that offered CS and then stopped the following year. Qualitative research and survey data at the school, classroom, and student level can help to identify idiosyncratic factors that affect why school districts offer CS or why student enrollment is high. For example, schools may have the capacity to offer a CS course, but students might not have equitable access to it, or their experiences in the course may be negative. We also know that the policy landscape and changes over the years of this study affected school capacity to offer CS, but our model was not able to include these contextual factors. Large-scale data sets and models cannot reveal these esoteric variables, so there is a need for qualitative research to complement this work.
The results for racial and geographic factors were somewhat lackluster compared to the other factors and compared to prior literature, but should not be completely discounted. We found the lack of significance of some factors (e.g., suburban status, percentage of school population that identifies as white) encouraging, as this eliminates any notion that only schools with these factors can successfully offer CS courses. Although prior research has explored the differences in school offerings by locale (Code.org, CSTA, and ECEP, 2020; DesJardins and Martin, 2013; Park and Lee, 2016), our results suggest a direction for future research to further explore CS enrollment patterns by locale. Future works should consider race and geography to better understand their role in the CS landscape.
Despite aspects of our findings promoting an optimistic outlook with regards to equity, our results suggested that access to CS courses is not equitably distributed across the state. The most influential factor contributing to the model for CS access was whether a school offered CS the previous year. It is not clear from our study why this is, but future work could explore causality.
We were limited to publicly available data sets that did not include enrollment demographics or teacher data, and only through 2016. Because we were only able to explore overall enrollment, there is a need for studies that explore student-level participation data, including participation by gender, race/ethnicity, disability status, and other factors.
Conclusion
Our findings contribute to the understanding of the CS landscape in Georgia in 2012–2016, but can also be considered with respect to the CS context in other states and countries and in the succeeding years. Measures of capacity are important because they can affect equitable implementation, such as where CS courses are taught and who has access to those courses. Looking at district and school-level factors and enrollment tells us that there are differences in access and participation based on wealth, school size, and race/ethnicity. Yet the variables under examination in this study do not exist in a vacuum. We know that state policy and national efforts to expand K–12 CS opportunities likely contributed to the changes in the state by increasing the state, district, and school capacity. Continued efforts are vital for ensuring equitable access and opportunity for all students to learn CS.
Footnotes
Acknowledgments
Many thanks are given to the thoughtful feedback the reviewers gave on multiple versions of this paper.
Declaration of conflicting interests
The author(s) declared no potential conflicts of interest with respect to the research, authorship, and/or publication of this article.
Funding
The author(s) disclosed receipt of the following financial support for the research, authorship, and/or publication of this article: This study is supported by National Science Foundation (DGE-1650044).