
Abstract
Little is known about the extent to which expansions of K-12 computer science (CS) have been equitable for students of different racial backgrounds and gender identities. Using longitudinal course-level data from all high schools in California between the 2003–2004 and 2018–2019 school years we find that 79% of high school students in California, including majorities of all racial groups, are enrolled in schools that offer CS, up from 45% in 2003. However, while male and female students are equally likely to attend schools that offer CS courses, CS courses represent a much smaller share of course enrollments for female students than for male students. Non-Asian students enroll in relatively few CS courses, and this is particularly true for Black, Hispanic, and Native American students. Race gaps in CS participation are to a substantial degree explicable in terms of access gaps, but gender gaps in CS participation are not. Different groups of students have access to CS teachers with similar observable qualifications, but CS teachers remain predominantly white and male. Consequently, white and male CS students are much more likely than other students to have same-race or same-gender instructors. Our findings and the implications we draw for practice will be of interest to administrators and policymakers who, over and above needing to ensure equitable access to CS courses for students, need to attend carefully to equity-related course participation and staffing considerations.
Educational attainment around the world has increased, including for some groups historically marginalized from educational opportunities (e.g., women; Roser and Ortiz-Ospina, 2017). Accordingly, policymakers and educational advocates have increasingly turned their attention to ensuring that there is equitable access to high-quality educational experiences specifically in subject areas thought to be of particular value to students or to society, such as science, technology, engineering, and math (STEM; e.g., UNESCO, 2017; United Nations, 2017). However, sizeable gaps in STEM educational opportunity remain, for example, along gender lines (e.g., UNESCO, 2017), as do challenges to developing a STEM teaching force that is sufficiently qualified and diverse to promote equity objectives (e.g., UNESCO, 2015).
Moreover, the salience of specific STEM fields evolves, continuously raising new challenges of educational equity. Among the most notable of such recent evolutions is increasing advocacy for computer science (CS) coursework to be available to students in elementary and secondary schools (i.e., schools enrolling students in kindergarten through grade 12, K-12). Calls for greater CS access have diverse motivations, including meeting labor market demand for computer scientists, providing equitable access for students to coursework and lucrative career opportunities, and developing computational skills that may be of value to students even outside of CS. Yet, the extent to which these calls have been successful is not obvious.
We consider this issue in the context of the United States, where a growing number of organizations have missions of providing CS to students in K-12 schools, and an estimated 45% of high school principals report offering CS at their schools (Code.org Advocacy Coalition, 2019). In particular, we use California as an illustrative example because, as we discuss below, it has been in some ways on the leading edge of K-12 CS education. It is also a large and diverse state, and so may provide useful lessons for other jurisdictions concerned about equity as they consider or attempt K-12 CS expansions.
Overall CS course taking trends in the United States are not as well documented at the elementary and secondary levels as they are at the post-secondary level. Consequently, there is limited evidence of the extent to which K-12 CS has expanded, and even less evidence about the extent to which any such expansions have been equitable for students of different races and gender identities. Moreover, even studies that have considered equity in student access to CS coursework have often focused primarily on the most advanced CS courses or have not considered within-school gaps in CS course participation or access to high-quality CS teachers.
We aim in this paper to focus attention on these often-understudied aspects of equity in CS education. We hope to shift attention from school-level measures of CS course availability to student-level measures of CS course participation and access to quality teaching. To that end, we use statewide longitudinal data from California to answer the following research questions: To what extent has secondary CS course taking expanded in California, both overall and for students of different gender identities and ethnic backgrounds? Do students have equitable access to teachers as measured by certification, education, experience, or congruence in terms of race and gender?
We find that 79% of high school students in California, including majorities of students from all administratively-defined racial groups, are enrolled in schools that offer CS, up from 45% in 2003. However, while they are equally likely to attend schools that offer CS courses, CS courses represent a much smaller share of course enrollments for female students than for male students. Non-Asian students enroll in relatively few CS courses, and this is particularly true for Black, Hispanic, and Native American students. All student groups have mostly similar access to high-quality CS teachers, at least in terms of teachers’ observable experience, education, and credential status, but CS teachers remain predominantly White and male. Consequently, White and male CS students are much more likely than other students to have same-race or same-gender instructors, respectively. Our findings and their implications will be of interest to administrators and policymakers who, beyond needing to ensure equitable access to CS courses, need to attend carefully to equity-related course participation and staffing considerations.
Background
Equitable access to secondary computer science courses
There is evidence that access to secondary CS courses is inequitable along race and gender lines. Test taking rates on the College Board’s Advanced Placement Computer Science (AP CS) tests are a common measure of CS access in the US. Advanced Placement exams can often be used to earn students college credit or course placement at colleges and universities, and are typically—though not necessarily—taken after completing a corresponding AP course. Even relative to other AP exams, AP CS exams have shown low rates of participation among women, Black students, Hispanic students, American Indian/Alaska Native students, and Native Hawaiian/Other Pacific Islander students. For example, 55% of all AP exams in 2018 were taken by female-identified students, but female-identified students account for only 28% of AP CS exams in the same year. Black students are approximately 15% of the HS student population in the US (c. 2017), but only 6.3% of all AP exams in 2018 were taken by Black students and 5.6% of AP CS exams were. Approximately 25% of HS students in the US are Hispanic (c. 2017), but only 22.2% of all 2018 AP exams were taken by Hispanic students and only 16.3% of AP CS exams were taken by Hispanic students (Lim and Lewis, 2020). These data do not capture students who opt not to take the AP exams, but who are nevertheless enrolled in an AP CS course or another (usually less advanced) non-AP CS course, but they provide longitudinal information disaggregated by gender, and race.
Evidence on non-AP CS participation equity is scarce; existing work focuses primarily on whether CS courses are offered at students’ schools rather than on the extent to which students enroll in them. In that work, too, inequity in terms of race and gender is apparent. For example, a 2019 report found that 45% of high schools offered CS across the 39 states from which they were able to collect complete public high school data (Code.org Advocacy Coalition, 2019). 1 However, they find that access is unequally distributed by race, ethnicity and income. Only 35% of schools in which 75%–100% of their student population is from a racial or ethnic group underrepresented in CS offer CS. Similarly, in a nationally representative sample of students Wang et al. (2016) report that “lower income students are less likely to report access to CS learning opportunities” (p. 648) and “Black students, regardless of income, are less likely than White or Hispanic students to report opportunities to learn CS at school….Hispanic students are also less likely than White students to report having dedicated CS classes, but after accounting for household income, this effect diminishes.” (p. 648).
The results discussed above point to stark inequities in K-12 CS education, particularly in terms of access. Perhaps due to data limitations, we know considerably less about inequities in CS course participation, particularly outside of the AP academic track. We know even less about equities in students’ experiences in the CS courses they take. As we discuss below, of particular concern is how the staffing challenges associated with CS course expansions have translated into inequitable access to high-quality teachers.
California context for secondary computer science education
California is an interesting context to study equity in CS education, and not only because it is the home of Silicon Valley. California releases detailed course-level data on staffing and student enrollment. Additionally, California is a large and diverse state with a recent history of being at the front of efforts to expand CS education, while also facing a number of challenges to the equitable expansion of educational opportunities in CS. For example, the high school course Exploring CS, which was designed to address the racial inequity documented in the book “Stuck in the Shallow End: Education, Race, and Computing” (Margolis et al., 2008), was launched in Los Angeles in 2008. Based on the data we use here, and describe below, by the fall of 2016 284 high schools in more than 140 districts in California were offering Exploring CS courses with collective enrollments of more than 19,000 students. Similarly, in September of 2018 California adopted CS standards for K-12 students to facilitate—though not to require—the implementation of K-12 CS curriculum (Lambert, 2018). In May of 2019, California adopted the California Computer Science Strategic Implementation Plan (CCSSIP; Lambert, 2019), which articulates strategies to expand access to CS instruction (e.g., integrating CS content into other courses) and preparation for teachers (e.g., adopting a dedicated CS teaching certification). This kind of attention and effort over many years may have created many of the conditions needed for equitable secondary CS opportunities for students, but there is little evidence of this to date and there are reasons to suspect challenges remain. For example, the CCSSIP does not include funding and makes implementation by districts optional.
Potential funding challenges notwithstanding, secondary CS access has expanded dramatically in California in recent years. Figure 1 shows the percentage of California high school students who are enrolled in a school that offers a CS course.
2
The solid line in Figure 1 shows the percentage of students at a school that offers any CS course and the dotted and dashed lines show percentages for students at schools offering CS courses with and without the College Board’s AP designation, respectively. Percentage of California high school students enrolled in schools offering at least one computer science course. Data are not available for the 2009–2010 school year. AP: Advanced Placement.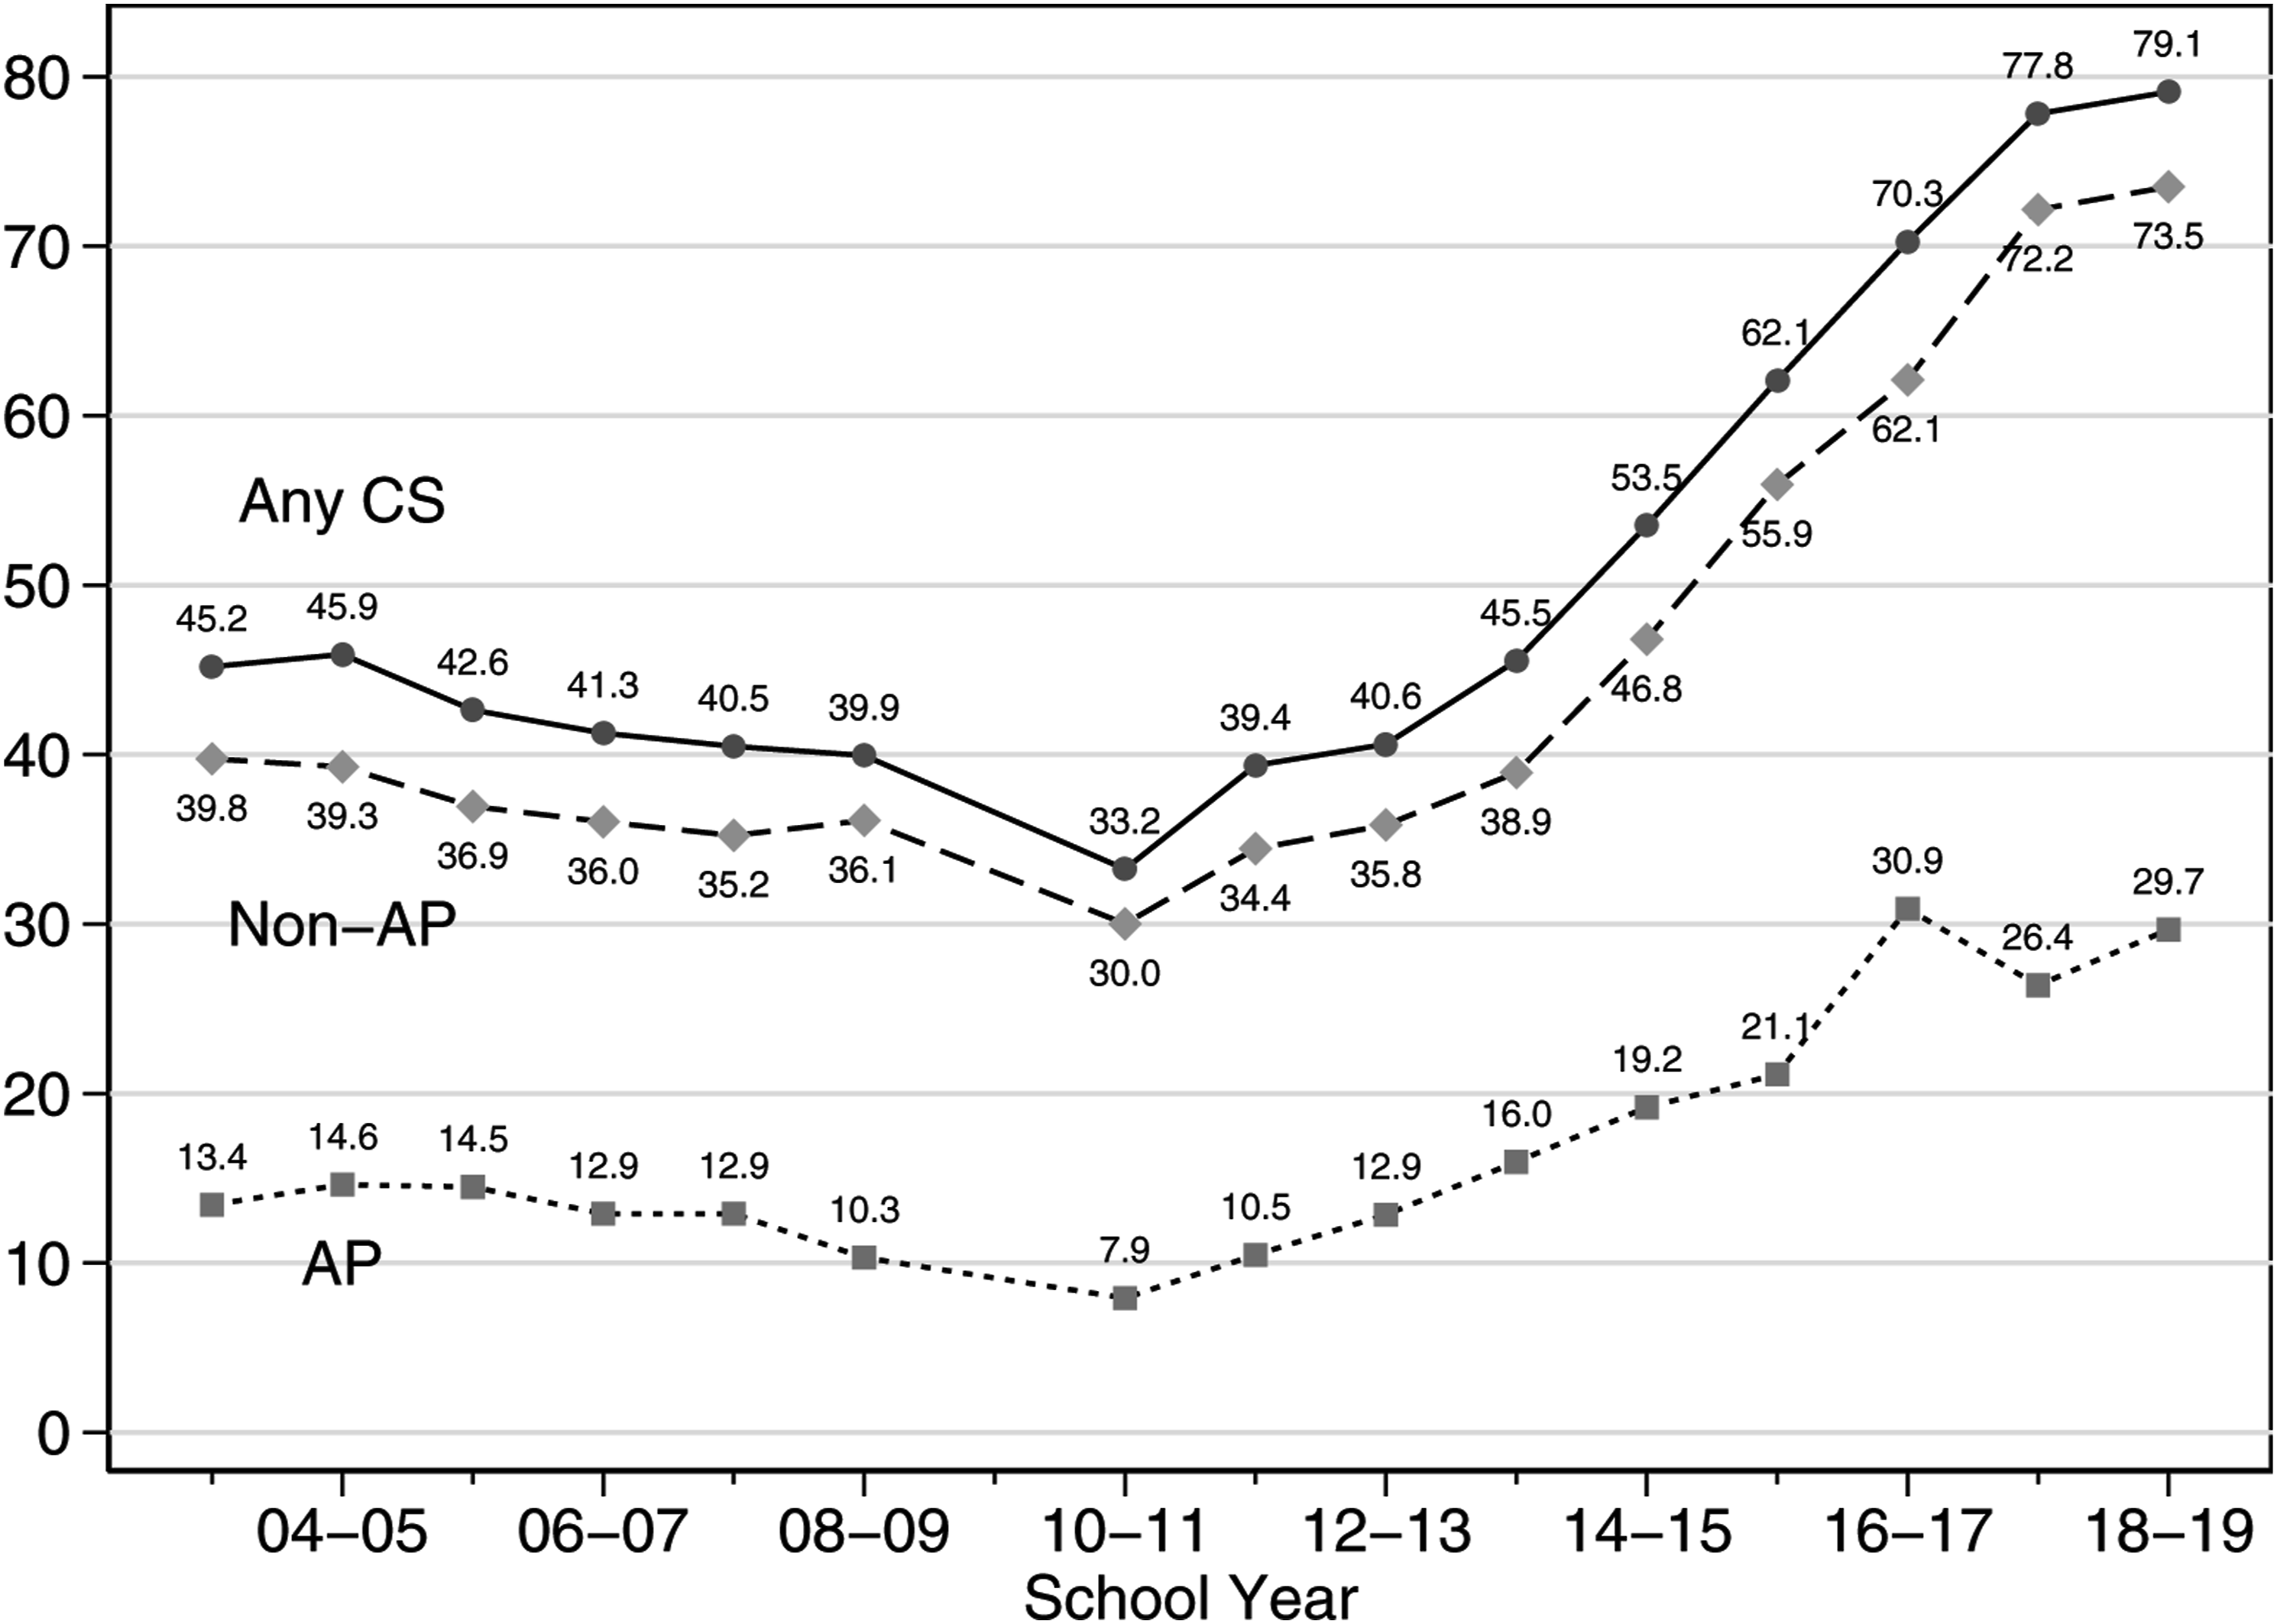
Figure 1 shows that access to any secondary CS—defined here as attending a high school offering any CS course—has expanded considerably in California, more than doubling (to 79.1%) since a nadir in 2010–2011. These expansions in access have often been done with a deliberate eye toward equity, for example, in the expansion of the Exploring Computer Science course and the development of a new AP CS course. As of the 2003–2004 school year there were two AP CS exams: AP CS A, which focuses on Java programming, and AP CS AB, which includes the content from AP CS A with additional topics related to data structures. The AP CS A exam was last offered in 2009 after a period of decreased participation (CSTA, 2013; Lim and Lewis, 2020). Beginning in 2017 a new, potentially more accessible AP CS course was offered: “Computer Science Principles”, which focuses on CS topics beyond programming and uses pseudocode on the exam rather than requiring students to learn a particular programming language (Howard and Havard, 2019). However, it remains unclear whether simply increasing the availability of CS courses has been sufficient to increase equity in student participation.
Equitable access to teachers of computer science
The rapid expansion in CS course availability entails additional challenges for schools in terms of staffing (Bruno and Lewis, forthcoming). In California, there are no programs for pre-service teacher preparation in CS specifically, and secondary teachers in related subjects (e.g., math and science) are often in short supply (Darling-Hammond et al., 2018; Goldhaber et al., 2018b). Perhaps relatedly, California has relatively flexible CS teacher credentialing requirements: “Secondary teachers with single-subject credentials in Mathematics, Business, or Industrial and Technology Education (ITE) are currently authorized to teach CS courses that are coded as a core academic course. When a CS course is coded as Career Technical Education (CTE), then those with a Designated Subject CTE Teaching Credential in Information and Communication Technology are authorized to teach the course.” (p. 15, California Department of Education Executive Office, 2019).
The prospect of CS teacher shortages poses challenges for secondary CS implementation 3 and a 2013 report by the CSTA drew particular attention to the potential of California’s flexible credentialing system to result in CS teachers who possess little CS content knowledge (CSTA, 2013). This raises additional questions about the extent to which students from different backgrounds have access to high-quality CS teachers.
The available evidence, while limited, suggests that concerns about the supply of CS teachers are well-founded. A 2013 report from interviews with teachers (N = 19) and administrators (N = 8) described scarcity of CS teachers as a primary challenge (Century et al., 2013). Similarly, Wang et al. (2016) report from a survey of principals and superintendents that 42% of principals and 73% of superintendents agreed with the statement “There are no teachers available at my school/in my district with the necessary skills to teach CS.” These findings all point to the possibility that many schools are likely to face shortages of highly qualified teachers to teach CS, limiting what CS courses they can offer. It may also mean that the CS courses they do offer are staffed by teachers with weak qualifications.
However, the existing work on this question, including the studies discussed here, rely on survey data; the actual qualifications of CS teachers are not well understood. Moreover, the statewide teacher supply problems discussed above are often particularly acute in communities of color (Darling-Hammond et al., 2018); this suggests that there may be inequities not only in terms of CS course access in high schools, but also in terms of access to well-qualified teachers.
A related concern is that, over and above the qualifications or credentials of their teachers, there is now a substantial body of evidence indicating that when students have teachers of the same race or gender, they enjoy benefits in terms of achievement (Egalite et al., 2015), attainment (Gershenson et al., 2018), attendance (Holt and Gershenson, 2019), disciplinary outcomes (Holt and Gershenson, 2019; Lindsay and Hart, 2017), and attitudes (Egalite and Kisida, 2018). Although these studies do not consider CS classrooms specifically, similar findings appear to generalize at least to STEM education, and appear to indicate if anything that this kind of demographic congruence may be particularly beneficial for students from groups historically underrepresented in STEM fields (Bottia et al., 2015; Carrell et al., 2010; Lim and Meer, 2020). The short supply of teachers in communities of color and the underrepresentation of women and people of color in post-secondary CS (BPCnet, 2020) seem likely to translate into female students and students of color having inequitable access to demographically congruent CS teachers even when they have access to CS courses.
Data
To answer our aforementioned research questions, we use data made public by the California Department of Education (CDE) and spanning the school years from 2003–2004 through 2018–2019. We restrict our analyses to schools classified by the state as traditional schools (which includes most charter schools), alternative schools of choice (e.g., magnet schools or schools blending high school and college coursework), and so-called “state special schools” overseen by the state and serving students who are deaf or blind. Because the course data released by the CDE provide little information on course content at lower grade levels, we additionally only include schools in our sample if they are classified by the CDE as high schools or K-12 schools, or if they are classified as offering instruction at the high-school level.
Course data
Courses classified as computer science (CS).
Note: The two “CTE AP” courses above—course codes 4640 and 4641—were used in the 2016-2017 school year. The CDE did not respond to requests for clarification on the difference between those courses and the analogous non-CTE courses, which have very similar descriptions in other CDE documentation. We do not include the “CTE AP” courses as AP courses because they are not officially designated as such by the CDE. AP: Advanced Placement; CDE: California Department of Education; CTE: Career Technical Education; CE: Computer Education; ICT: Information and Communication Technologies; MPD: Manufacturing and Product Development.
Ideally, we would be able to observe course taking behavior at the student-level rather than enrollment data aggregated to the course level. For example, because we cannot distinguish individual students, we are unable to identify the number of unique pupils taking CS courses or the number of CS courses taken by individual students. However, having data on all courses offered in a school allows us to measure CS access, that is, the presence of any CS course in a school. Additionally, the aggregated course data provided by the CDE include the number of male and female students enrolled and, beginning in 2012–2013, enrollment by student race. This allows us to measure CS participation in a given school in a given year as the percentage of all course enrollments—by any students in all courses—that are in CS courses, and to measure participation separately for students for different genders or races. 5
Staff data
Summary statistics of schools’ student demographics and CS course enrollment.
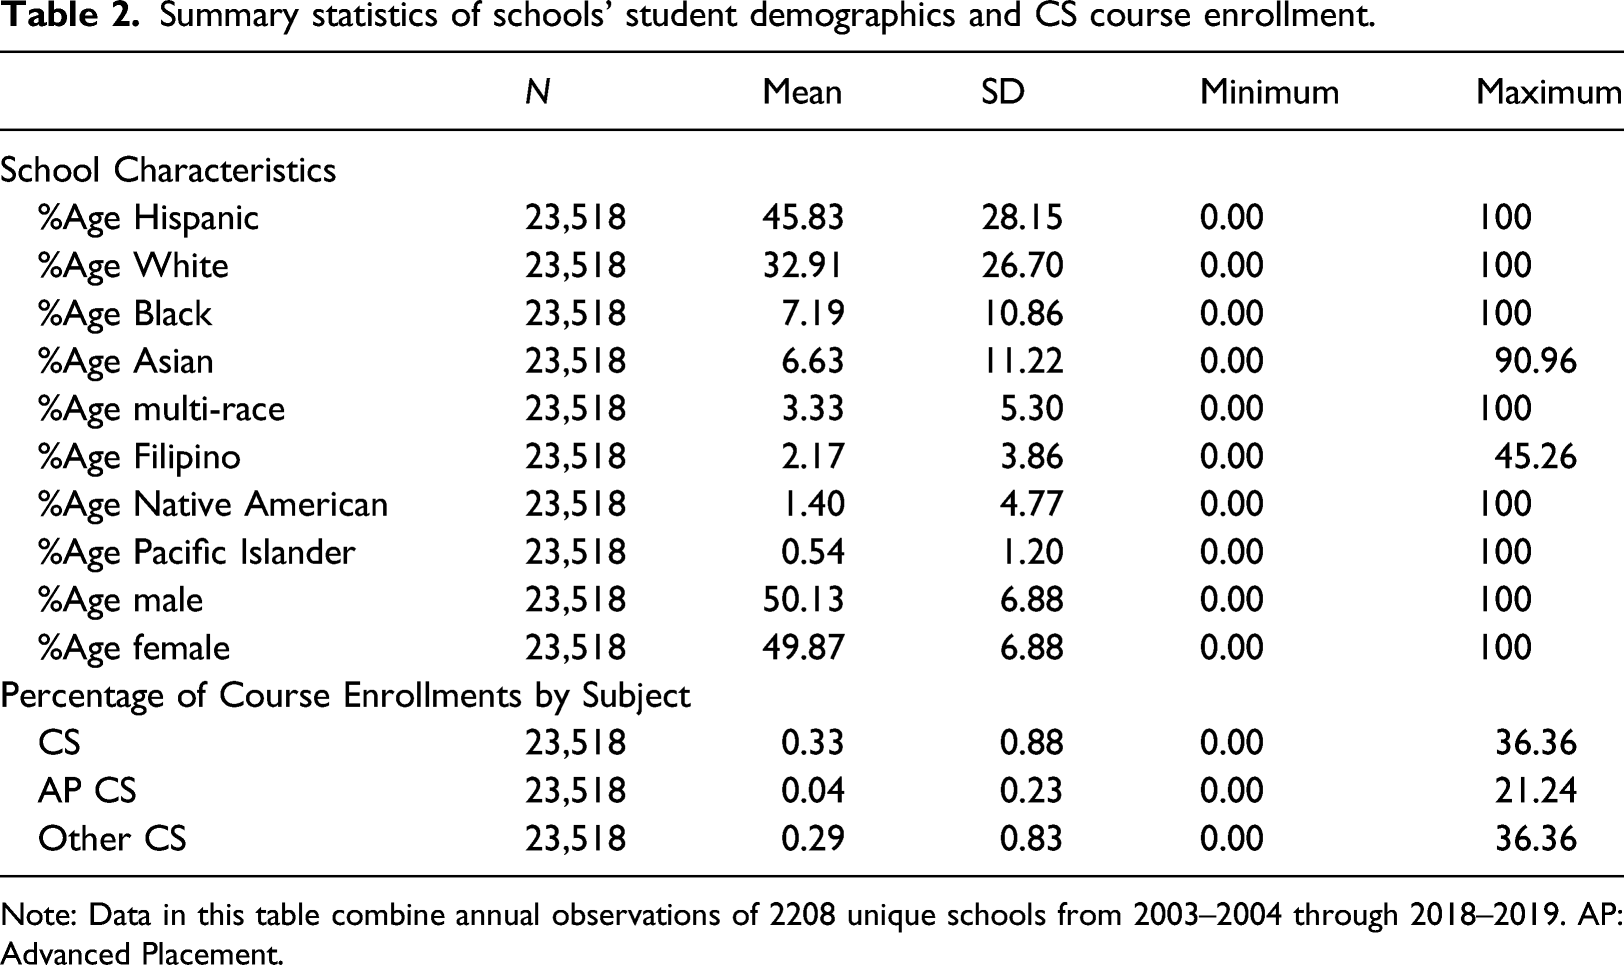
Note: Data in this table combine annual observations of 2208 unique schools from 2003–2004 through 2018–2019. AP: Advanced Placement.
Empirical strategy
We rely on basic descriptive methods to answer our research questions, documenting trends in CS enrollment and CS teacher characteristics overall and for different groups of students.
Results
To what extent has secondary CS course taking expanded in California, both overall and for students of different gender identities and ethnic backgrounds?
As we show above (Figure 1), the share of California’s high school students attending schools that offer CS coursework was substantially larger in 2018–2019 (79%) than in 2003–2004 (45%). Unsurprisingly, this growth in access to CS has been accompanied by substantial growth in CS participation. This can be seen in Figure 2, which shows the percentage of all high school course enrollments in California that were in CS courses. In 2018–2019, CS courses accounted for more than 0.8% of all high school enrollments reported by the CDE, more than tripling their 2003–2004 enrollment share. This growth was proportionally similar for both AP CS courses and non-AP CS courses, though only the latter have continued to expand in the most recent years. Percentage of high school course enrollments that are in computer science. Data are not available for the 2009–2010 school year. AP: Advanced Placement.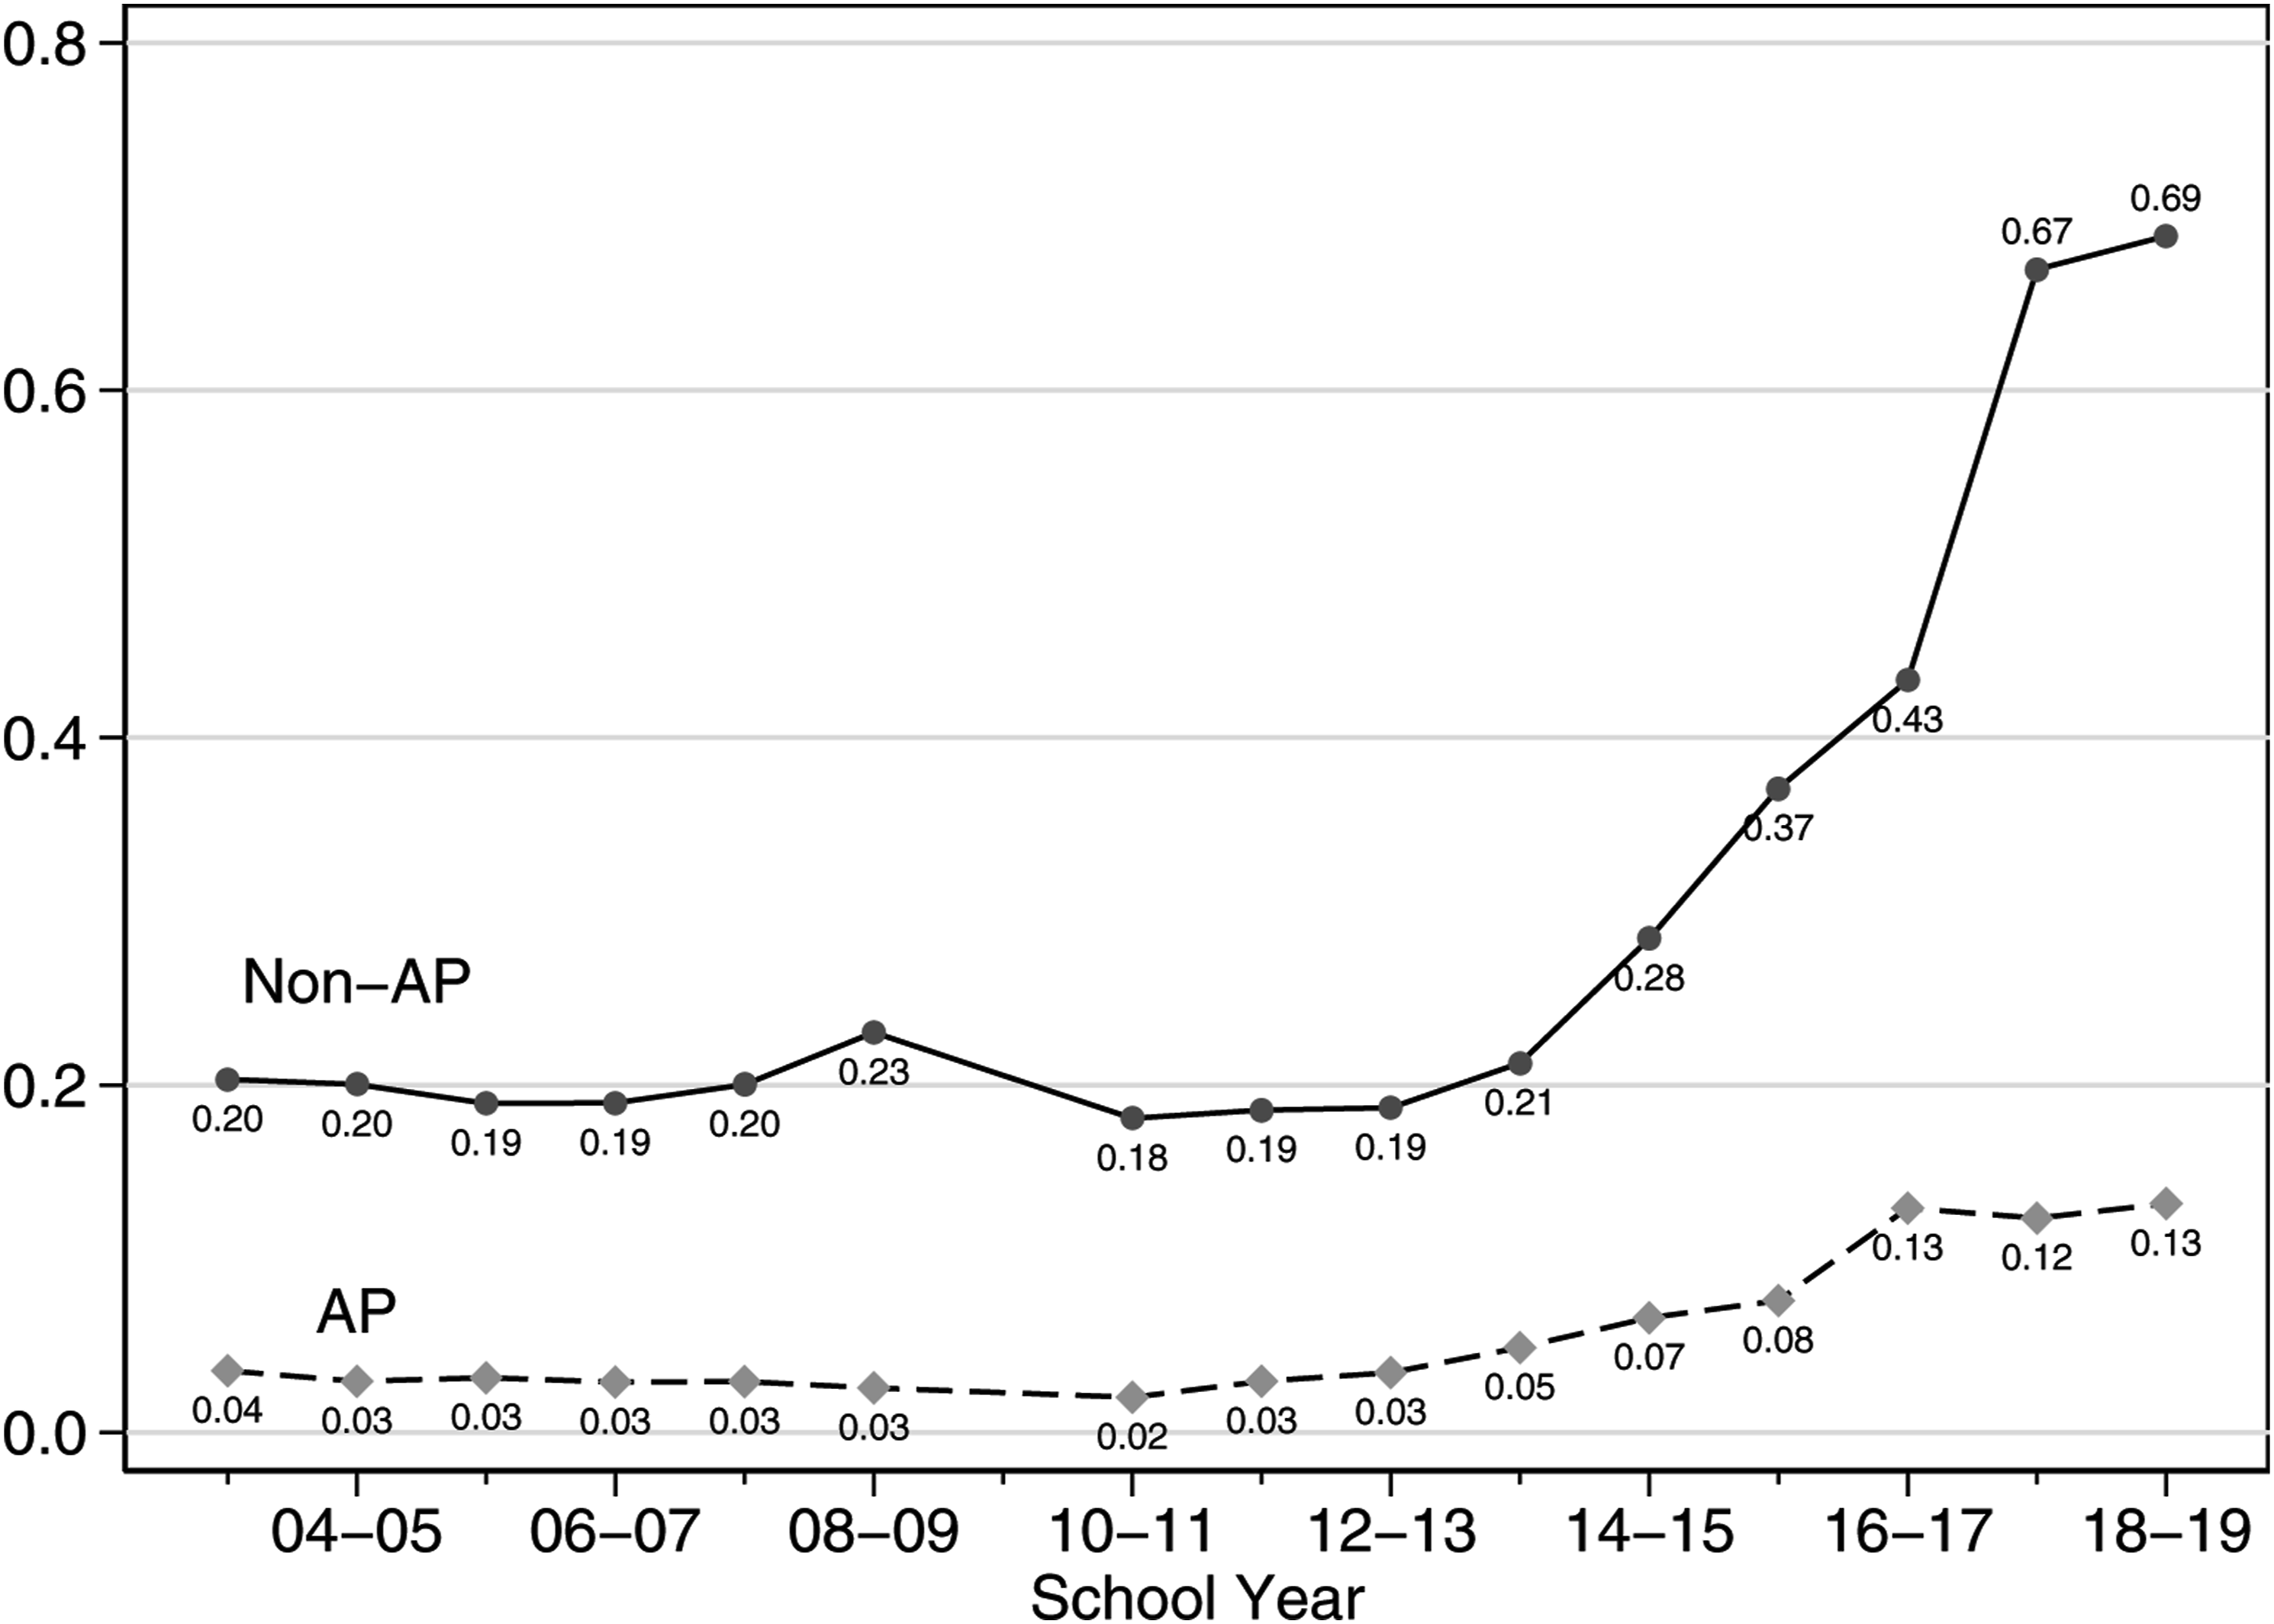
Figure 3 shows that CS enrollment growth has occurred disproportionately among male students for both AP and non-AP CS courses. As a result, gender gaps in CS course taking have increased substantially. In 2003–2004, AP CS courses accounted for 0.06% of enrollments for male students, compared to slightly over 0.01% for female students. Female AP CS course taking subsequently expanded rapidly in proportional terms: to 0.08% in 2018–2019, a sixfold increase. However, over the same period the AP CS enrollment share for male students roughly tripled from a much higher starting point, to 0.18%. As a result, the gap between male and female students in the percentage of course enrollments that are in AP CS has more than doubled, from 0.04% in 2003–2004 to 0.09% in 2018–2019. The pattern is qualitatively similar for non-AP CS course taking, where the gap has increased from 0.14% to 0.54%. These gaps appear to be the result of different student course taking patterns within schools; male and female high school students are equally likely to attend schools in which CS courses are offered (not shown). Thus, simply comparing CS access for male and female high school students could easily give a misleading impression of the equity with which secondary CS has expanded. Percentage of high school course enrollments that are in computer science by gender. Data are not available for the 2009–2010 school year.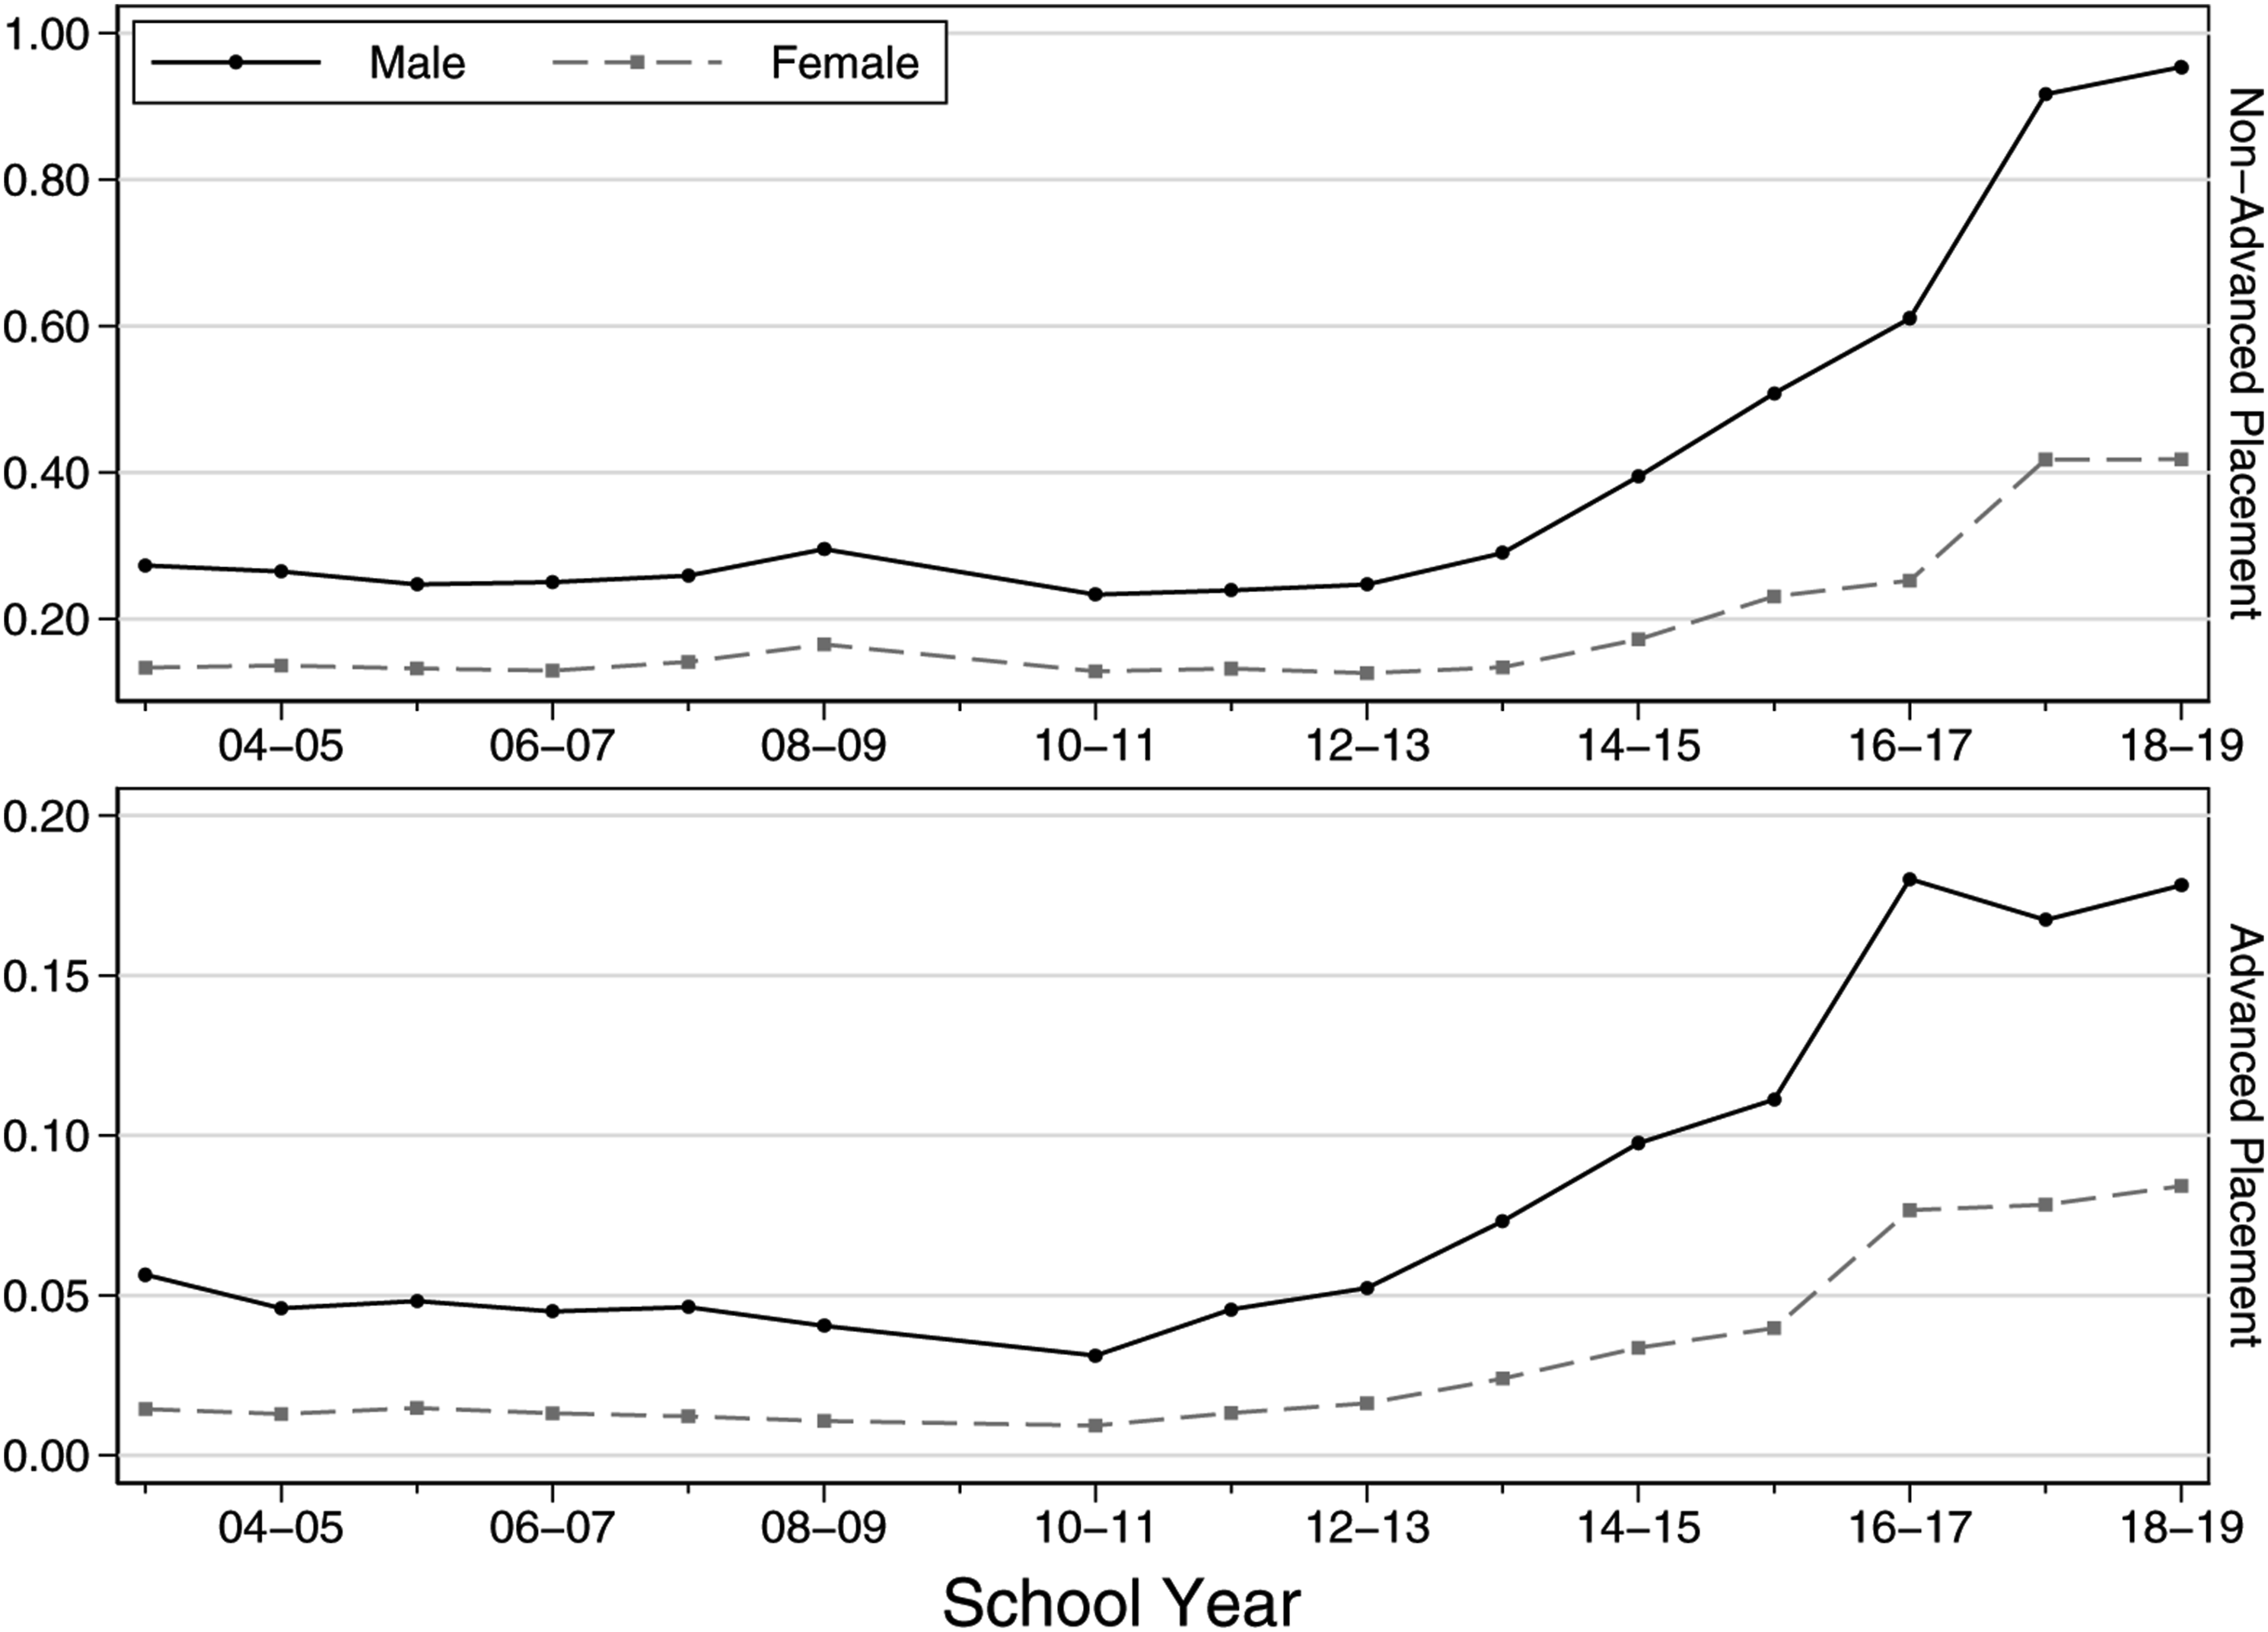
Figure 4 shows similar patterns of growing CS enrollment gaps by race since 2012–2013, when the CDE began reporting enrollment by race. In that year, CS enrollment rates were higher for Asian students than for other students, with non-AP CS courses accounting for 0.26% of Asian student enrollments and AP CS courses accounting for another 0.18%. For all other racial groups, those figures ranged from 0.13–0.19% (for non-AP CS) and 0.01–0.04% (for AP CS). Percentage of high school course enrollments that are in computer science by race. PI: Pacific Islander.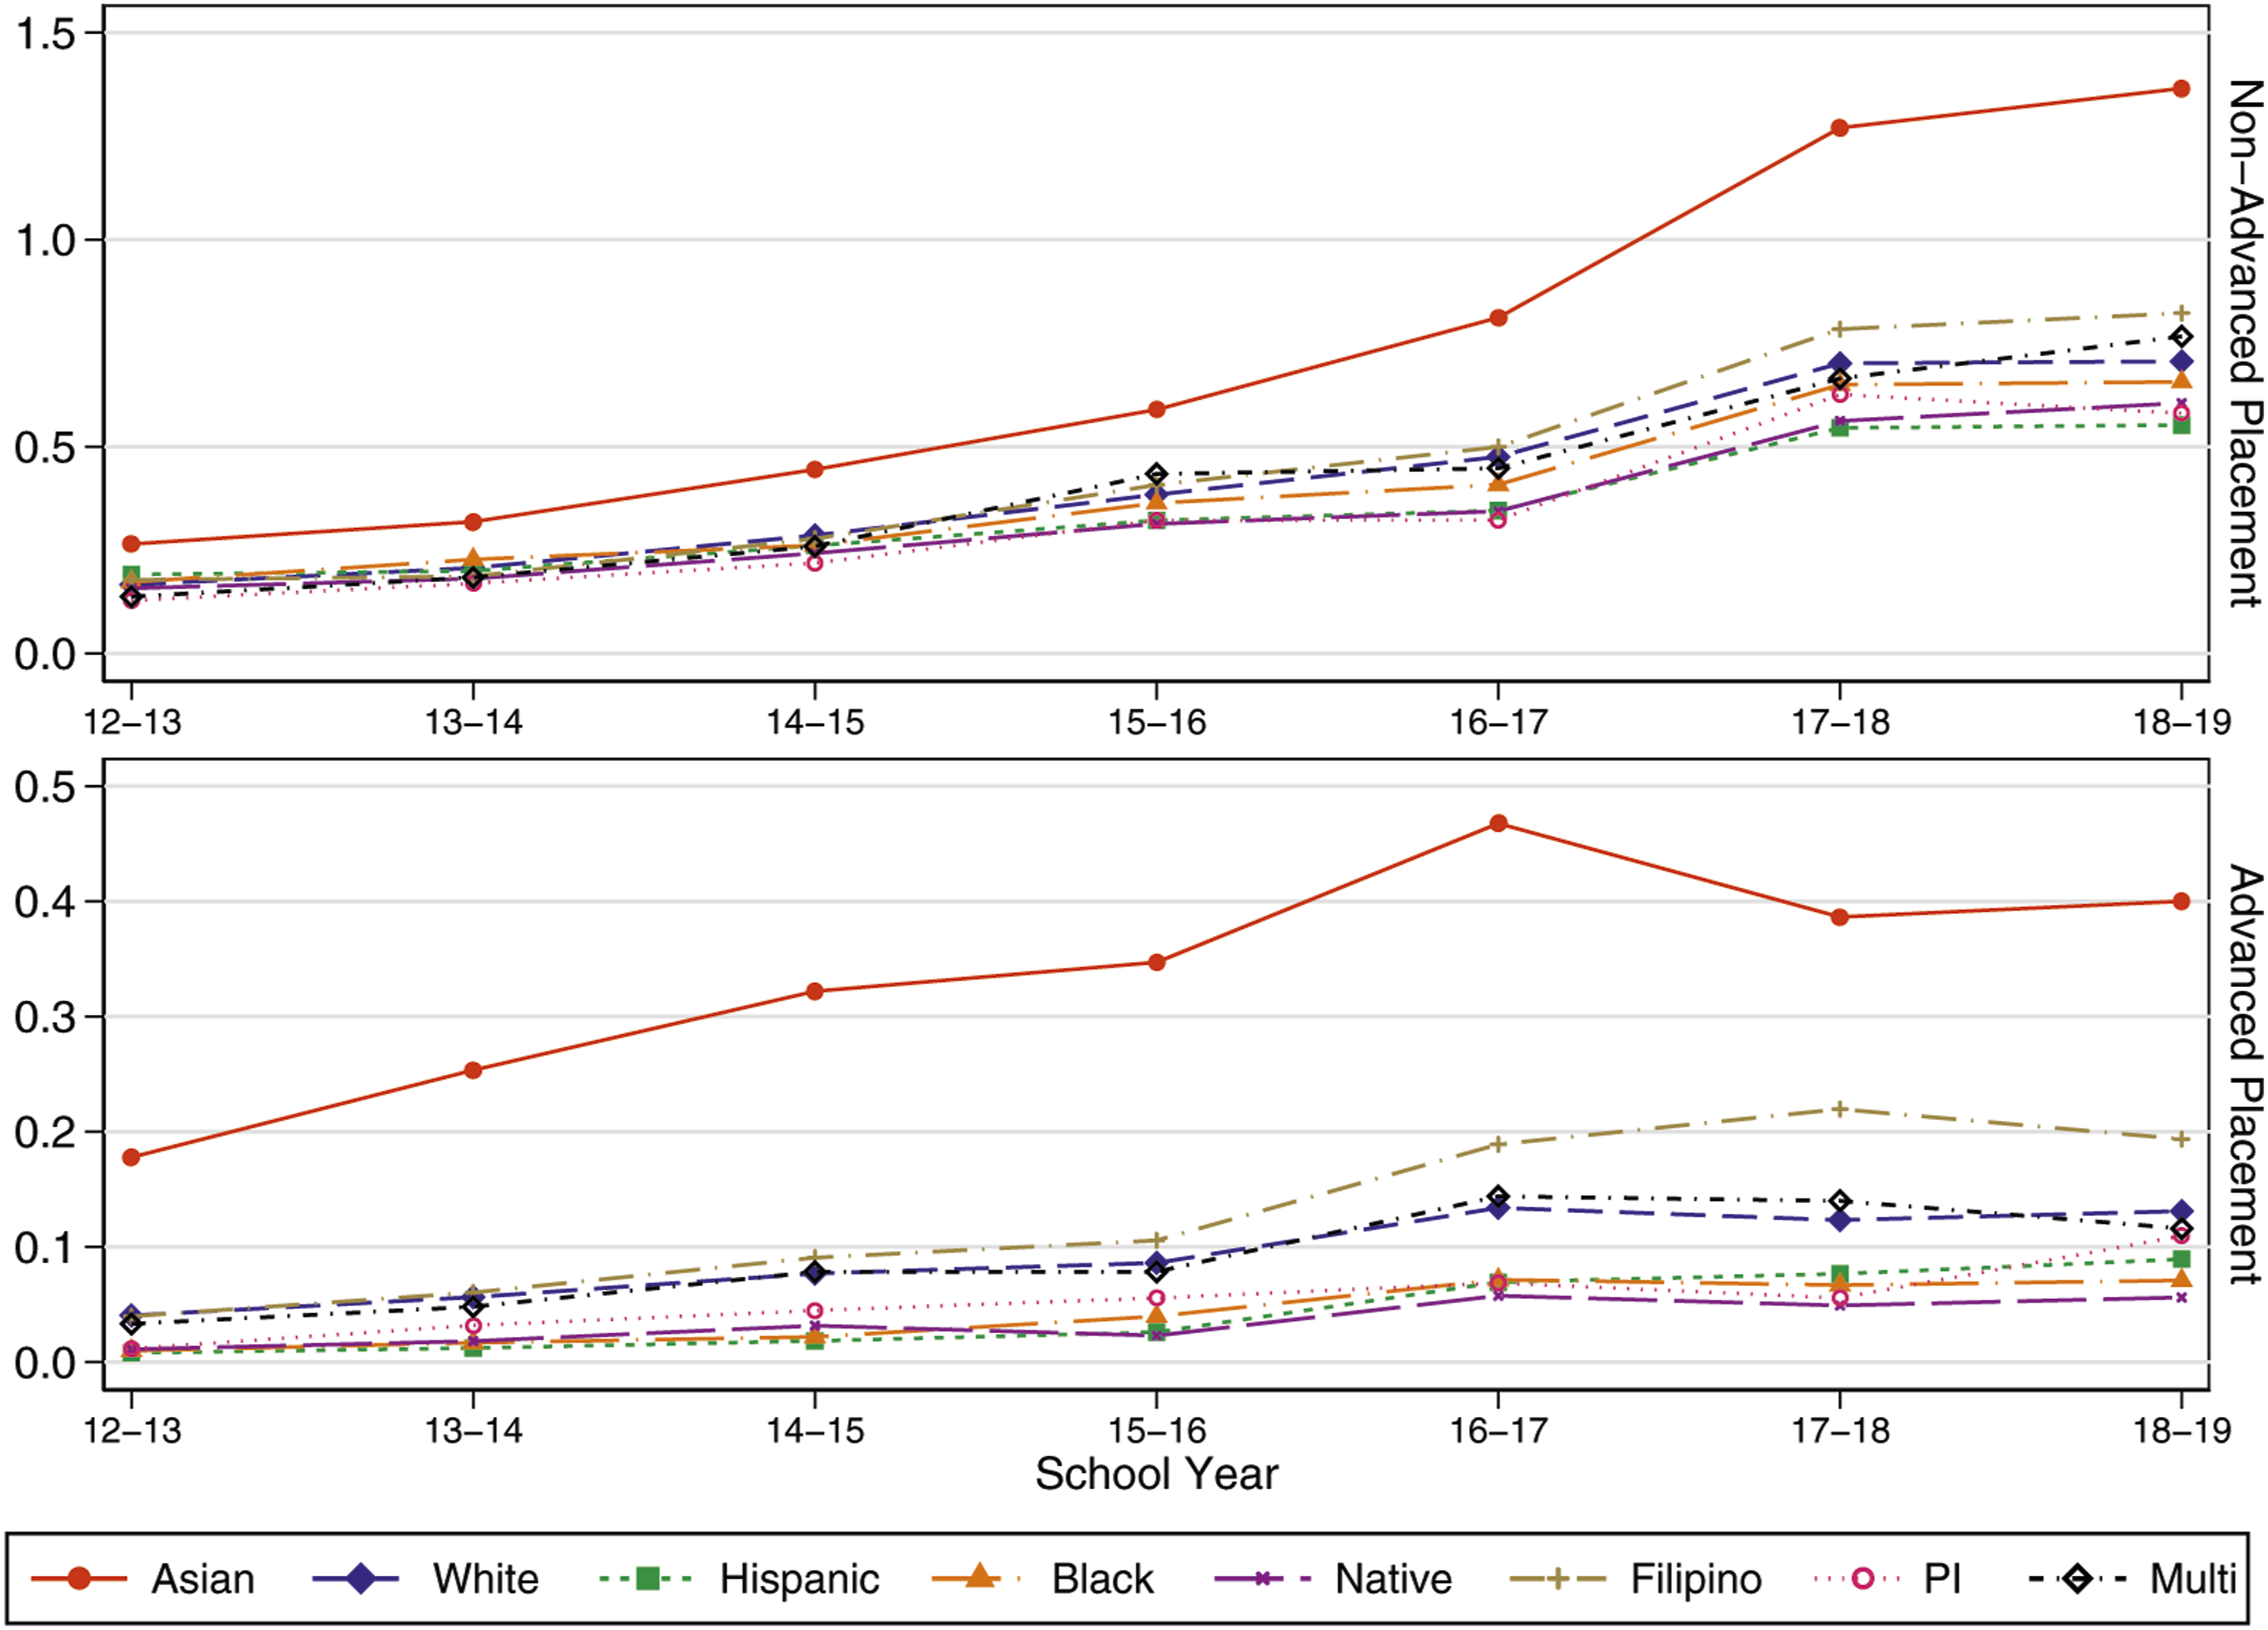
As was the case for gender groups, all racial groups saw participation increases in subsequent years in both AP and non-AP CS courses, but gaps between groups increased substantially. The greatest absolute growth was for the group that already had the highest participation rate: by 2018–2019, non-AP CS courses accounted for 1.4% of Asian students’ high school course enrollments, and AP CS courses accounted for another 0.4%. These represented increases of 1.10 and 0.22 percentage points, respectively. For the racial group with the next-largest participation increases—Filipino students—those figures were at least 30% smaller: 0.64 and 0.15 percentage points.
Increases for other student groups were smaller still. For example, by 2018–2019, all CS courses accounted for only 0.64% of Hispanic students’ course enrollments, up from 0.20% in 2012–2013 but still nearly two-thirds less than the figure for Asian students. Other groups’ enrollment rates barely increased at all. For example, in 2018–2019 AP CS courses accounted for less than 0.06% of Native American students’ course enrollments, up only slightly (in absolute terms) from their 2012–2013 levels (0.01%). Indeed, in 2018–2019, only Filipino students had AP CS enrollment rates as high as those seen for Asian students in 2012–2013.
Unlike the case of gender gaps, however, racial gaps in CS participation appear to be driven at least in part by access gaps between schools. As shown in Figure 5, Asian students are more likely than other students to attend high schools that offer CS courses, and this is true for both AP and non-AP CS courses. In some cases, these gaps are substantial. For example, while 39% of Asian students attended high schools offering AP CS courses in 2018–2019, the same was true for only 18% of Native American students. Similarly, 86% of Asian students attended schools offering non-AP CS courses, compared to only 70% of Black students, 69% of Hispanic students, and 64% of Native American students. These gaps have expanded somewhat over time even as the availability of CS has grown for all racial groups. CS access gaps may therefore explain not only enrollment gaps, but the growth in these gaps.
6
This also highlights that the mechanisms driving racial CS equity gaps are likely to be different in practice than those driving gender gaps, and that conflating the two is unlikely to be helpful from a policy perspective. Percentage of California high school students enrolled in schools offering computer science courses, by race. PI: Pacific Islander.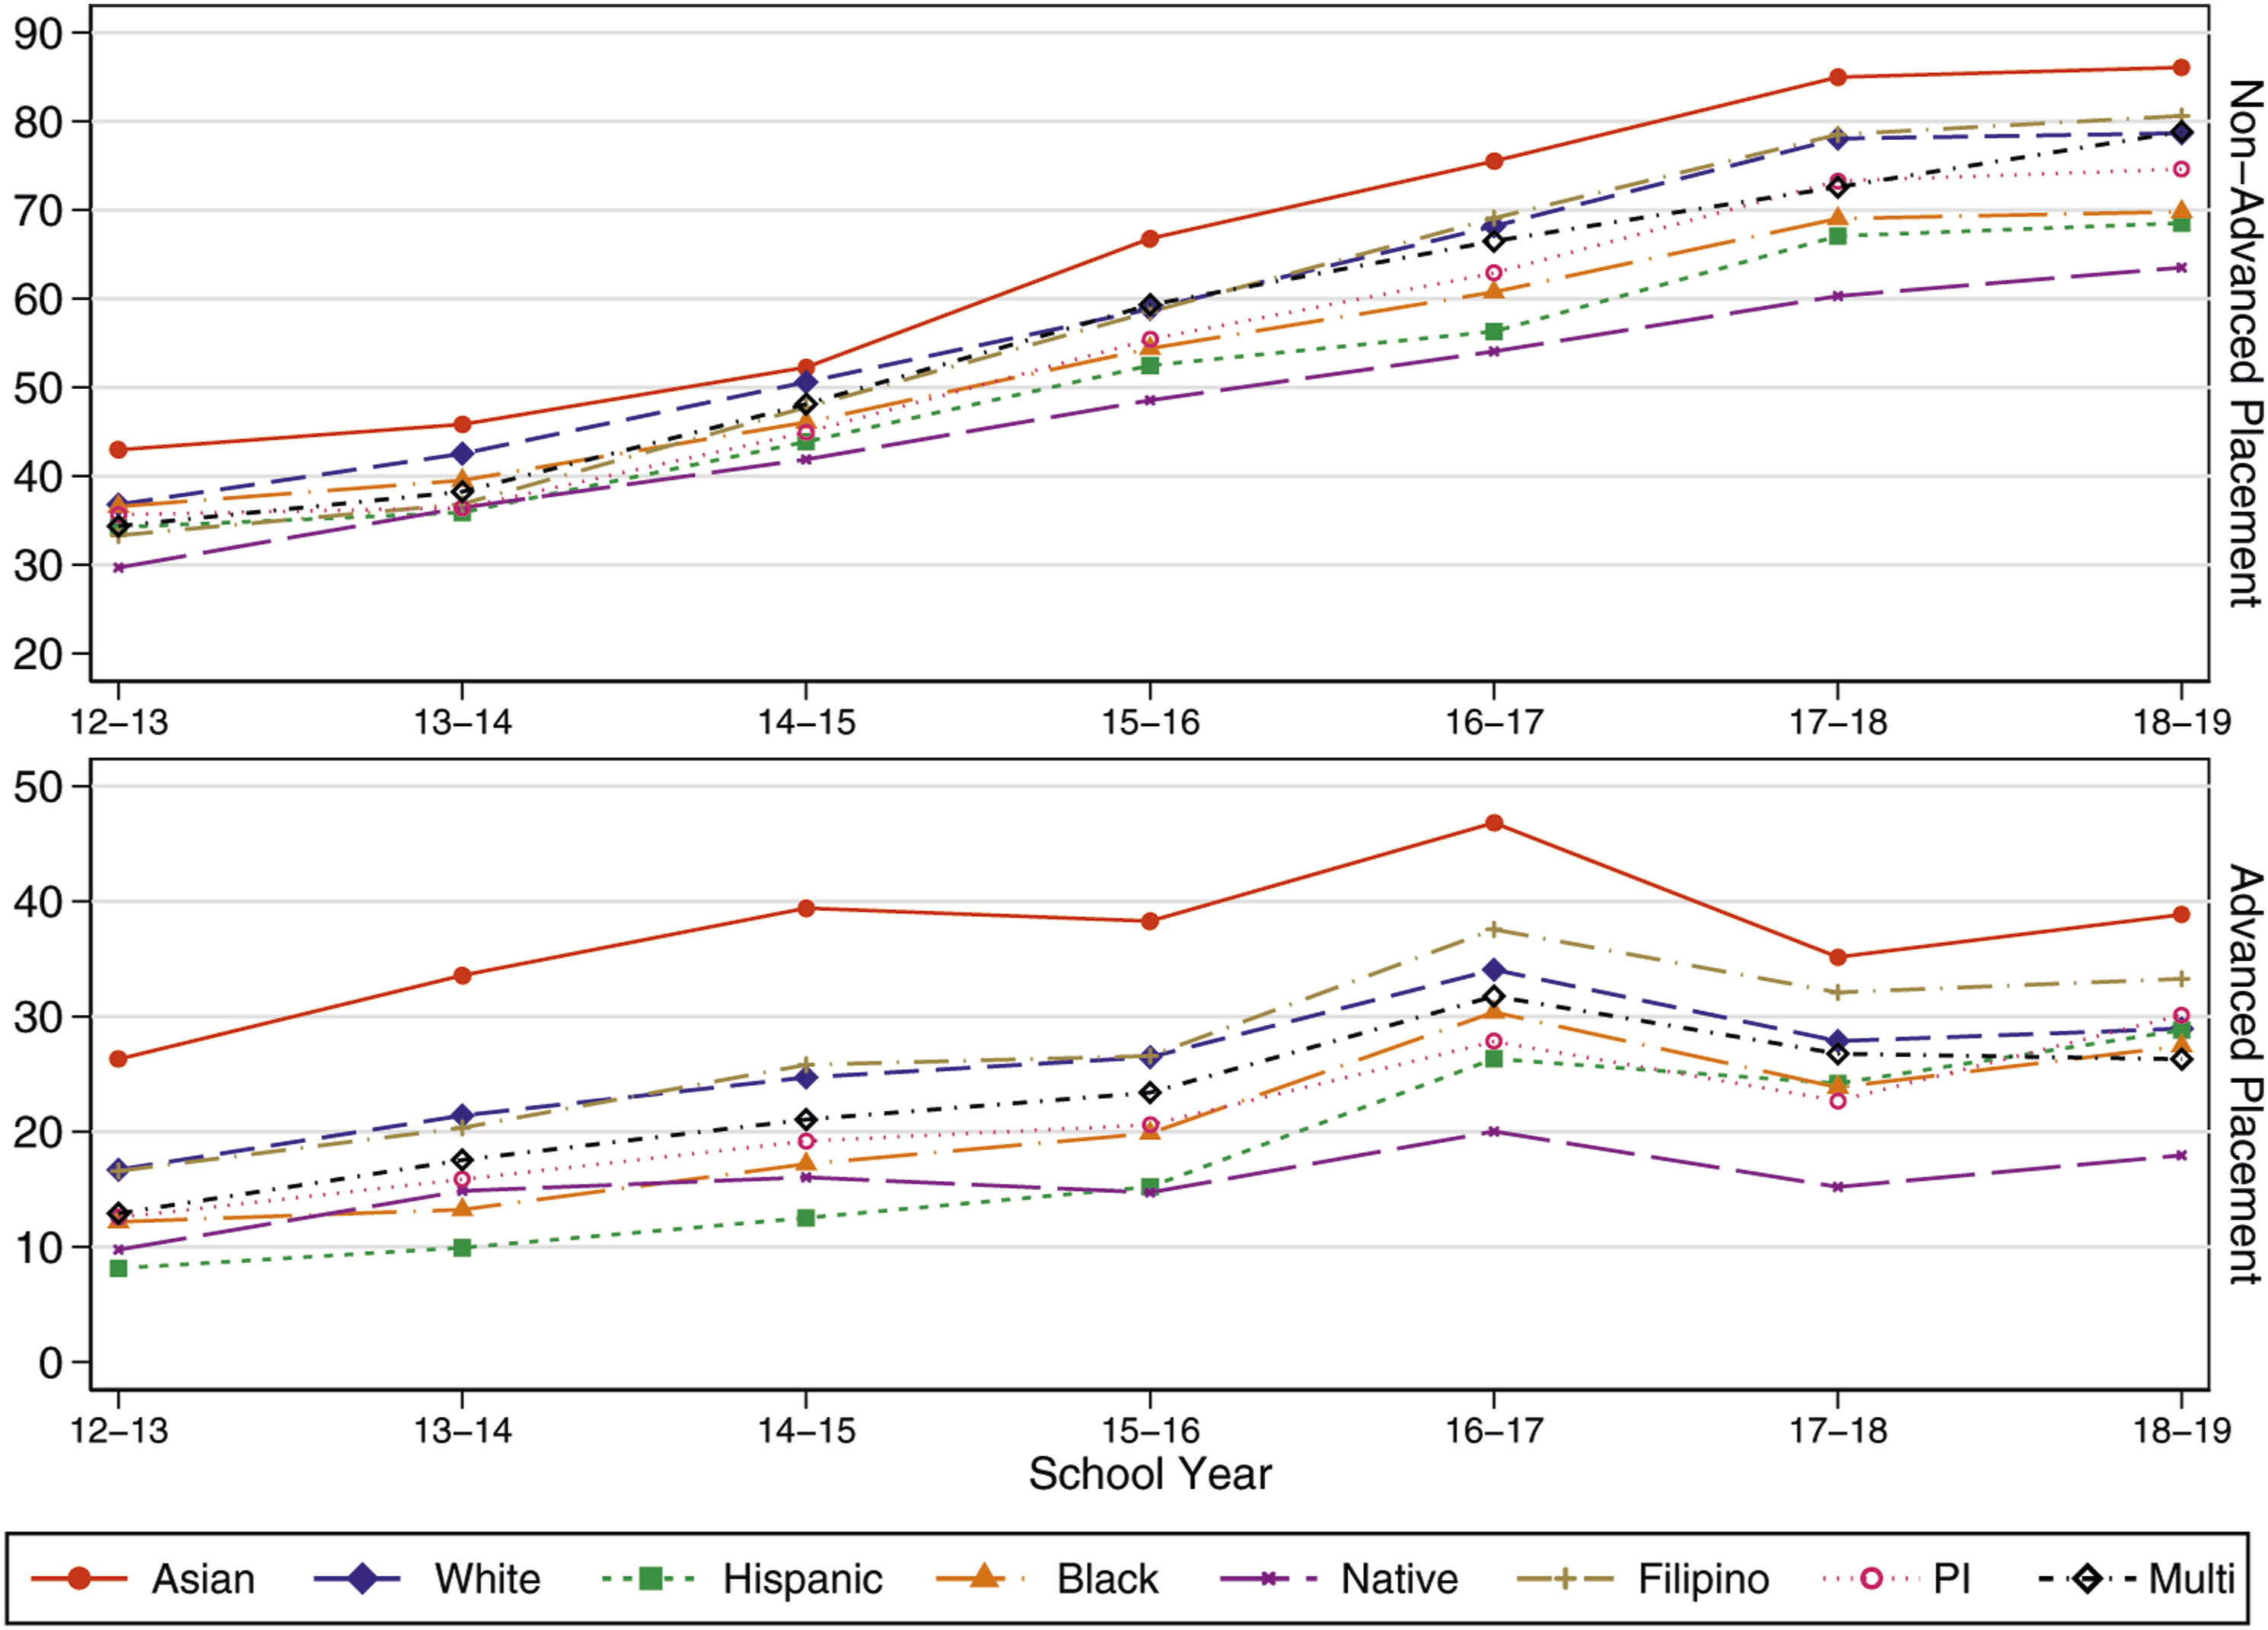
Do students have equitable access to teachers as measured by certifications, education, experience, or congruence in terms of race and gender?
As shown in Figure 6, consistent with previous work finding teacher quality gaps between students from different racial groups (Goldhaber et al., 2018a), students of different races do tend to have teachers with different qualifications in their CS courses. However, these differences are generally small, at least in terms of teachers’ observable qualifications. For example, in 2018–2019 Asian students tended to have the most highly qualified CS teachers, with their teachers having the highest credentialing and master’s degree attainment rates of any racial group, and above-average experience levels. However, for no group of students did less than 97.2% of their CS teachers have a full credential. And in many cases, differences in teacher qualifications between groups of students are mixed. For example, the CS teachers of Native American students had relatively low rates of master’s degree attainment—44.4% vs 53.8% statewide—but they had roughly average credentialing rates and were slightly more experienced on average. Average computer science teacher qualifications by student race (enrollment-weighted) in 2018–2019. Horizontal lines and numbers in brackets indicate statewide means. PI: Pacific Islander.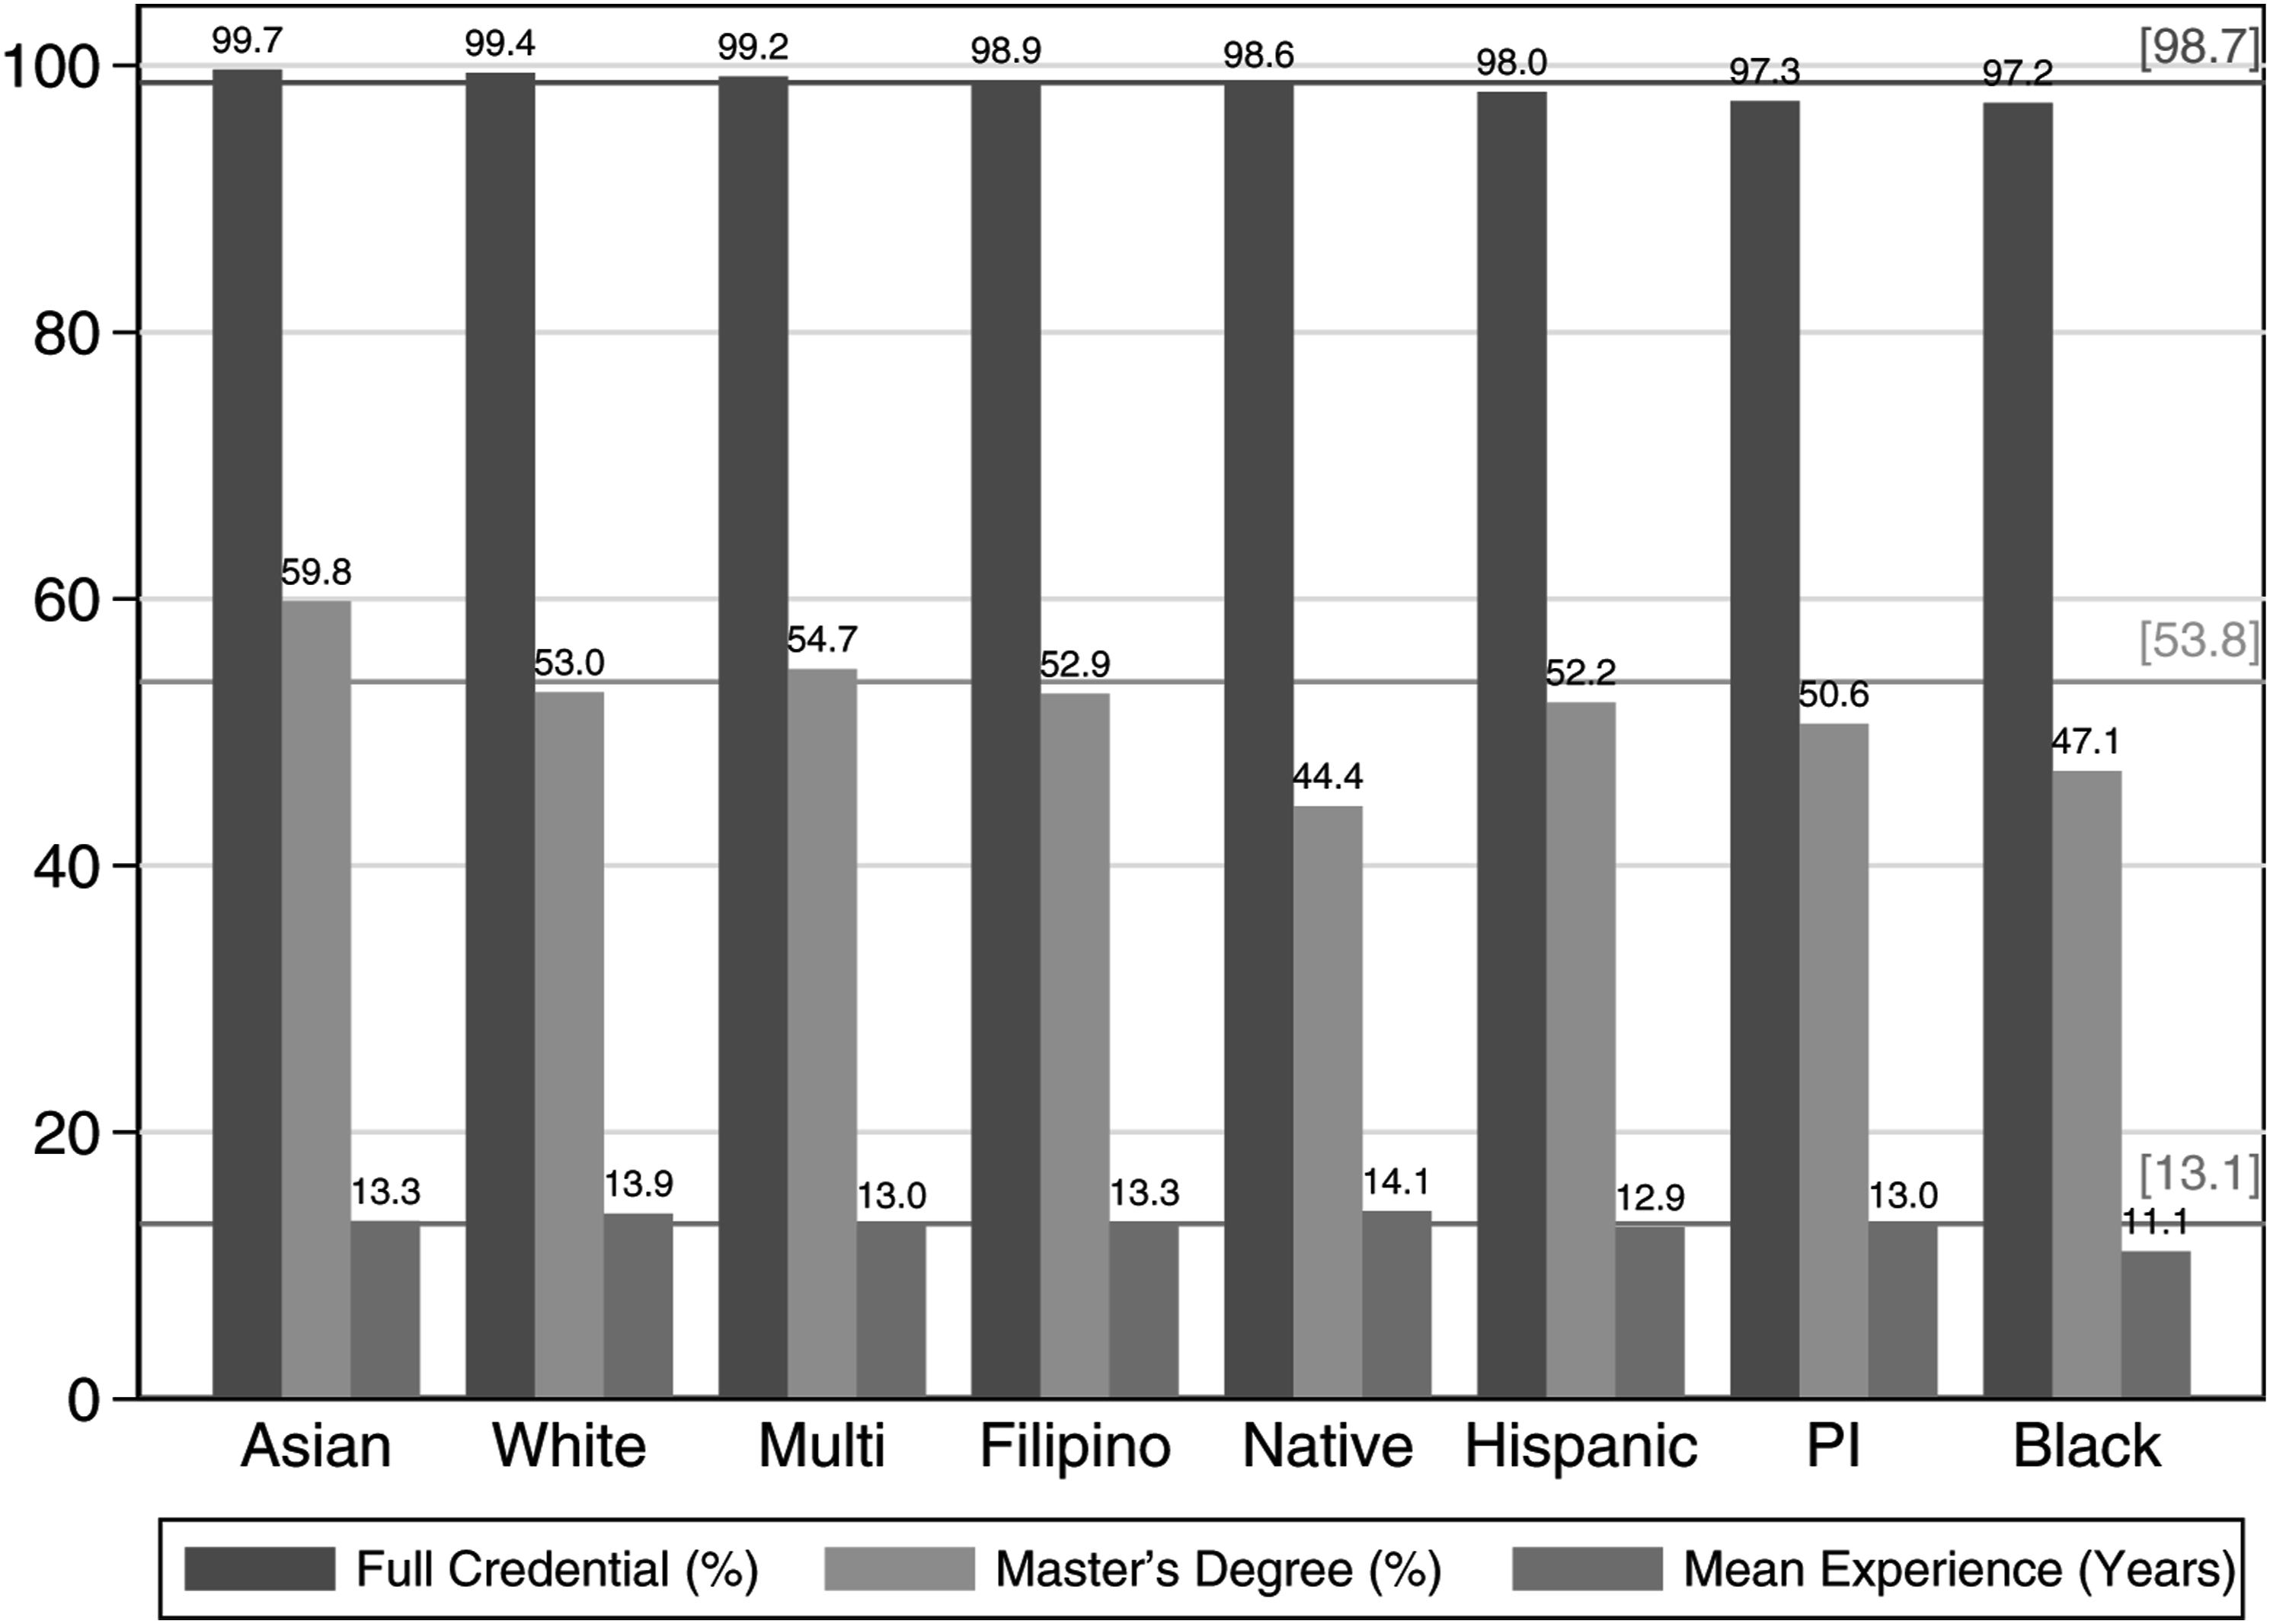
At the same time, Hispanic, Pacific Islander, and Black students had CS teachers with consistently below-average credentials. This is particularly true for Black students, whose CS teachers were the least likely to be fully credentialed and the least experienced on average and were less likely to have a master’s degree than the teachers of any other group except Native American students. Although these differences are not always large, it is concerning that students in these groups are not only participating in CS courses at relatively low rates but appear to have access to somewhat less-qualified teachers.
As discussed above, apart from access to teachers who are more highly qualified, access to demographically-similar teachers may be important, especially for underrepresented students in STEM fields. However, as shown in Figure 7, at no time since 2003–2004 have female teachers accounted for even one third of CS course enrollments’ instructors, even as they have always accounted for at least 47% of non-CS course enrollments’ instructors. Female teachers’ representation in CS courses has also grown more slowly than in other types of courses; from 2003–2004 the female teacher share increased by less than four percentage points—from 28.7% to 32.2%—among CS course enrollments even as the female teacher share grew by more than seven percentage points—from 47.1% to 54.3%—among other enrollments. Percentage of course enrollments taught by female teachers. Data are not available for the 2009–2010 school year.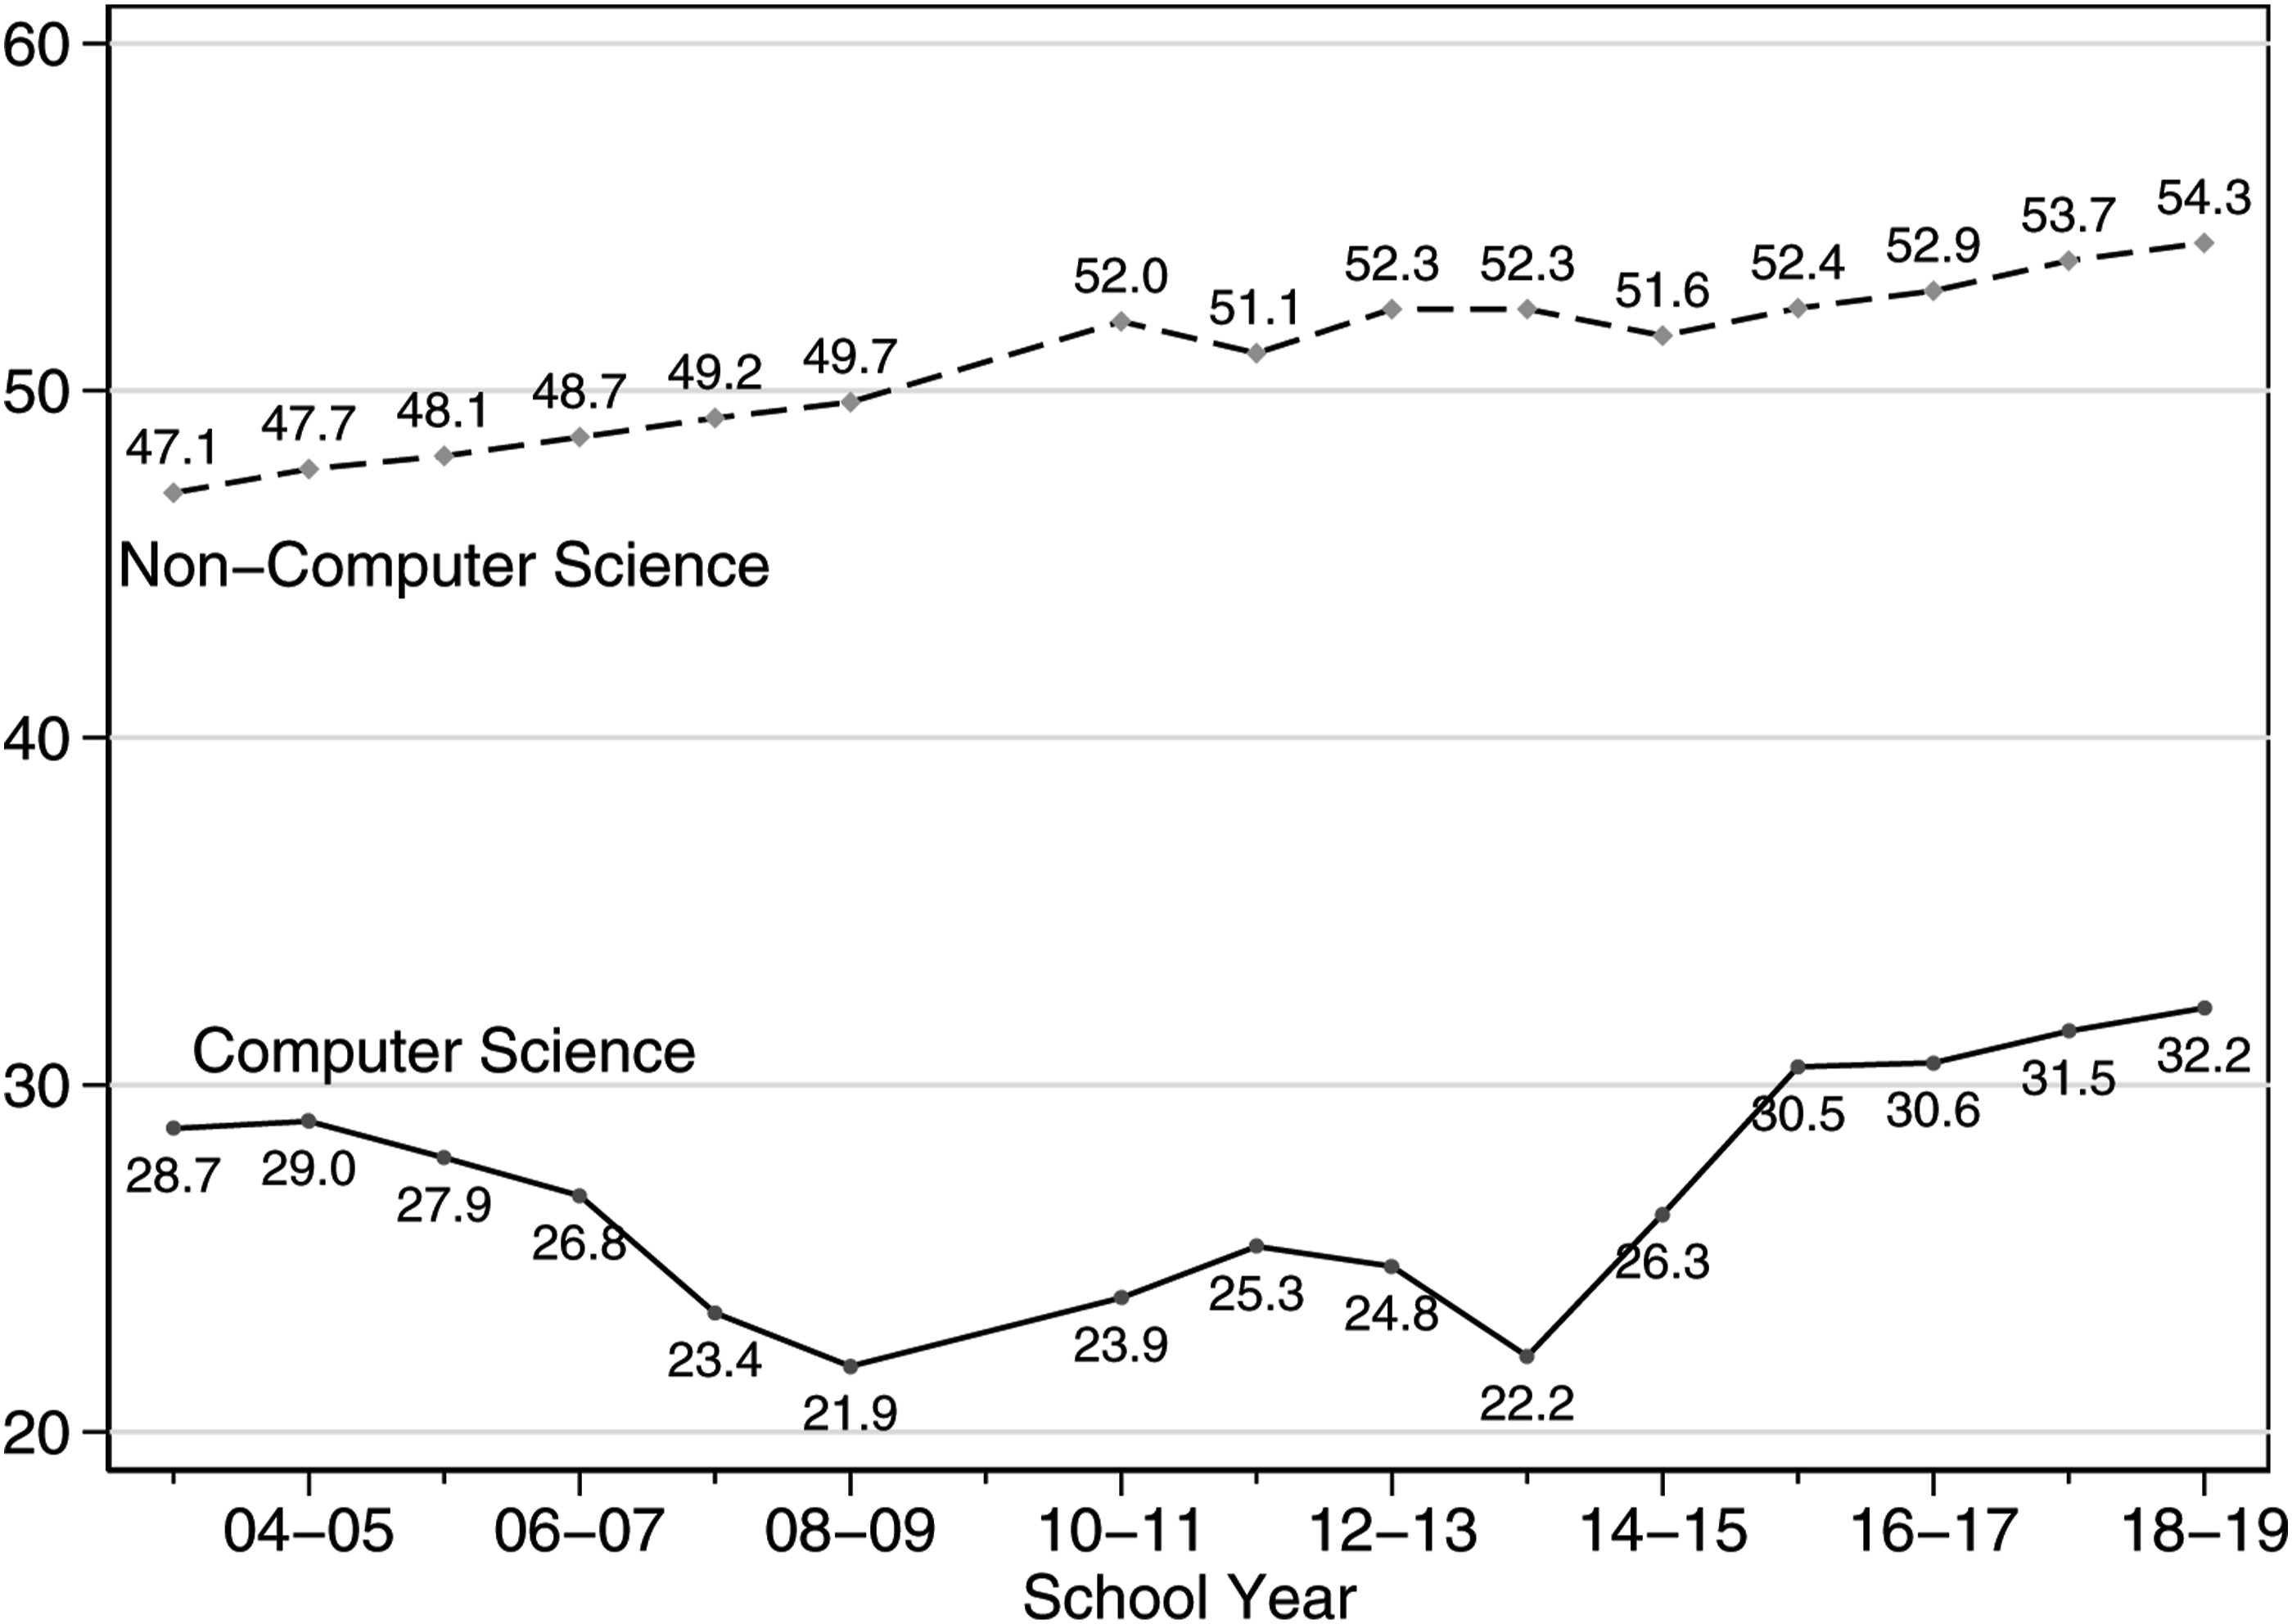
Accordingly, as shown in Figure 8, the share of female CS enrollments taught by a female teacher has grown only gradually, from 27.4% in 2012–2013 to 34.5% in 2018–2019. By comparison, male CS students were roughly twice as likely as female students to have a same-gender teacher in 2018–2019: 68.8%. This may disadvantage female students in CS courses and may discourage them from enrolling in those courses at all. Indeed, in every year for which enrollment numbers are broken down by student gender, the percentage of female CS enrollments taught by female teachers (the dashed line in Figure 8) exceeds the percentage of all CS enrollments taught by female teachers (the solid line in Figure 7). This is consistent with female students being more likely to enroll in CS courses when those courses are taught by a female teacher. However, we cannot demonstrate the processes by which students choose to enroll in CS courses with these data, nor can we observe why teachers of different genders become responsible for teaching CS courses. Percentage of computer science enrollments taught by same-gender teachers.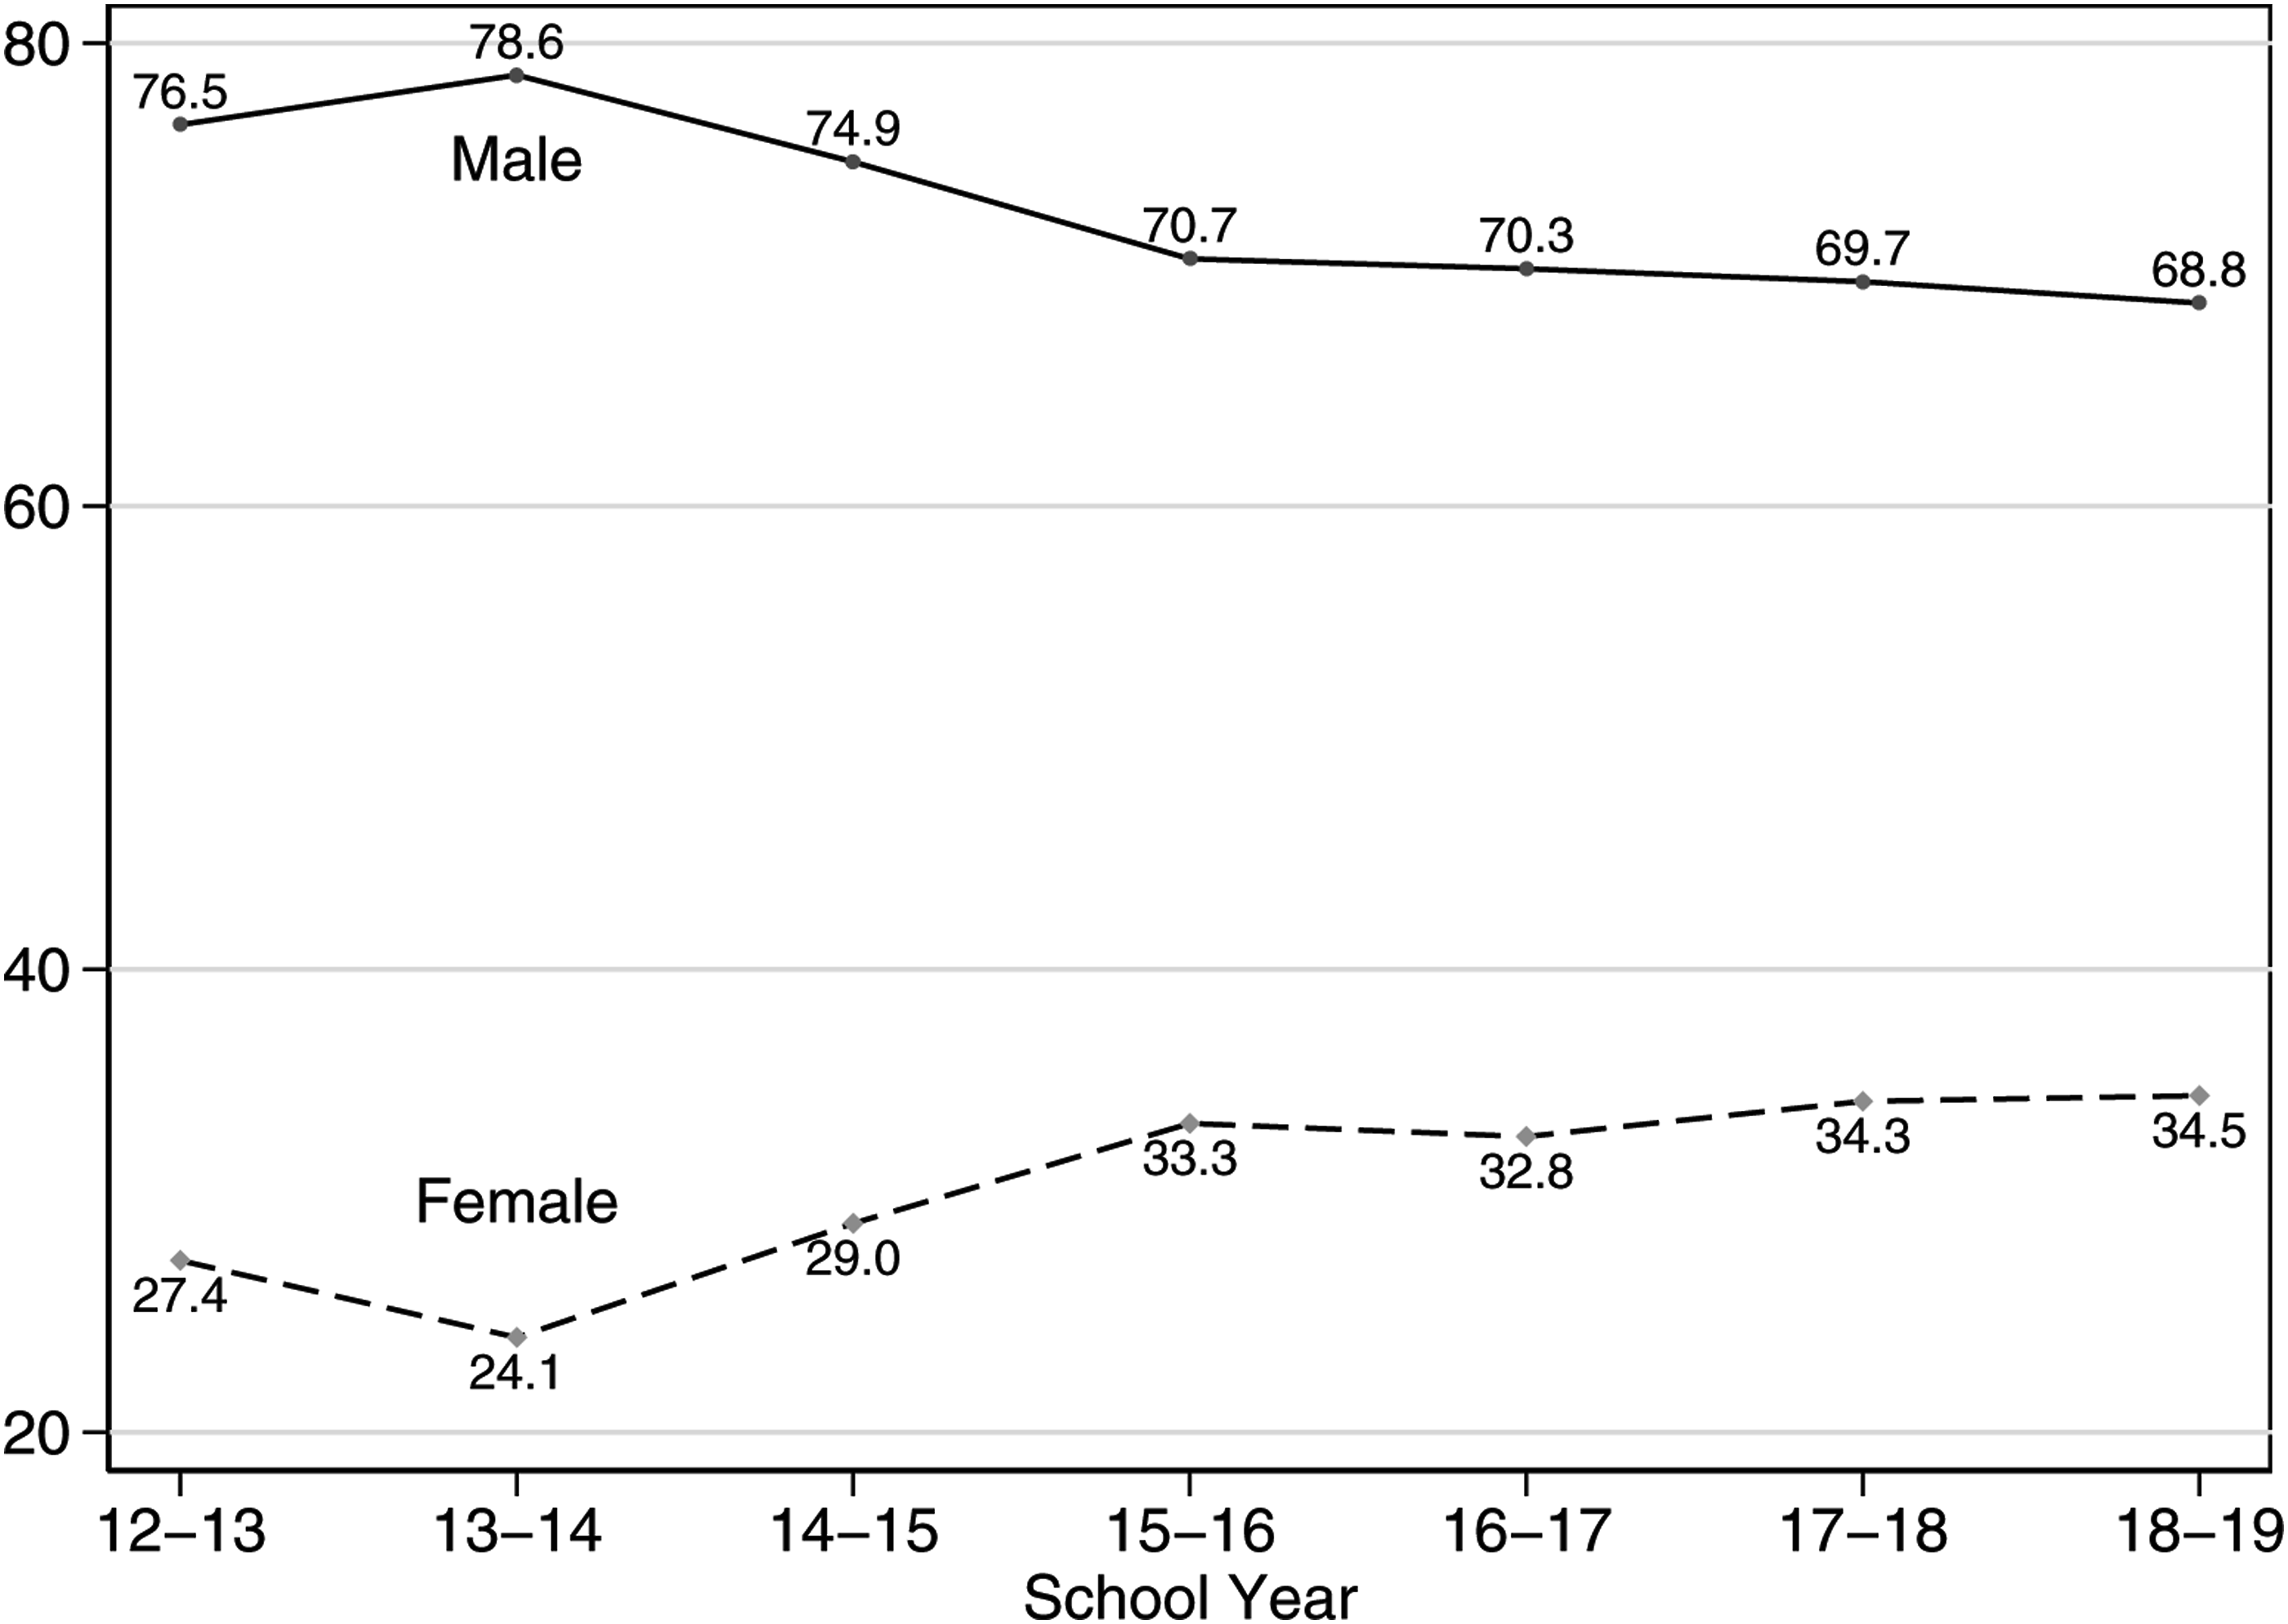
The CS teaching force in California has diversified slowly along racial lines as well. Figure 9 shows trends since 2012–2013 in the representation of different racial groups among statewide high-school enrollment (the solid lines), CS enrollments (the dashed lines), and CS teachers (the dotted lines). For example, while White students accounted for 24.5% of statewide high-school enrollment and a nearly identical share of CS enrollments in 2018–2019, 66.7% of CS enrollments were taught by White teachers. At the same time, Hispanic students represented 52.6% of all high school students but only 42.2% of CS enrollments, and only 13.5% of CS enrollments were taught by Hispanic teachers. Notably, the last two of those figures represented slight decreases from 2012–2013, indicating decreasing Hispanic representation in CS courses among both students and teachers, even as Hispanic students became a larger proportion of statewide enrollment. Percentage of statewide enrollment, computer science (CS) enrollments, and CS teachers from different racial groups. CS teachers are weighted based on the enrollments in their courses.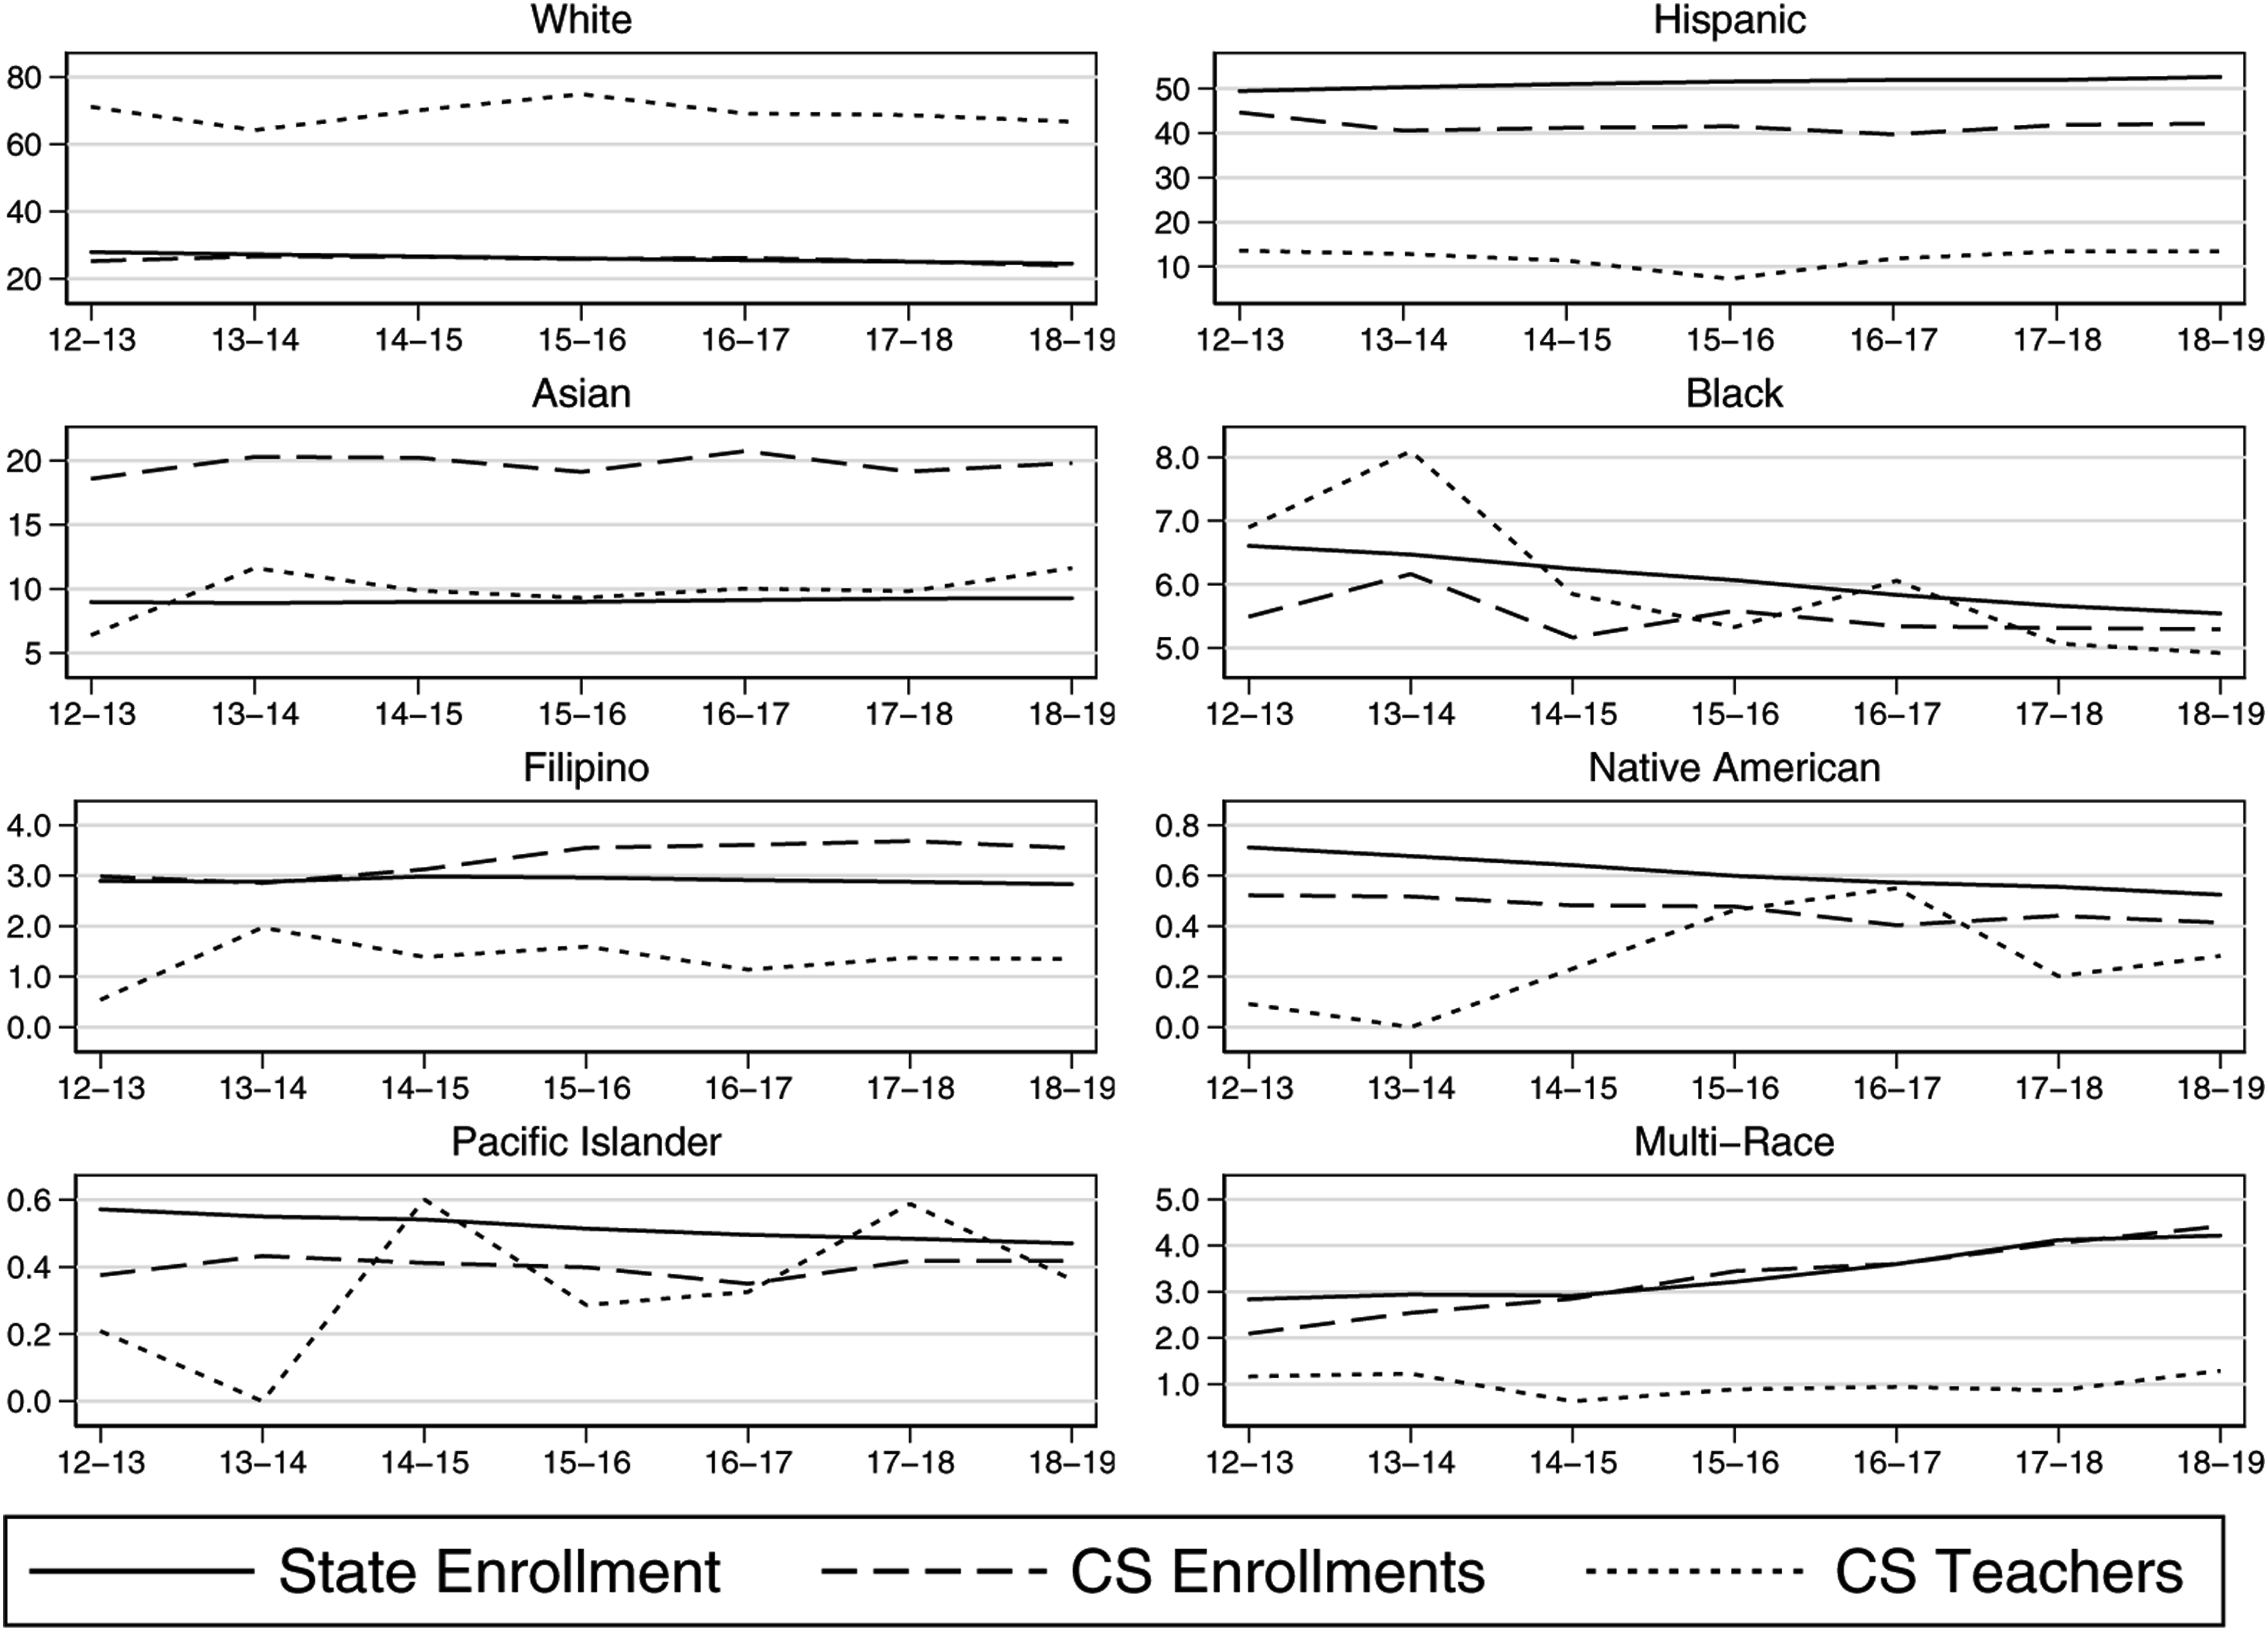
Comparing the solid lines in each panel of Figure 9 to the corresponding dashed line shows that, consistent with the patterns of CS participation discussed above, students from many racial groups are underrepresented in CS courses relative to their share of statewide enrollment. Pacific Islander, Hispanic, Black, and Native American students have consistently represented smaller shares of CS enrollments (the dashed lines) than of statewide enrollment (the solid lines). Only Asian and, in recent years, Filipino students have been overrepresented in CS courses during this period, consistent with the evidence above that those groups of students have relatively high CS participation rates. Multi-race students’ representation in CS courses has largely tracked their representation in the statewide student population. However, changes for this group are particularly difficult to interpret since the specific racial composition of these students may change over time and differ between students who enroll in CS courses and those who do not.
Additionally, comparing the dotted lines in each panel of Figure 9 to the corresponding dashed lines shows that several of the racial groups most underrepresented in CS courses are even more underrepresented among CS teachers. In addition to the wide gap between the Hispanic share of CS course enrollments and CS teachers discussed above, the share of Asian or Filipino CS teachers is smaller than the corresponding shares of CS enrollments, and the same is true in recent years for the Black and Native American shares. As was the case with gender, these gaps in teacher representation suggest the possibility of inequitable access to same-race CS teachers for many students. Indeed, this is precisely what is observed in Figure 10, which shows the share of CS enrollments with a same-race teacher for each racial group defined by the CDE. Percentage of computer science enrollments taught by same-race teachers. PI = Pacific Islander.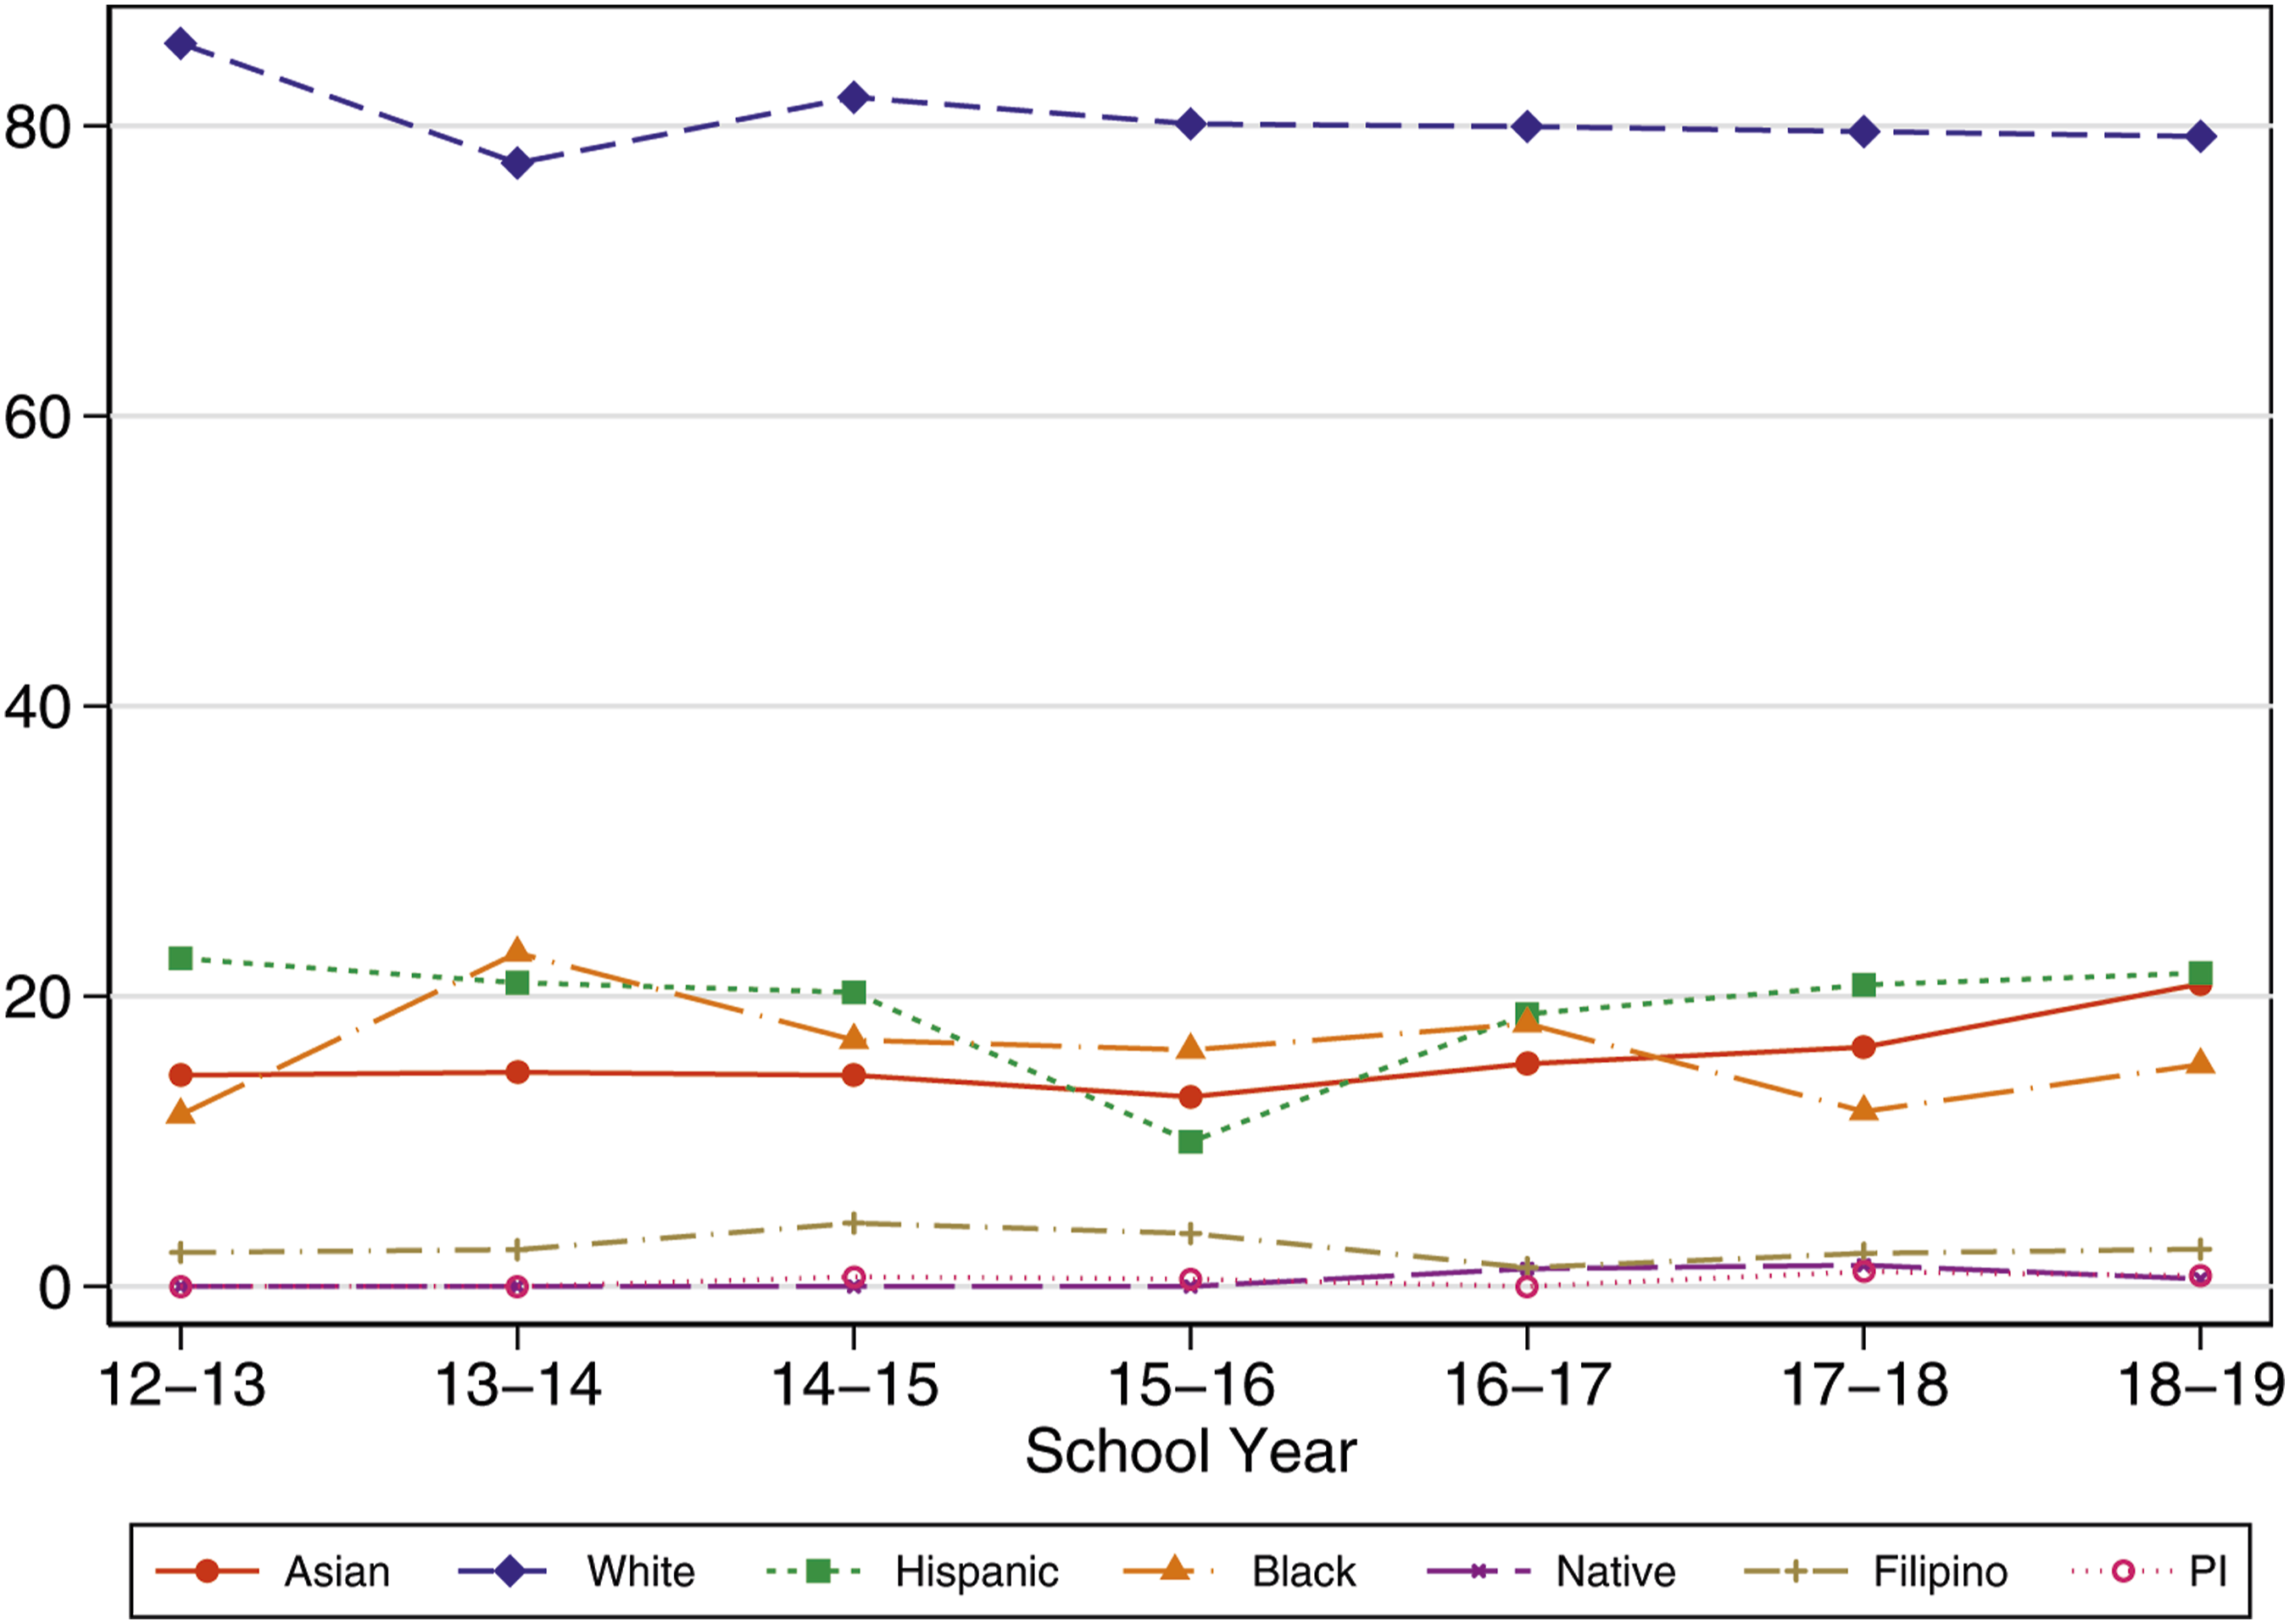
Only for White students are the majority of their CS course enrollments taught by a same-race teacher, reflecting the fact that the large majority of CS teachers are White (Figure 9). In contrast, for no other racial groups does the share of CS enrollments taught by a same-race teacher exceed 23% in any year. For Native American, Filipino, and Pacific Islander students, that share never reaches even 5%, and in some years is exactly zero. Given the apparent benefits of student–teacher racial alignment discussed above, the dearth of same-race teachers may help to explain the relatively low participation rates for many of these groups of students and may disadvantage those students who do participate.
Discussion
Expansions of K-12 CS curricula in California provide potentially important lessons for policymakers elsewhere pushing for equity in STEM education, which is likely to increasingly focus on CS specifically. Like some previous work, we find in California that while access to CS courses has expanded rapidly in high schools, these expansions have not been equitable along race lines. Moreover, we also show that these race gaps in secondary CS access have translated into substantial CS participation gaps. Black, Hispanic, and Native American students in particular enroll in CS courses at much lower rates than other students, and this appears to be due at least in part to the fact that these students are less likely to attend schools offering CS courses. Additionally, female students enroll in CS courses at lower rates despite being as likely as male students to attend schools offering CS courses and the gaps between male and female students’ enrollment have increased. We do not observe students’ reasons for enrolling in CS courses when they are available, but prior research has found that differences in such choices across racial and gender lines may be driven by stereotypes about computer scientists (Cheryan et al., 2013) or a misalignment between students’ values and their perceptions of the usefulness of CS (Lewis et al., 2019).
Compounding—and perhaps contributing to—these gaps is the fact that many of these same groups of students are also relatively unlikely to have a same-race or same-gender CS teacher even if they are enrolled in CS courses. This is because high school CS teachers in California remain mostly White and mostly male. Thus, the documented benefits of racial and gender congruence with their teachers are enjoyed primarily by White and male students.
This points to the need to think about how the CS teacher workforce can be diversified, a challenge that has plagued STEM education globally (UNESCO, 2015, 2017). Additional authorization requirements may pose additional barriers to entry into teaching jobs where the supply of female teachers and teachers of color is already extremely low. For instance, given their low CS participation rates at the post-secondary level (BPCnet, 2020), a requirement that CS teachers have completed substantial college-level CS coursework could further reduce the supply of female CS teachers and CS teachers of color. Additional prerequisites for CS teachers should be established only with some clear justification for expecting that they will increase CS teacher quality. It may also be useful to couple additional entry requirements with policies with some promise to increase the supply and retention of teachers currently underrepresented in CS, such as tuition subsidies for prospective CS teachers of color (Landa, 2020), salary increases (Achinstein et al., 2010), or induction supports or “grow your own” preparation programs (Carver-Thomas, 2018). Additionally, researchers should explore the processes by which teachers choose to become CS teachers, particularly in contexts where flexible authorization requirements would allow multiple existing teachers at a school to teach CS courses.
More generally, our results highlight the importance of not conflating different kinds of equity issues. For example, the fact that male and female high school students are similarly likely to attend schools offering CS could easily obscure gender inequities in terms of actual participation in CS or in terms of access to same-gender CS teachers. Similarly, our results underscore the importance of distinguishing the different dimensions of students’ identities along which inequities might arise. For instance, we find that race gaps in CS participation are to a substantial degree explicable in terms of access gaps, but gender gaps in CS participation are not. Attempts by policymakers to address one type of inequity may therefore do little to address other types of inequity. Equity-oriented CS education policies should be motivated explicitly not only by data, but in terms of the specific dimensions of equity the policy is expected to promote.
Our analyses are limited in ways that point to important areas for future research. For example, we identify CS courses based on their titles and descriptions, but do not observe their content; in some of these courses, students may learn computer literacy rather than CS (Margolis et al., 2008). Additionally, the observable teacher characteristics in our data are at best rough proxies for teacher quality. Thus, we are limited in what we can say about true CS teacher quality gaps. This points to the need for better measures of CS teacher quality. However, even many commonly-used measures of teacher quality that seem appropriate for other subject areas—such as evaluation ratings by administrators or value-added measures (VAMs) of contributions to student test scores—may be unsuitable for use in CS courses. For example, administrators may choose to observe teachers when teaching courses other than CS (if they observe teachers at all), administrators may not know how to assess CS instructional quality, and VAMs typically require sequential years of standardized student assessment data. As students spend more time in CS courses, it will be increasingly important to develop better measures of CS teacher quality that can be used to assess both the average strength of CS teachers and the prevalence of gaps in CS teacher quality between different groups of students.
In sum, effective CS implementation in schools requires more than enrolling ever-growing numbers of students in CS courses. In addition to attending to access and participation gaps between groups of students, administrators and policymakers need to attend to issues of teacher quality. Consequently, researchers should attend to these issues as well. The importance of these challenges, and thus the importance of understanding and meeting them, will likely continue to grow for the foreseeable future.
Footnotes
Acknowledgments
We are grateful for data support from the Data Reporting Office of the California Department of Education, and for research assistance from Anisha Kaul and Sage White. This work was supported by the Google Computer Science Education Research Program. All errors, omissions, and opinions are those of the authors.
Declaration of conflicting interests
The author(s) declared no potential conflicts of interest with respect to the research, authorship, and/or publication of this article.
Funding
The author(s) disclosed receipt of the following financial support for the research, authorship, and/or publication of this article: This work was supported by the Google Computer Science Education Research Program.