Abstract
Recent developments in communication technology and changes in people’s communication habits facilitate new data collection forms in web surveys. Technical devices, such as computers, tablets, and smartphones, enable researchers to rethink established communication forms and add a human touch to web surveys. Designing web surveys more human-like has the great potential to make communication between researchers and respondents more natural, which may result in higher survey satisfaction and data quality. Considering the existing survey literature, there are only a few studies investigating respondents’ willingness for new communication forms in web surveys. Hence, in the present study, we explore respondents’ willingness to take part in web surveys to have interviewers read questions via pre-recorded videos (question delivery) and in which respondents provide their answers orally via self-recorded videos (question answering). We included two willingness questions – one on question delivery via pre-recorded videos and one on question answering via self-recorded videos – in the non-probability SoSci panel in Germany. The results reveal that respondents’ willingness to have questions read by interviewers is higher than their willingness to self-record video answers. Believing that technology facilitates communication and perceiving the survey as being interesting increases willingness, whereas evaluating the survey topic as sensitive decreases willingness. Personality traits do not play a role when it comes to respondents’ willingness, except for extraversion.
Keywords
Introduction and research questions
Web surveys are one of the most frequently used methods for collecting information about individuals, such as attitudes, beliefs, and behaviors, in empirical social research and many other disciplines. The main reasons for the popularity of web surveys are cost-effectiveness and timeliness (Callegaro et al., 2015). Another methodological advantage, in comparison to other common survey modes, such as postal and telephone surveys, is that web surveys are highly amenable to technological developments. 1 This amenability allows innovations and the integration with other methods and data sources (Conrad et al., 2021; Struminskaya et al., 2020). This is additionally supported by a constant increase of mobile devices, such as smartphones, in web survey participation. For example, in the first regular wave of the probability-based German Internet Panel (September 2012), 94% of respondents participated with a computer, 2% with a tablet, and 4% with a smartphone. A decade later, this distribution has significantly changed. In the May 2022 wave of the German Internet Panel, 56% of respondents participated with a computer, 4% with a tablet, and 40% with a smartphone. 2 This overall trend is supported by a variety of national and international studies (see, for example, Gummer et al., 2019, 2023; Peterson et al., 2017; Revilla et al., 2016) and enables researchers to consider new communication forms in web surveys.
Most web surveys use written language as a medium to communicate with respondents. Researchers ask text-based questions including answer options (closed answer format) or text boxes (open answer format). The problem with such communication forms is that they impede web survey participation for respondents with low literacy. For example, Grotlüschen et al. (2019) estimate that in 2018 approx. 12% (or 6 million) of the adult population in Germany could not sufficiently read and write and another 21% (or 11 million) showed misspellings even with commonly used words. Data from the UNESCO Institute for Statistics (2017) estimates that in 2016 approx. 14% (or 750 million) of the world population was illiterate. The inclusion of video-based communication forms in web surveys may help to include respondents with low literacy.
An incorporation of video-based communication forms makes the communication process between researchers and respondents more natural and human-like (Sun et al., 2021; West et al., 2022). The automatic question reading by interviewers via pre-recorded videos (question delivery) and the answer provision by respondents via self-recorded videos (question answering) mimics daily conversation. Specifically, respondents are exposed to a web survey setting that includes a video play function for reading questions and a video recording function for gathering answers. This also allows respondents to engage in open narrations, particularly in response to open-ended questions, which may result in nuanced and in-depth information on the object under investigation (Gavras et al., 2022).
Video-based web surveys are associated with several methodological advantages that have the potential to facilitate web survey participation and to improve data quality. For example, the automatic question reading by interviewers reduces respondent burden because they do not have to read the questions and answer options themselves (see Tourangeau et al., 2000, pp. 302–304 for a discussion of how different survey modes affect respondent burden). Developments in Automatic Speech Recognition (ASR), Natural Language Processing (NLP), and Text-as-Data methods also enable a proper handling and analysis of video data obtained via large-scale web surveys. In addition, respondents’ video-recorded answers contain rich tonal and facial cues that can be utilized by recognition software for predicting participants’ affective states and interest, which can be relevant to data quality.
Taking a look at the survey literature, it is observable that there is a variety of studies dealing with respondents’ willingness to share digital data and/or to engage in additional tasks, such as downloading apps, share Global Positioning System (GPS) data, and take photos or scan barcodes (see, for example, Keusch et al., 2019; Revilla et al., 2019; Wenz et al., 2019). There are also a few studies investigating respondents’ willingness for audio and voice communication forms (Höhne, 2023; Lenzner & Höhne, 2022; Revilla et al., 2018). They reveal that between 25% and 52% of respondents are willing to use audio communication forms (having the questions read aloud) and between 16% and 54% of respondents are willing to use voice communication forms (providing oral answers via voice input).
Some studies also investigate pre-recorded video interviewing in web surveys for asking sensitive questions. Compared to traditional (text-based) web surveys, some of these studies found no disclosure differences (Fuchs & Funke, 2007, 2009), but some other studies did (Fuchs, 2009; Krysan & Couper, 2003). Specifically, the gender and ethnicity of the interviewer affected respondents’ answers. More recent research indicates methodological benefits associated with pre-recorded videos in web surveys (Conrad et al., 2023): they resulted in more disclosure of sensitive information and less superficial answer behavior in terms of rounding (e.g., saying “10” or “20”) when providing numeric answers. Missing data in terms of item-nonresponse was not increased. However, these studies do not provide evidence on respondents’ willingness to give self-recorded video answers. By addressing both respondents’ willingness for pre-recorded question delivery and self-recorded question answering, our study stands out of previous research and contributes to the current state of research. We address the following two research questions: (1) To what extent are respondents willing to participate in video-based web surveys to have the questions delivered via pre-recorded videos and to answer via self-recorded videos? (2) What drives respondents’ willingness to participate in video-based web surveys to have the questions delivered via pre-recorded videos and to answer via self-recorded videos?
Accordingly, we investigate respondents’ willingness to participate in video-based web surveys. It is not to be confused with respondents’ preference of this answering format.
Method
Data
Data was collected in the non-probability SoSci Panel (www.soscipanel.de). The SoSci Panel is a project of the Institute for Communication Science and Media Research at the Ludwig-Maximilian-University Munich and the German Society for Journalism and Communication Science (DGPuK). It does not pursue any commercial goals and only studies related to academia are accepted. Researchers are eligible to submit study proposals that undergo a review process evaluating the methodological soundness of the studies. By proposal acceptance, respondents of the SoSci Panel pool (recruited via an opt-in subscription process) are invited to take part in the web surveys. The email invitation is administered by the panel staff. Web survey data collection is free of charge (researchers do not have pay to any fees).
The web survey ran from 16th May 2022 to 5th June 2022 (with a reminder sent on 25th May 2022). The invitation email was sent to 5,676 respondents (out of these emails, 68 could not be successfully delivered). Invitations included information on the topic (new communication forms in web surveys), the estimated duration of the web survey (approx. 20 minutes), and a link to the web survey. Respondents could use the device of their choice for web survey completion. The first page of the web survey provided additional details on the web survey and its structure. We also included a statement of confidentiality, expounding that the study adheres to EU and national data protection laws and regulations. Respondents took part voluntarily without the provision of incentives. Data and analysis code for replication purposes are available via Harvard Dataverse (see https://dataverse.harvard.edu/dataset.xhtml?persistentId=doi:10.7910/DVN/C361FV).
Willingness questions
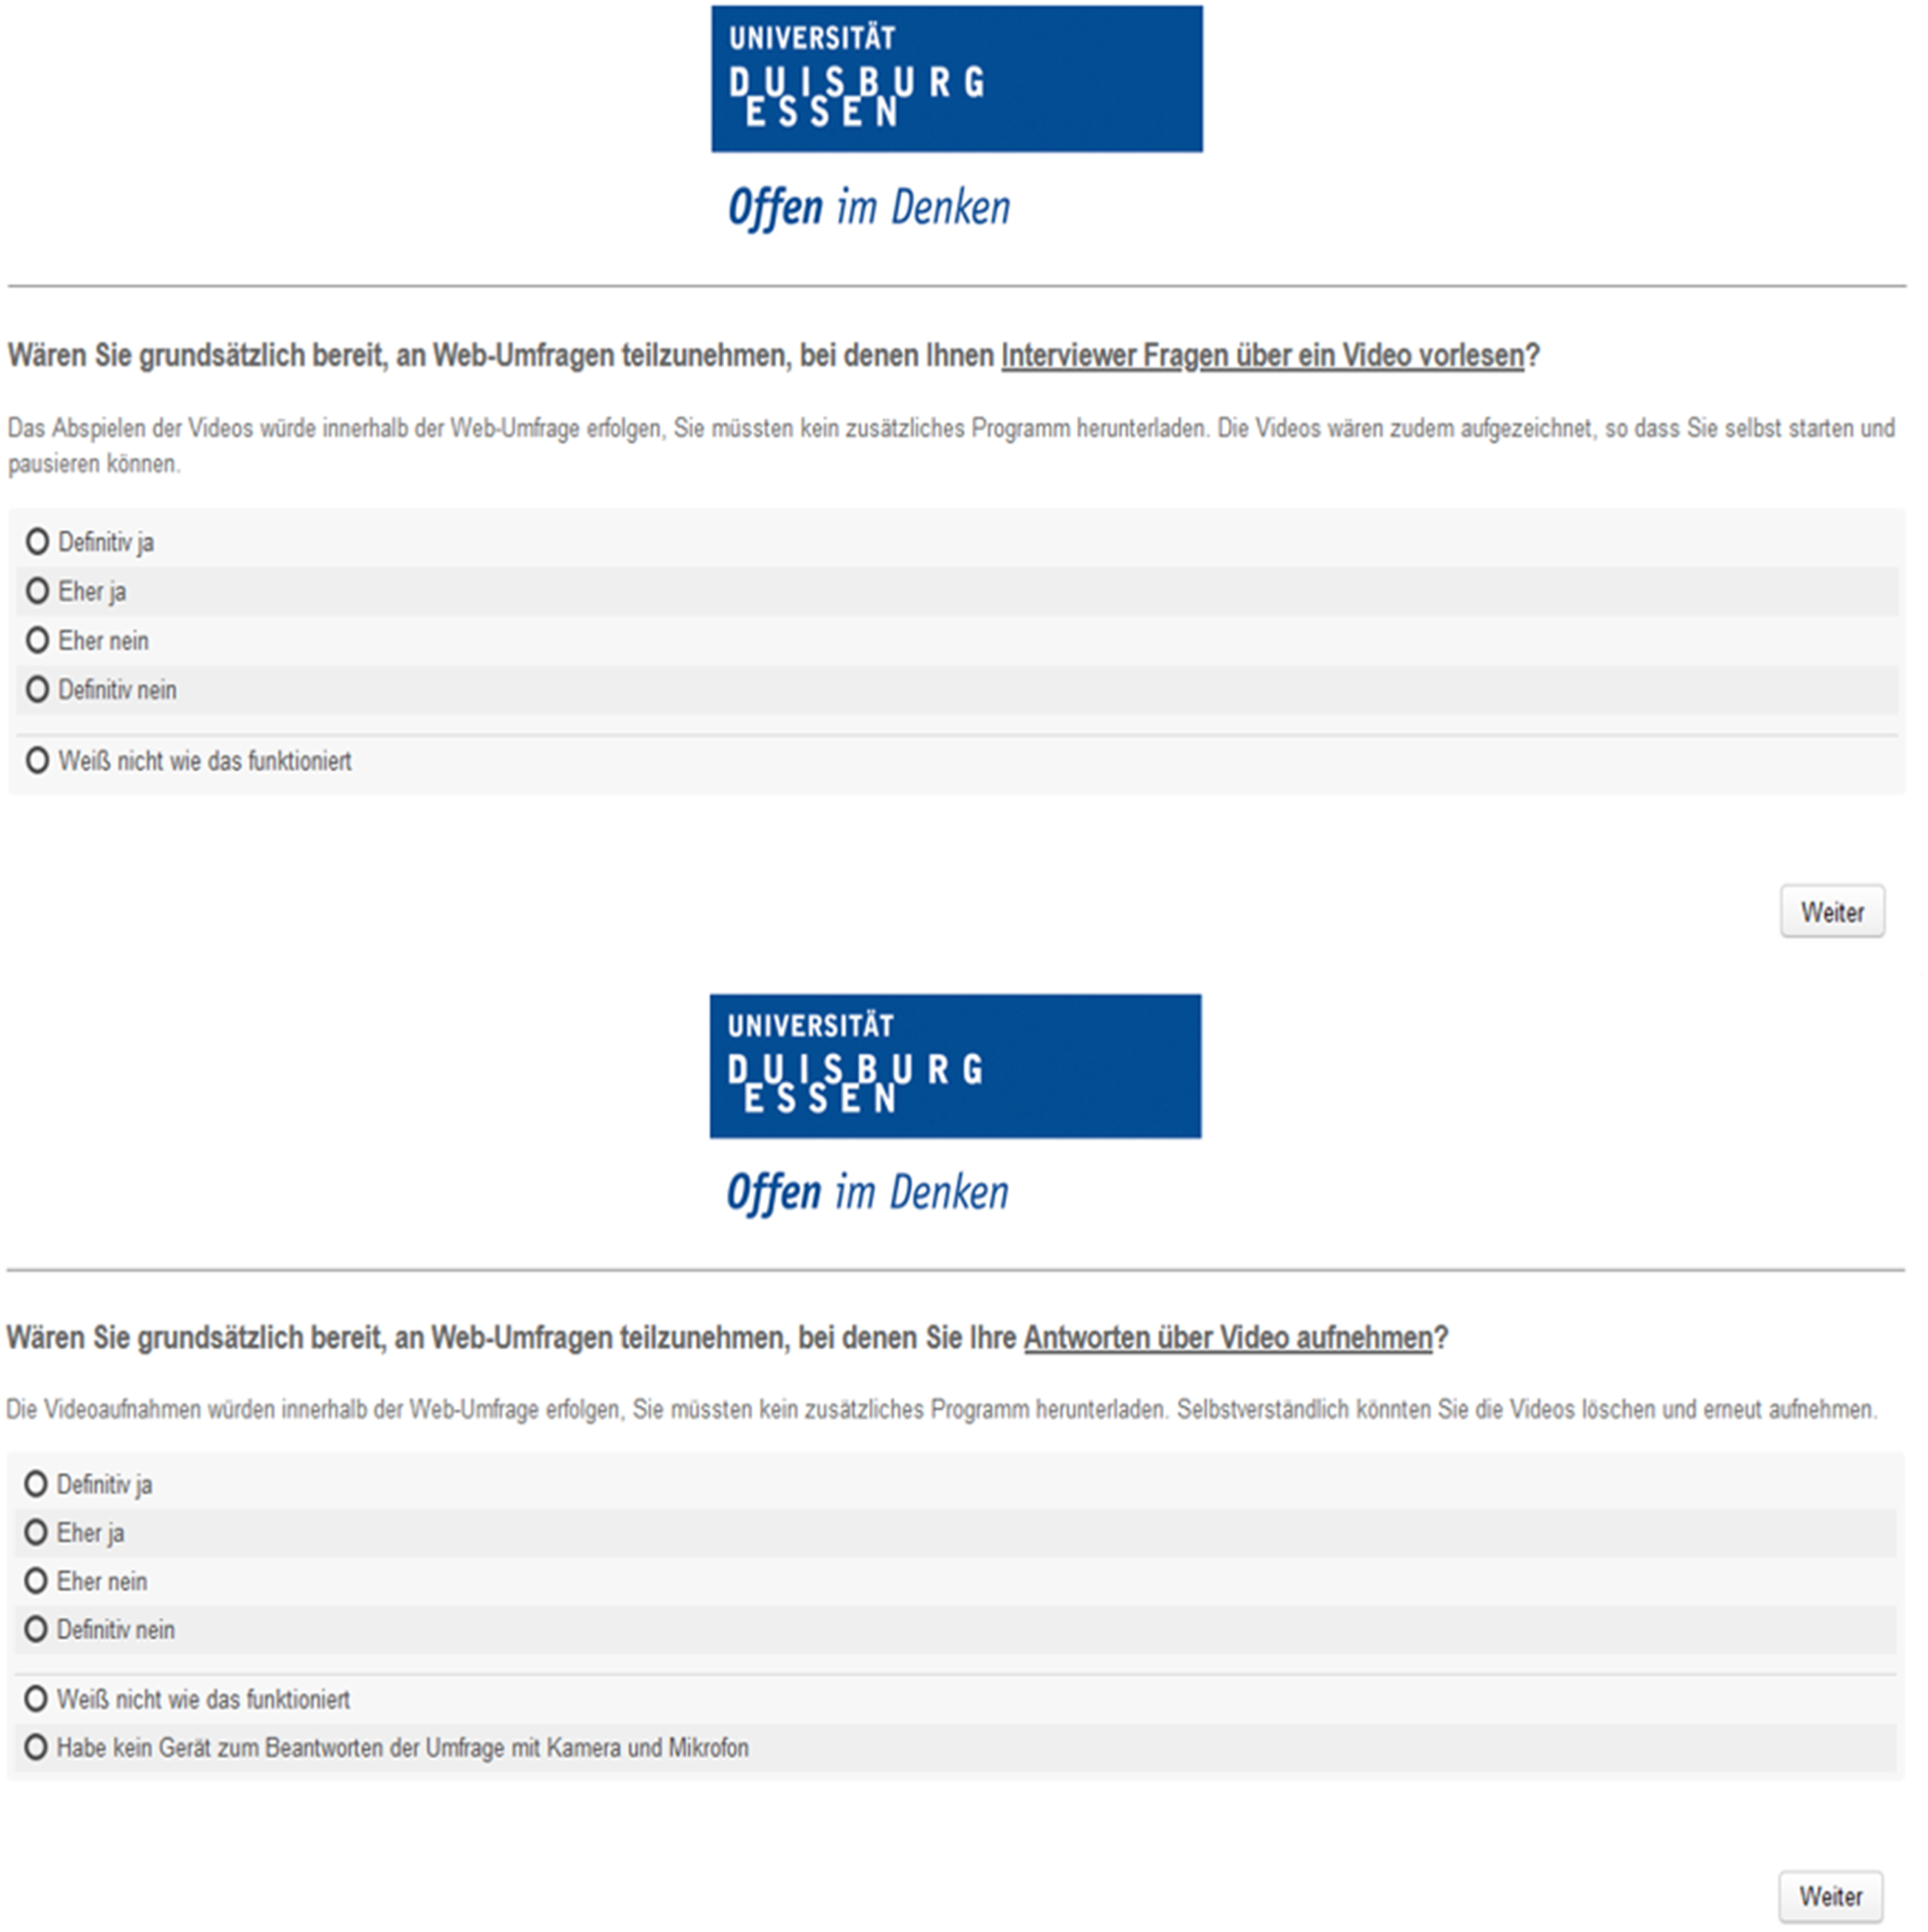
In the web survey, we employed the following two questions on respondents’ willingness to have questions read through pre-recorded interviewer videos and to answer through self-recorded videos (question order represents the order of the questions in the web survey): (1) Question delivery: In general, are you willing to participate in web surveys in which interviewers read questions to you via pre-recorded videos? The videos would be played within the web survey, you would not have to download any software. You could start and stop the videos at your convenience. (2) Question answering: In general, are you willing to participate in web surveys in which you self-record your answers via videos? The video recordings would be gathered within the web survey, you would not have to download any software. You could delete the videos and record them again.
The questions were presented on two separate web survey pages (single-question presentation) with the following vertically-aligned answer options: 1 ‘definitely yes’, 2 ‘probably yes’, 3 ‘probably no’, 4 ‘definitely no’, 5 ‘don’t know how this works’, and 6 ‘don’t have a device with camera and microphone’ (only for the second willingness question). The last two options were visually separated by a divider line from the remaining options (Figure A1 in the Appendix shows screenshots of the two willingness questions). The two willingness questions were placed at the beginning of the web survey and were followed by questions on communication habits and the control variables mentioned in the results section below.
Sample
In total, 297 respondents participated in the study. 3 These respondents were aged between 18 and 87 years, with a mean age of 49, and 63% of them were female. 4 In terms of education, 6% had completed lower secondary school or less (low education level), 15% percent intermediate secondary school (medium education level), and 79% college preparatory secondary school or university-level education (high education level). Devices for web survey participation were distributed as follow: 63% computers, 3% tablets, and 34% smartphones.
Results
To investigate our first research question, we inspect the answer distributions of the two willingness questions (question delivery and question answering). Specifically, we report percentages for all answer options.
To address our second research question, we investigate a variety of independent variables associated with respondents’ willingness for video-based web surveys (dependent variables: question delivery and question answering) by running two separate OLS regressions. The two dependent variables are coded as follow: 1 ‘definitely no’, 2 ‘probably no’, 3 ‘probably yes’, and 4 ‘definitely yes’. The non-substantive answer options ‘don’t know how this works’ and 6 ‘don’t have a device with camera and microphone’ are excluded from the regression analyses. We use the following independent variables that were suggested by previous research to be associated with respondents’ willingness (Höhne, 2023; Lenzner & Höhne, 2022; Revilla et al., 2018): believe technology facilitates communication (7 ascending options), personality traits in terms of openness (19 ascending options), conscientiousness (19 ascending options), extraversion (19 ascending options), agreeableness (19 ascending options), and neuroticism (19 ascending options) 5 , and survey evaluation in terms of interest (7 ascending options), difficulty (7 ascending options), and topic sensitivity (7 ascending options). In addition, we control for the following variables: age (continuous), female (1 = ‘yes’), education with low as reference: medium (1 = ‘yes’) and high (1 = ‘yes’), and smartphone use in this survey (1 = ‘yes’). 6
Similar to Höhne (2023) and Lenzner and Höhne (2022), we follow the analytical strategy used by Revilla et al. (2018): inspecting answer distributions in terms of percentages and examining variables driving respondents’ willingness using regression analyses. In doing so, we try to increase the comparability of the results. We use a significance level of .05 for determining statistical significance. All data preparations and analyses were conducted with Stata (version 16).
Research question 1
Respondents’ willingness to have the questions read by interviewers via pre-recorded videos (question delivery) and to give answers via self-recorded videos (question answering).
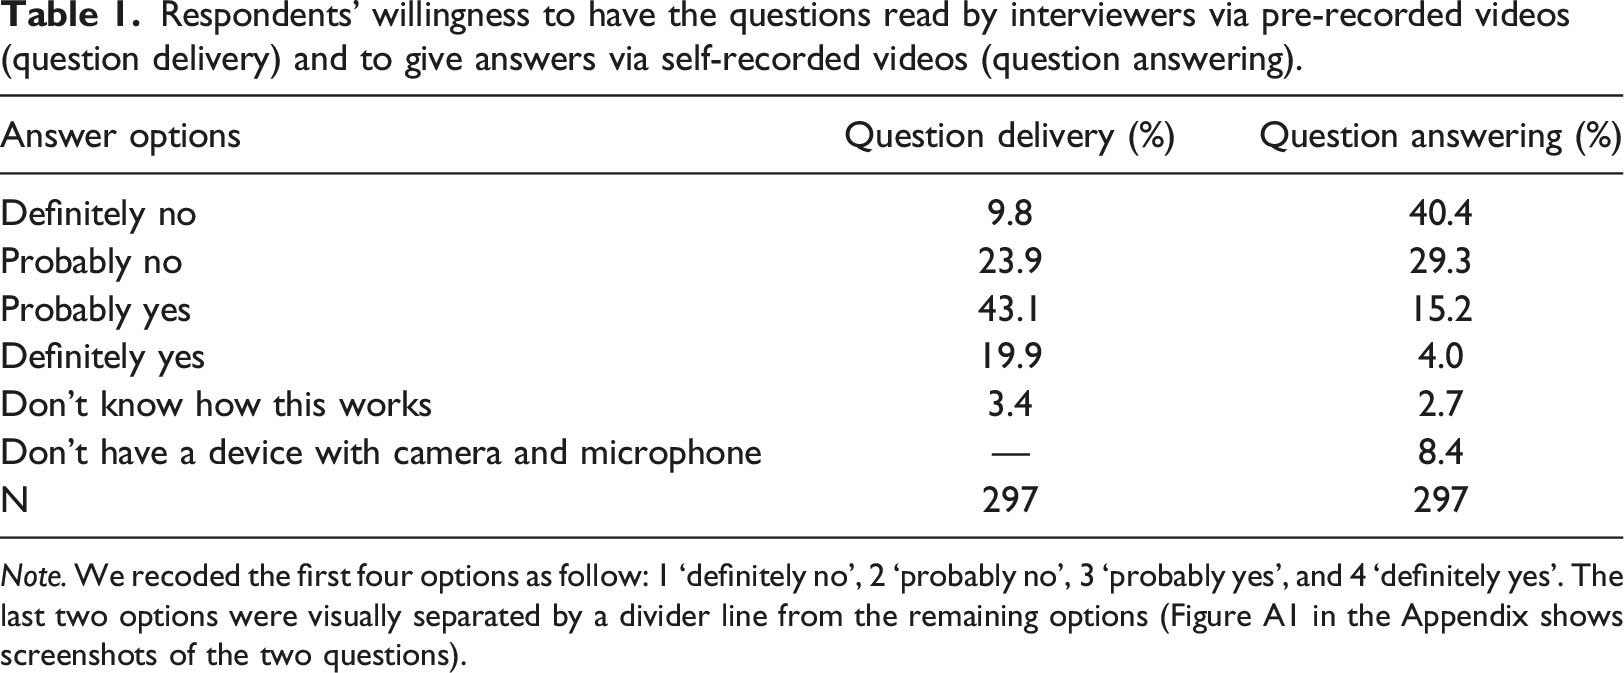
Note. We recoded the first four options as follow: 1 ‘definitely no’, 2 ‘probably no’, 3 ‘probably yes’, and 4 ‘definitely yes’. The last two options were visually separated by a divider line from the remaining options (Figure A1 in the Appendix shows screenshots of the two questions).
Research question 2
Unstandardized OLS regression coefficients of independent variables on respondents’ willingness to have the questions read by interviewers via pre-recorded videos (question delivery) and to give answers via self-recorded videos (question answering).
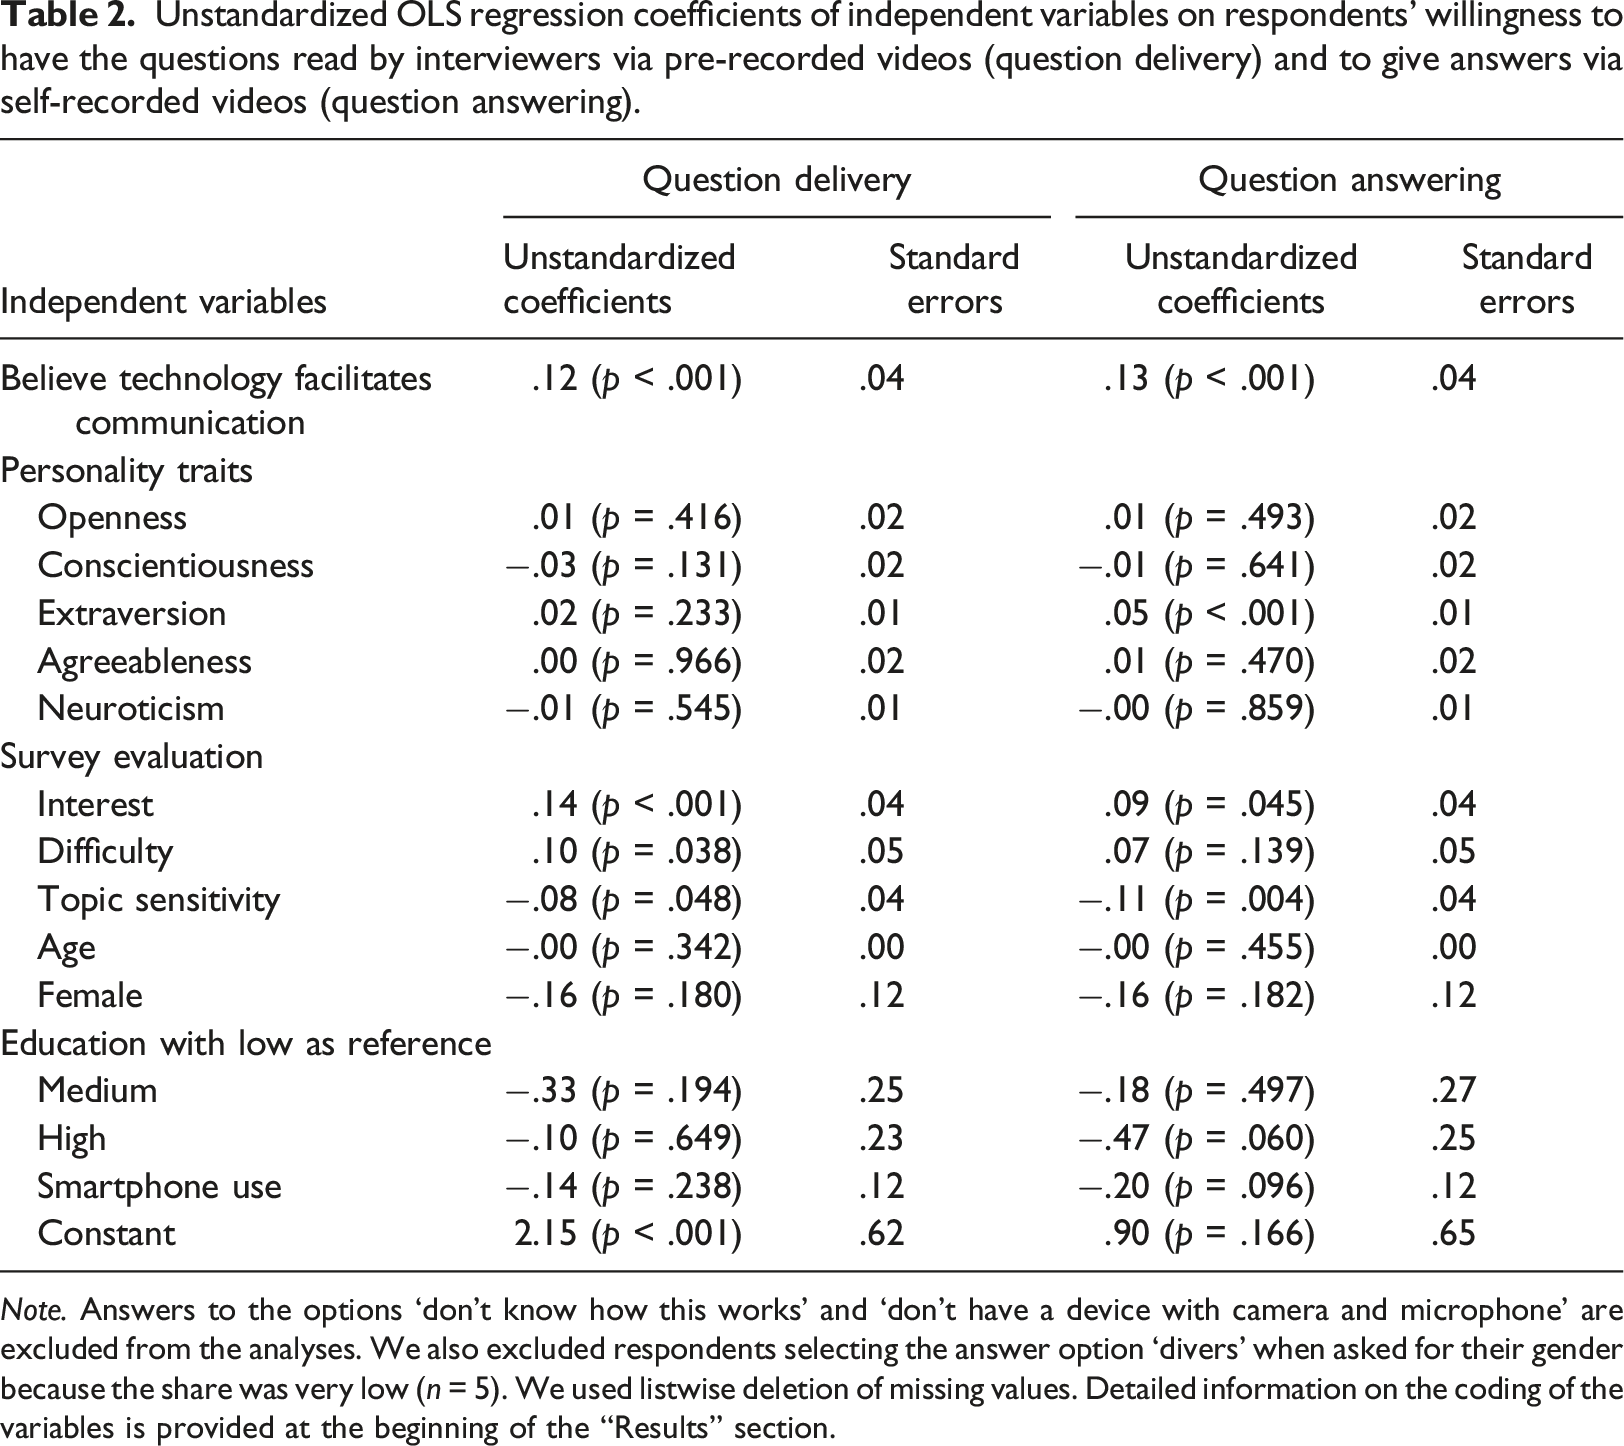
Note. Answers to the options ‘don’t know how this works’ and ‘don’t have a device with camera and microphone’ are excluded from the analyses. We also excluded respondents selecting the answer option ‘divers’ when asked for their gender because the share was very low (n = 5). We used listwise deletion of missing values. Detailed information on the coding of the variables is provided at the beginning of the “Results” section.
We controlled for the following variables: age, gender, education, and smartphone use in this study. However, none of these variables were significantly associated with respondents’ willingness to have questions read by interviewers via pre-recorded videos and to provide answers via self-recorded videos.
Discussion and conclusion
The main goal of the present study was to investigate respondents’ willingness to take part in video-based web surveys: the automatic question reading by interviewers via pre-recorded videos (question delivery) and the answer provision by respondents via self-recorded videos (question answering). Our findings show that more respondents are willing to have questions read by interviewers than to provide answers via self-recorded videos. Only a small share of respondents lacks the knowledge or means for video-based web surveys. This indicates that video-based web surveys are generally feasible.
Even though our findings show that a large share of respondents is not ready for video-based web surveys, they also suggest that specific respondent groups seem to be more open than others. For example, respondents believing that technology facilitates communication and perceiving the survey as being interesting seem to be more attached to video-based web surveys. This also applies to the personality trait extraversion when it comes to self-recording answers. However, evaluating the survey topic as sensitive decreases respondents’ willingness. Relatedly, it would be worthwhile to include direct measures of respondents’ privacy concerns in future studies. Overall, these findings indicate that traditional respondent characteristics, such as age, gender, and education, are not sufficient to infer respondents’ willingness for new communication forms in web surveys. For the future of web surveys, it is key to further investigate respondents’ motivations for new communication forms, because it may help to recruit respondents that are reluctant to participate in traditional web surveys (Revilla & Höhne, 2020).
Although this study provides some new insights on contributing factors for respondents’ willingness for video-based web surveys, the main reasons for their willingness or unwillingness remain unclear. Hence, it might be worthwhile to ask respondents for their reasons by, for example, employing follow-up probes. This may shed light on the pros and cons of video-based web surveys from a respondent perspective. In order to reduce the invasiveness of self-recorded video answers respondents could also have the opportunity to turn off their camera and, for example, only provide voice recordings. Relatedly, respondents’ actual willingness (i.e., whether they would really participate in video-based web surveys) remains also open. Another limitation is the nature of the sample. In the present study, we used data from a non-probability sample with a comparatively small sample size. Our sample clearly differs from the general German population in terms of gender and education. More specifically, we have a higher share of female and highly educated respondents. In order to draw more robust conclusions and to be able to refer our findings to the general population, we recommend using data from probability-based samples instead. As shown by previous research, willingness for new communication forms may highly depend on the respective sample (see, for example, Höhne, 2023; Lenzner & Höhne, 2022; Revilla et al., 2018). We also argued that video-based web surveys may be well suited for respondents with literacy issues and low competence in the language of the web survey. However, we were not able to include direct measures of these competencies but included education as a proxy in the regression analyses (there were no significant associations). Considering our sample, we have a large proportion of highly educated respondents (approx. 80%) and thus we encourage future research to include more direct literacy measures and/or a more heterogenous sample in terms of education. Finally, in our web survey, we included a logo of the University of Duisburg-Essen including the phrase “Open Minded” (Figure A1 in the Appendix shows screenshots of the two willingness questions). We cannot preclude with certainty whether and to what extent this may have affected respondents’ willingness. Therefore, it would be worthwhile to investigate the association between logos of the responsible institution and answer behavior.
Considering the continuous increase in web surveys and the importance of video-based communication in everyday life, it is only a matter of time until these communication forms find their way into web surveys. In fact, there are already a couple of studies experimenting with video-based web surveys (see, for example, Sun et al., 2021; West et al., 2022). These web surveys have the great potential to resemble key aspects of in-person interviews, while being highly time- and cost-effective. The self-administration mode also provides respondents with a high level of flexibility that, for example, in-person (including live video) interviews cannot provide. Thus, there is no insufficient use of interviewer time. Finally, the absence of having interviewer travelling around reduces fieldwork efforts making data collection more environmentally friendly. Thus, it seems wise to start thinking about these communication forms in web surveys and how to best incorporate them.
Footnotes
Acknowledgements
Declaration of conflicting interests
The author(s) declared no potential conflicts of interest with respect to the research, authorship, and/or publication of this article.
Funding
Ethical statement
Data Availability Statement
Data including analysis code are available via Harvard Dataverse (see ![]() ).
).
Notes
Appendix
Screenshots of the two willingness questions. Note. The upper part illustrates the question on question delivery and the lower part illustrates the question on question answering. Presentation on a PC.