
Abstract
The ever-growing number of respondents completing web surveys via smartphones is paving the way for leveraging technological advances to improve respondents’ survey experience and, in turn, the quality of their answers. Smartphone surveys enable researchers to incorporate audio and voice features into web surveys, that is, having questions read aloud to respondents using pre-recorded audio files and collecting voice answers via the smartphone’s microphone. Moving from written to audio and voice communication channels might be associated with several benefits, such as humanizing the communication process between researchers and respondents. However, little is known about respondents’ willingness to undergo this change in communication channels. Replicating and extending earlier research, we examine the extent to which respondents are willing to use audio and voice channels in web surveys, the reasons for their (non)willingness, and respondent characteristics associated with (non)willingness. The results of a web survey conducted in a nonprobability online panel in Germany (N = 2146) reveal that more than 50% of respondents would be willing to have the questions read aloud (audio channel) and about 40% would also be willing to give answers via voice input (voice channel). While respondents mostly name a general openness to new technologies for their willingness, they mostly name preference for written communication for their nonwillingness. Finally, audio and voice channels in smartphone surveys appeal primarily to frequent and competent smartphone users as well as younger and tech-savvy respondents.
Keywords
Introduction
The number of respondents completing web surveys on mobile devices, particularly smartphones, has increased substantially over recent years (see Gummer, Quoß, & Roßmann, 2019; Peterson, Griffin, LaFrance, & Li, 2017; Revilla, Toninelli, Ochoa, & Loewe, 2016). For example, the smartphone rate in the probability-based German Internet Panel (GIP) increased from 4% in September 2012 (first regular GIP wave) to 37% in November 2021 (last GIP wave available). This trend has also been detected in the German Respondi online access panel (Gummer et al., 2019), in commercial and academic surveys in the US and several other countries, such as the Netherlands and Spain (Peterson et al., 2017), and in surveys of the Netquest online access panel in Argentina, Brazil, Chile, Colombia, Mexico, Portugal, and Spain (Revilla et al., 2016). Given that answering a web survey on a smartphone differs from answering it on a PC due to device characteristics, such as screen size and operation, a variety of studies have investigated how the use of different devices affects survey data quality (see, for example, Couper & Peterson, 2017; de Bruijne & Wijnant, 2013; Krebs & Höhne, 2021; Lugtig & Toepoel, 2016; Mavletova, 2013; Revilla et al., 2016; Struminskaya, Lugtig, Keusch, & Höhne, 2020; Wells, Bailey, & Link, 2014). For example, these studies have found that smartphone respondents are more likely to drop out of a survey (Callegaro, 2010; Poggio, Bosnjak, & Weyandt, 2015) and need longer to complete it (Antoun, Couper, & Conrad, 2017; Couper & Peterson, 2017; Gummer & Roßmann, 2015) than PC respondents. Consequently, survey researchers and practitioners have been advised to rethink the established survey design principles for web surveys (which were commonly based on PCs) and to consider optimizing web surveys for smartphones and other mobile devices (Antoun, Katz, Argueta, & Wang, 2018; Callegaro, 2010; de Bruijne & Wijnant, 2014; Revilla et al., 2016).
However, the increasing use of smartphones for completing web surveys does not only pose a challenge for web survey research. It also offers new opportunities to improve respondents’ survey experience and thus the quality of their answers. For instance, smartphones enable respondents to have survey questions read aloud to them using pre-recorded audio files and to answer survey questions using the voice recording feature (or microphone). Incorporating audio and voice communication channels would also humanize the communication process between researchers and respondents (Tourangeau, Rips, & Rasinski, 2000, chapter 10). It also simulates daily conversation, allowing respondents to engage in open and in-depth narrations. For example, Gavras and Höhne (2020) estimated the criterion validity of written and spoken answers to open-ended web survey questions using sentiment scores and found (somewhat) higher criterion validity for voice than for text answers.
This methodology is related to self-administered (mobile) web surveys. It is not to be confused with “Audio Computer-Assisted Self-Interviewing (ACASI)” in face-to-face surveys or “Interactive Voice Response (IVR)” in telephone surveys 1 . All respondents are exposed to the same web survey environment that includes an audio play function for reading survey questions aloud to respondents and a recording function for recording respondents’ voice answers. In general, it follows the notion of the audio and voice features of instant messaging services, such as WhatsApp and WeChat.
To date, there is only limited evidence on whether and to what extent respondents are willing to participate in web surveys with audio and voice communication channels (see Höhne, 2021; Revilla, Couper, Ochoa, 2018). The purpose of this study is to extend our current knowledge on respondents’ willingness to have questions read aloud to them (audio channel) and to record their answers via the built-in microphone of smartphones (voice channel). In addition, we ask respondents to provide reasons for their (non)willingness by employing follow-up probes and examine the association of respondent characteristics with (non)willingness.
In what follows, we review previous research on respondents’ willingness to use their smartphones’ audio and voice recording features for completing web surveys and outline our research questions. We then report on a study that examines respondents’ willingness to engage in web surveys with audio and voice communication channels. Finally, we close with a discussion of the practical implications of our study and suggest perspectives for future research.
Background and Research Questions
The majority of today’s web surveys rely on text-based communication channels. Researchers mostly ask survey questions in text form by providing a question stem and answer options (closed answer format) or text boxes (open answer format). These communication channels require respondents to read the survey questions and answer options and type in answers to open-ended questions, which can be burdensome, particularly for respondents with lower literacy or language skills (e.g., illiterates or second language learners). For instance, Grotlüschen, Buddeberg, Dutz, Heilmann, & Stammer (2019) estimated that in 2018, about 12% (or six million) of the adult population in Germany could not read and write adequately. Another 21% (or 11 million) had spelling errors even for commonly used words. In addition, the UNESCO Institute for Statistics (2017) estimates that about 14% (or 750 million) of the world population in 2016 could not read and write. Thus, people with low literacy and language skills may either not be able to participate in text-based web surveys or may provide data of lower quality (e.g., leave questions unanswered, give uninterpretable answers to open-ended questions, or give contradictory answers to a set of conceptually related items).
However, text-based communication in web surveys does not only pose a challenge for those with limited literacy and language skills. It is known from previous research that especially open-ended survey questions place a considerable burden on respondents, and thus, they are often associated with higher item nonresponse rates (Bradburn, 1978; Lambert & Miller, 2015) or very short answers (Lambert & Miller, 2015; Revilla & Ochoa, 2016). In particular, this is the case when respondents answer open-ended questions on smartphones with a virtual on-screen keyboard shrinking the viewing space of the web survey content (Lambert & Miller, 2015; Lugtig & Toepoel, 2016; Peytchev & Hill, 2010; Struminskaya et al., 2015). For instance, Lambert and Miller (2015) reported that smartphone respondents were less likely to answer open-ended questions, and when they did, they provided much shorter answers than PC respondents (i.e., the median answer length for PC respondents was almost twice as high as for smartphone respondents).
Audio and voice communication channels in web surveys are expected to be less burdensome for respondents than text-based communication channels (Tourangeau et al., 2000, chapter 10). Respondents only need to press a play button to have the questions read aloud to them (audio channel) or a recording button to provide their answers (voice channel). This methodology may be well suited for respondents with lower literacy levels or with lower competence in the language of the web survey. Particularly, the voice communication channel allows to collect “qualitative” answers in standardized web surveys. This combination of qualitative and quantitative methodologies enables researchers to gather unprecedented rich and nuanced information on respondents’ attitudes, behaviors, and beliefs by eliciting open narrations (Gavras & Höhne, 2020; Gavras et al., 2022). It also makes the communication process between researchers and respondents more natural by simulating daily conversation. Because audio and voice communication channels gain importance in everyday life (e.g., in the form of virtual assistant technology; see Struminskaya, Lugtig, Keusch, & Höhne, 2020), it seems worthwhile to investigate their usefulness and usability for web survey research as well. Following Conrad et al. (2017), giving respondents the choice to select the communication channel that is most suitable for them may enhance survey data quality (see also Miller (2017) for a comprehensive discussion of the future of surveys).
Although the use of audio and voice communication channels in (mobile) web surveys might be associated with several benefits, little research has been conducted on whether respondents are willing to take part in such web surveys. To the best of our knowledge, only two studies have been published on this subject to date (see Höhne, 2021; Revilla et al., 2018). In the first study, Revilla et al. (2018) asked respondents of the Netquest online access panel in Spain whether they would be willing to use the voice input function of their smartphone to provide voice answers to open-ended questions in web surveys. More than 50% of the participating respondents indicated that they would be willing to give voice answers to open-ended questions. In addition, the authors examined what respondent characteristics are associated with the willingness to use the voice input function. Willingness was higher among respondents who already used voice input in everyday life, used their smartphone more frequently, were native Spanish speakers, and reported no difficulties in answering the current survey. Interestingly, these two latter findings suggest that the voice input is not necessarily perceived as helpful by respondents who are supposed to benefit most from this methodology (e.g., second language learners and respondents experiencing difficulties in survey responding). Instead, voice input in smartphone surveys seems to attract frequent and competent smartphone users.
Extending the research by Revilla et al. (2018), Höhne (2021) also examined respondents’ willingness to use audio communication channels in web surveys. Specifically, the author first asked about respondents’ willingness to participate in future surveys via their smartphone to have the questions read aloud to them and then about respondents’ willingness to participate in future surveys via their smartphone to provide voice answers. However, in contrast to Revilla et al. (2018), he asked whether respondents would use both communication channels for answering survey questions in general and not specifically for answering open-ended questions. Using data from the probability-based German Internet Panel, he found a considerably lower willingness for voice input than Revilla et al. (2018). About 25% of the respondents indicated that they would agree with an audio channel, and only about 16% indicated that they would agree with a voice channel. Similar to Revilla et al. (2018), Höhne (2021) found that respondents’ willingness to engage in web surveys with audio and voice communication channels, respectively, was higher among respondents using a smartphone for web survey completion and more frequent and competent Internet users. Moreover, younger and male respondents, as well as respondents with higher extraversion and agreeableness, were more willing. According to the author, these findings indicate that most respondents seem not yet ready for audio and voice communication channels. However, both channels might be appealing to some respondent groups, such as millennials (born between 1982 and 2003; Strauss & Howe, 1991), who are more reluctant to participate in traditional web surveys (see also Revilla & Höhne, 2020).
While both of these earlier studies provide insights on the extent to which respondents drawn from different samples in different countries are willing to engage in web surveys with audio and voice communication channels and on contributing respondent characteristics, the reasons for respondents’ (non)willingness remain completely unclear. With the current study, we aim at filling this research gap by replicating and extending the earlier studies by Revilla et al. (2018) and Höhne (2021). For this purpose, we conducted a cross-sectional web survey (no device limitation) in a nonprobability online panel in Germany (N = 2146). We address the following three research questions: 1. What is the share of respondents who are willing to participate in web surveys with a smartphone to have the survey questions read aloud to them and to give voice answers? 2. What are the reasons for respondents’ (non)willingness to participate in web surveys with a smartphone to have the survey questions read aloud to them and to give voice answers? 3. What respondent characteristics are associated with respondents’ (non)willingness to participate in web surveys with a smartphone to have the survey questions read aloud to them and give voice answers?
Method
Data Collection and Sample
We conducted a web survey in the Respondi online access panel (respondi.com) in Germany in November and December 2020. The current study was part of a larger study with several unrelated experiments that were independently randomized to reduce the possibility of systematic carryover effects. Overall, participation in the web survey took about 15 minutes. The questions analyzed in this study were placed in the fourth quarter of the web survey.
To draw a sample that is representative of the German adult online population, we used cross-quotas for gender (female and male) and age (18–29 years, 30–39 years, 40–49 years, 50–59 years, and 60 years and older). Of the 4994 respondents starting the web survey, 301 were screened out because of full quotas. Another 2248 respondents were randomly routed to a different web survey that did not include our questions, and 299 broke off before receiving the questions analyzed in this study. This leaves us with 2146 respondents for statistical analysis.
These respondents were between 18 and 83 years old with a mean age of 44.6 (SD = 14.8), and 49.3% were female. 2 In terms of education, 16.8% had graduated from a lower secondary school (low education level), 27.1% from an intermediate secondary school (medium education level), and 55.0% from a college preparatory secondary school (high education level). Furthermore, 0.8% still attended school or had finished without a diploma, and 0.3% did not report their highest level of education.
Questions
We used the same two questions as Höhne (2021) on respondents’ willingness to participate in future web surveys with a smartphone to use audio and voice communication channels. Each question (Q1 and Q2) was followed by an open-ended probing question (P1 and P2) asking respondents to provide reasons for their (non)willingness. The questions and probes were formulated as follows:
In general, are you willing to participate in upcoming surveys with your smartphone to have the questions read out loud to you?
The previous question asked whether you would generally be willing to participate in future surveys using your smartphone to have the questions read out loud to you.
Your answer was: “[respondent’s answer]”
Please elaborate on your answer. Why did you choose this answer?
In general, are you willing to participate in upcoming surveys with your smartphone to give oral answers via voice input?
The previous question asked whether you would generally be willing to participate in future surveys using your smartphone to give oral answers via voice input.
Your answer was: “[respondent’s answer]”
Please elaborate on your answer. Why did you choose this answer? The questions and probes were presented on separate web survey pages (single question presentation). Q1 and Q2 offered the following vertically aligned answer options: “Definitely yes,” “Probably yes,” “Probably no,” “Definitely no,” “Don’t use a smartphone,” and “Don’t know how it works.” A space visually separated the last two options from the remaining options (see Appendix A for screenshots of the questions and probes) and respondents who selected one of these options did not receive the open-ended probes.
Analytical Strategies
Regarding our first and third research questions, we follow the analytical strategies used by Höhne (2021) and Revilla et al. (2018). Thereby, we aim at increasing the comparability of the results. Data preparations and analyses were conducted with SPSS version 24 (RQ1 and RQ3) and Microsoft Excel 365 (RQ2). To examine our first research question, we look at the answer distributions (in percentages) of the two questions on respondents’ willingness to participate in web surveys with a smartphone to have the survey questions read aloud to them and to give voice answers.
To analyze the reasons for respondents’ (non)willingness (second research question), respondents’ answers to the two open-ended probing questions were coded by the first author based on two initial coding schemes, including four willingness and seven nonwillingness categories, respectively. Both coding schemes were gradually expanded during the coding and finally consisted of 10 (audio willingness) and 12 (audio nonwillingness) categories as well as 10 (voice willingness) and 14 (voice nonwillingness) categories, respectively. Using these final coding schemes, a student assistant independently coded a randomly selected subset of 10% (n = 407) of the answers to the probes so that we could estimate inter-coder reliability. The subset size of probe answers and number of judges were initially chosen for time and budget constraints. An agreement of 81% among the two coders and a Cohen’s kappa value of 0.80 indicate that the number of coders was adequate (see Nunnally (1978) and Rust and Cooil (1994) for a comprehensive discussion on minimally acceptable levels of inter-rater agreement and appropriate numbers of judges). Discrepancies between the two ratings were discussed between the two coders until they reached a consensus. The reasons for respondents’ (non)willingness are reported in percentages.
To answer our third research question, we examine independent variables associated with respondents’ willingness for audio and voice channels (coding of dependent variables: 1 “definitely no,” 2 “probably no,” 3 “probably yes,” and 4 “definitely yes”) by running two separate ordinary least squares (OLS) regressions. The (non-substantive) answer options “don’t use a smartphone” and “don’t know how it works” are excluded from the regression analyses. We use the following independent variables that were suggested by prior studies to be associated with respondent behavior (Höhne, 2021; Revilla et al., 2018; van Vaerenbergh & Thomas, 2013): smartphone use in this survey (1 = “yes”), smartphone competence (1 = “low” to 5 = “high”), general Internet use (1 = “low” to 6 = “high”), Internet use via smartphone (1 = “yes”), belief that Internet facilitates communication (1 = “low” to 5 = “high”), affinity for technology (1 = “low” to 5 = “high”), survey evaluation: difficulty (1 = “low” to 5 = “high”), survey evaluation: enjoyment (1 = “low” to 5 = “high”), survey evaluation: length (1 = “low” to 5 = “high”), survey evaluation: topic sensitivity (1 = “low” to 5 = “high”), and need for cognition (1 = “low” to 7 = “high”). 3 In addition, we control for the following socio-demographic variables: age (in years), female (1 = “yes”), and education with low as reference: medium (1 = “yes”) and high (1 = “yes”). English translations of the independent and control variables are documented in Appendix B.
Results
Research Question 1
Respondents’ Willingness to Participate With Their Smartphone in Surveys to Have the Survey Questions Read Aloud to Them and to Give Voice Answers Via Voice Input.
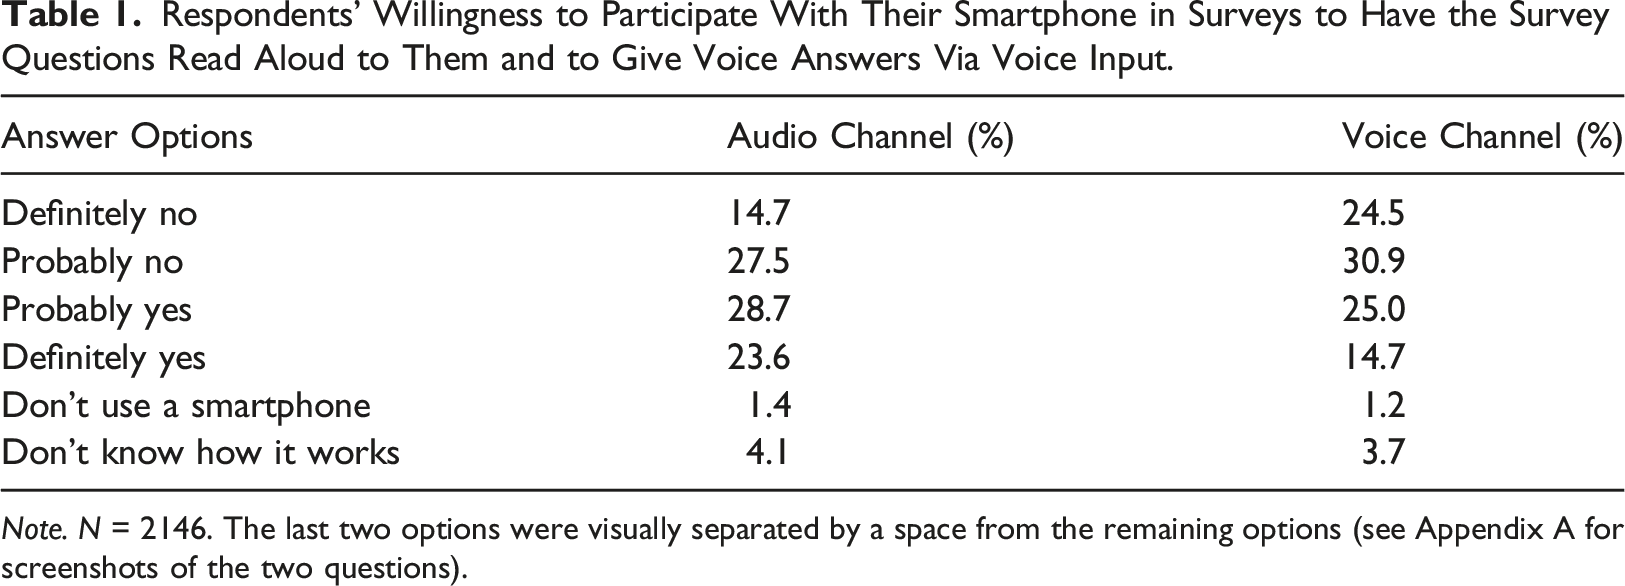
Note. N = 2146. The last two options were visually separated by a space from the remaining options (see Appendix A for screenshots of the two questions).
Research Question 2
Reasons for Willingness to Use the Audio and Voice Channels in Upcoming Surveys.
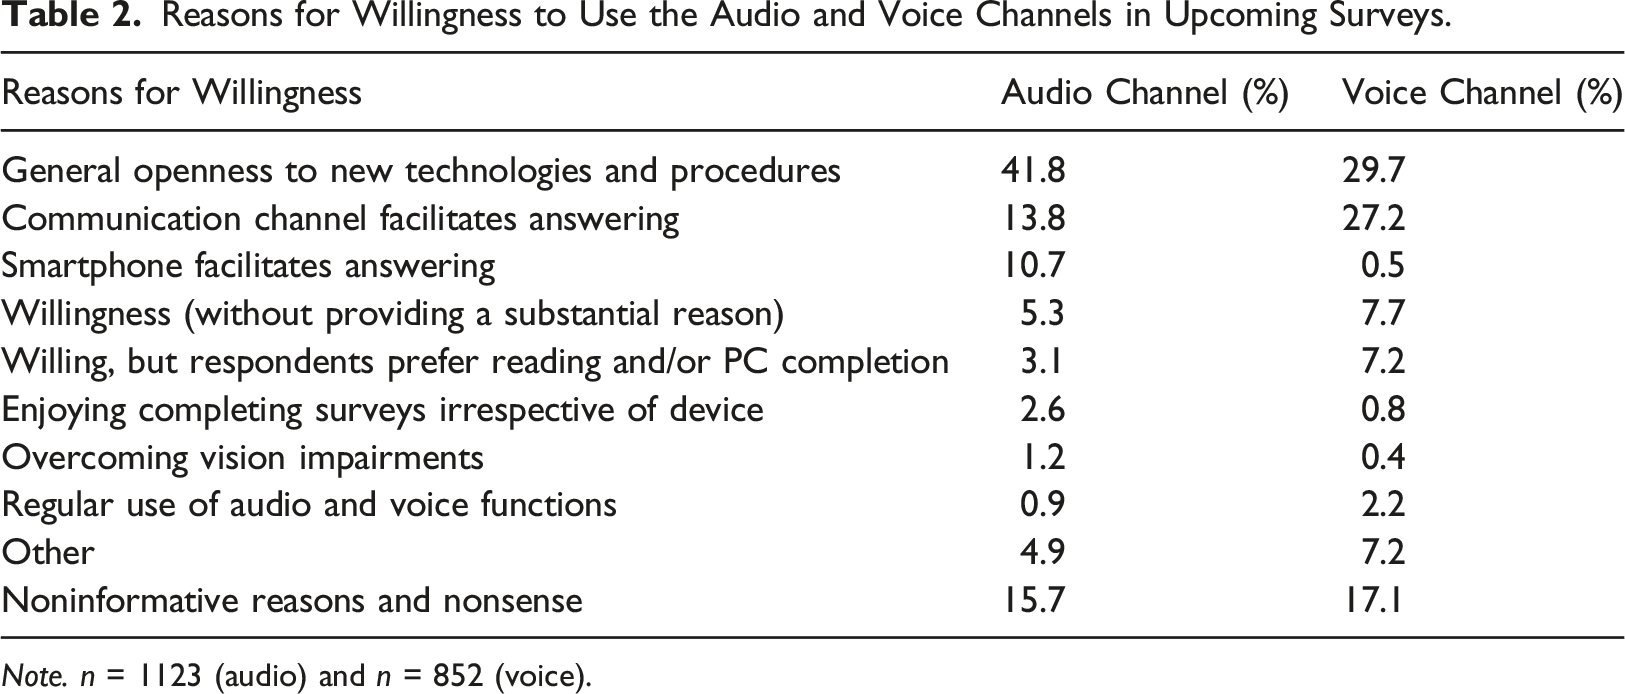
Note. n = 1123 (audio) and n = 852 (voice).
Reasons for Nonwillingness to Use the Audio and Voice Channels in Upcoming Surveys.
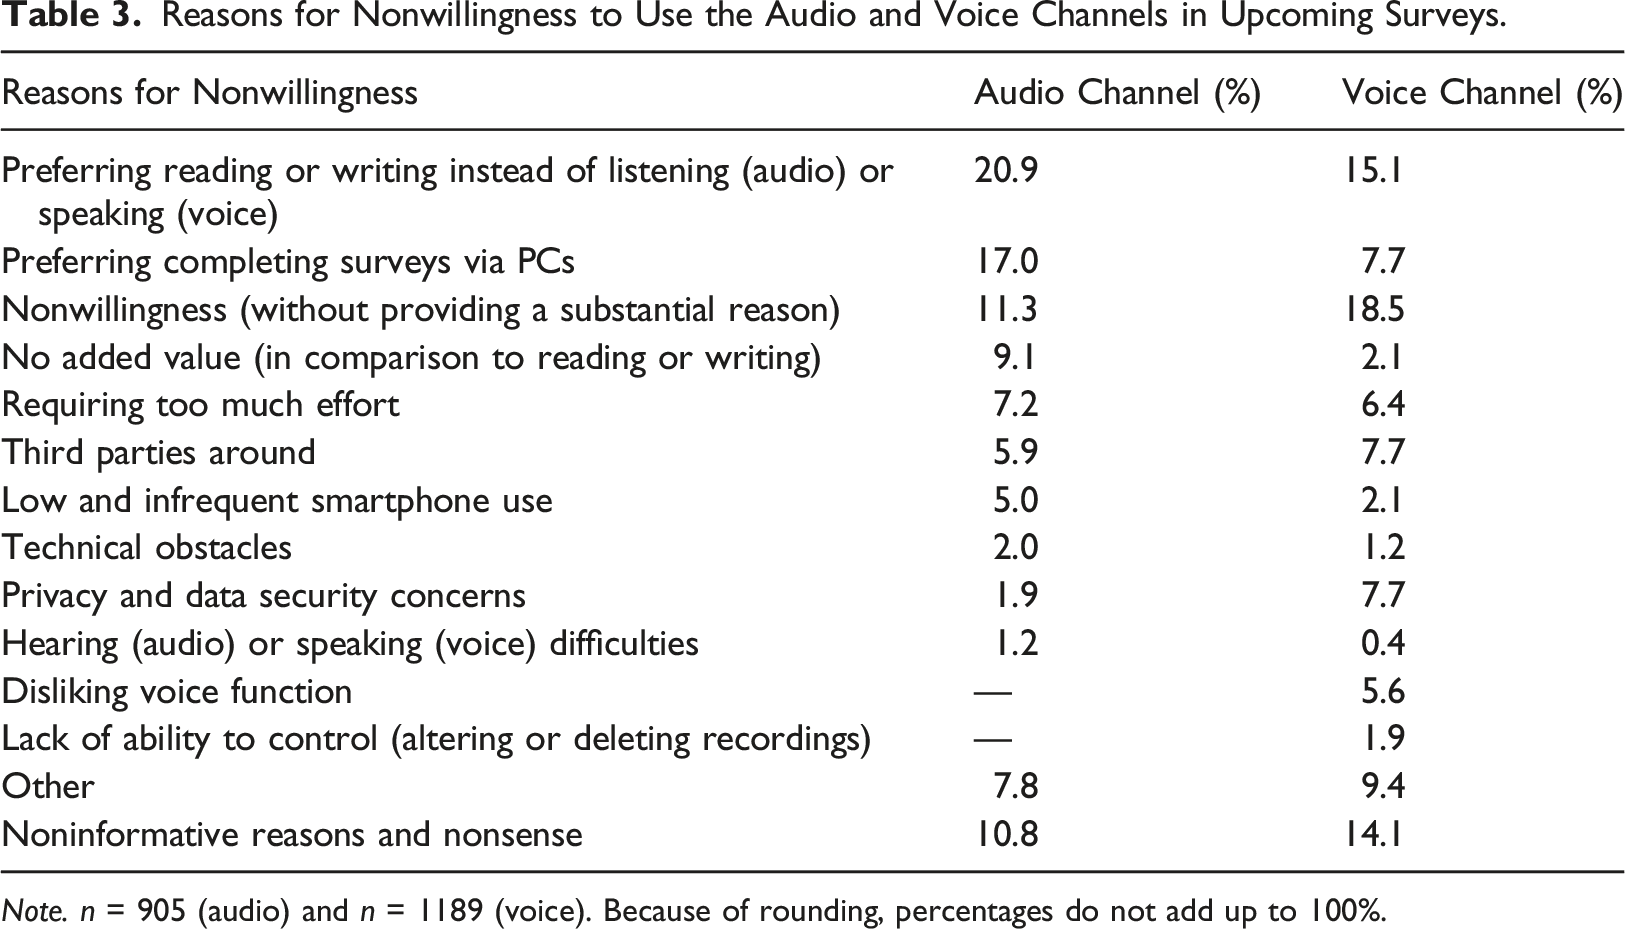
Note. n = 905 (audio) and n = 1189 (voice). Because of rounding, percentages do not add up to 100%.
Similar to the audio channel, the most frequently mentioned reasons for willingness to use the voice channel were a general openness to new technologies and procedures (29.7%) and the impression that this communication channel facilitates answering web surveys (27.2%). About 8% of the respondents indicated their willingness without providing a substantial reason (e.g., “No problem” and “Would be ok”), and about 7% indicated that they were willing but prefer answering on a PC. Reasons mentioned by less than 5% of the respondents included regular use of voice functions, enjoying completing surveys irrespective of the device, the impression that a smartphone facilitates answering surveys, and overcoming vision impairments. Finally, about one quarter (24.3%) provided other reasons (e.g., “I would like to contribute to research” and “I can be bought, for money I will also speak into the microphone”) or noninformative reasons and nonsense (e.g., “Self-explanatory” and “hmmm”).
With respect to respondents who indicated that they were not willing to use the audio channel, more than one fifth (20.9%) preferred reading instead of listening and almost one fifth (17.0%) preferred completing surveys on a PC. Another 11% indicated their nonwillingness without providing a substantial reason (e.g., “I just don’t want to” and “Not interested”), and 9% questioned the added value of the audio channel in comparison to traditional communication channels. Some respondents indicated too much effort (about 7%), concerns about third parties being around or being bothered by completing the survey in this way (about 6%), and low or infrequent smartphone use (5%). Again, several reasons were mentioned by less than 5% of the respondents: technical obstacles, privacy and data security concerns, and hearing difficulties. Finally, about 20% provided other reasons (e.g., “My smartphone is a company phone” and “In order to be able to carry out the survey, an app is probably required, which I do not want to download”) or noninformative reasons and nonsense (e.g., “xxx” and “Because”).
Among respondents who indicated that they were not willing to use the voice channel, the largest share did not provide a substantial reason for their nonwillingness (18.5%). This is followed by a preference for writing instead of speaking (15.1%). Preferring completing surveys via PC, privacy and data security concerns, and concerns about third parties were mentioned by about 8% of the respondents, respectively. The next most frequently cited reasons were too much effort (about 6%) and disliking the voice recording function (about 6%). Reasons mentioned by less than 5% of respondents included low and infrequent smartphone use, the impression that the voice channel would not add any value compared to traditional communication channels, and lack of ability to control the voice answers. Again, about one quarter (23.5%) provided other reasons (e.g., “I’d feel stupid doing that” and “That sounds strange”) or noninformative reasons and nonsense (e.g., “Don’t know” and “Several reasons”).
Research Question 3
Finally, we investigated variables associated with respondents’ willingness for audio and voice channels (coding of the dependent variables: 1 “definitely no,” 2 “probably no,” 3 “probably yes,” and 4 “definitely yes,” respectively) by running two separate OLS regressions. We used several independent variables suggested by previous research to impact respondent behavior (Höhne, 2021; Revilla et al., 2018; van Vaerenbergh & Thomas, 2013). We did not exclude respondents who provided noninformative or nonsensical answers to the open-ended probes about their (non)willingness to use both channels, as we found no obvious signs that they engaged little with the survey other than providing low-quality answers to these open-ended questions. As a sensitivity check, we re-ran the regressions excluding these respondents. The results were similar to the ones we obtained using the full sample and none of our main conclusions changed. Hence, we decided to report the results for the full sample.
Standardized OLS Regression Coefficients of Independent Variables on Respondents’ Willingness to Participate in Surveys With Audio and Voice Communication Channels.
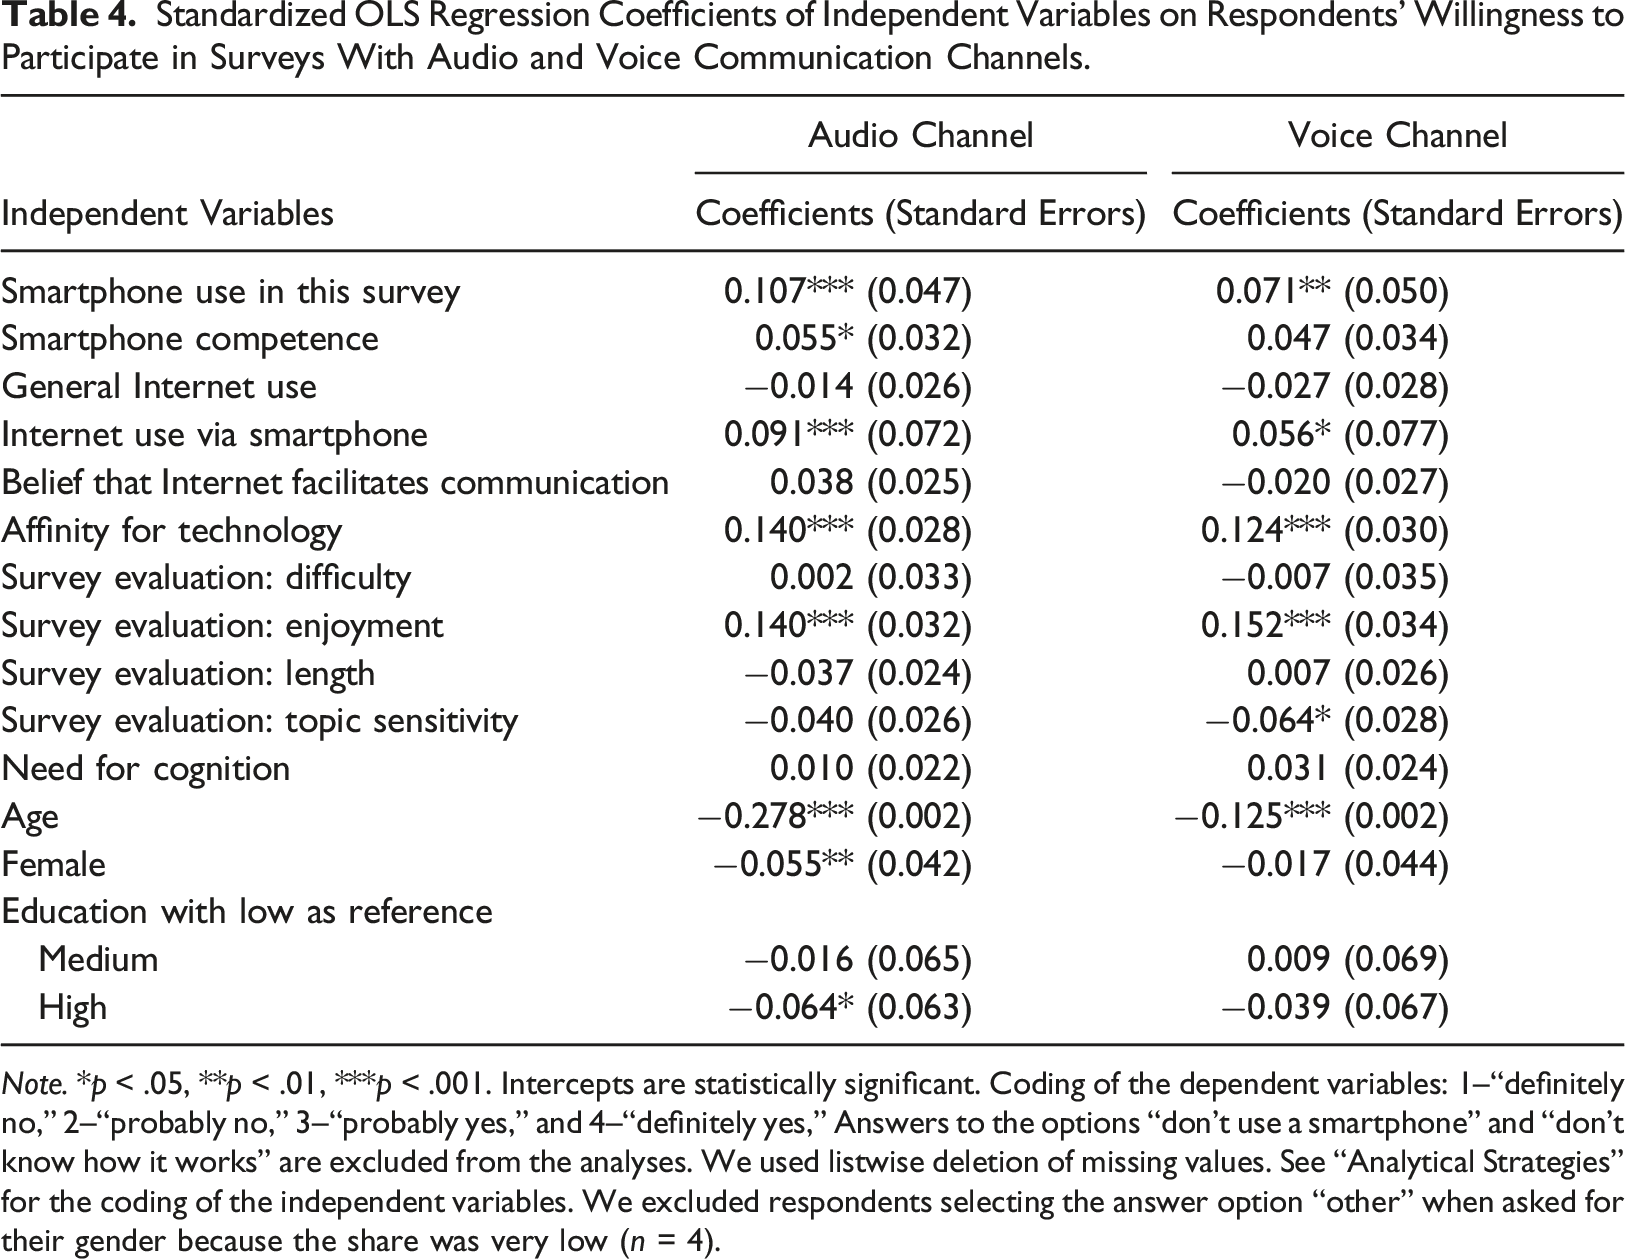
Note. *p < .05, **p < .01, ***p < .001. Intercepts are statistically significant. Coding of the dependent variables: 1–“definitely no,” 2–“probably no,” 3–“probably yes,” and 4–“definitely yes,” Answers to the options “don’t use a smartphone” and “don’t know how it works” are excluded from the analyses. We used listwise deletion of missing values. See “Analytical Strategies” for the coding of the independent variables. We excluded respondents selecting the answer option “other” when asked for their gender because the share was very low (n = 4).
Discussion and Conclusion
Replicating and extending earlier research by Höhne (2021) and Revilla et al. (2018), this study examined respondents’ (non)willingness to engage in web surveys using audio and voice communication channels. In addition, we looked at respondents’ reasons for (non)willingness and contributing respondent characteristics. Our results showed that more than 50% of respondents would be willing to have the questions read aloud (audio channel) and about 40% of respondents would also be willing to give answers via voice input (voice channel). These figures are considerably higher than those reported by Höhne (2021), who found a willingness for the audio channel of 25% and a willingness for the voice channel of 16%. However, our figures for the voice channel are similar to those reported by Revilla et al. (2018), who found a willingness of 54%.
In his article, Höhne (2021) argued that the differences between his results and the results reported by Revilla et al. (2018) might be due to the following reasons. First, the surveys were conducted in different countries (Germany vs. Spain). Second, the surveys were conducted in different panels (probability vs. nonprobability panel). Third, the two samples were characterized by different age structures; respondents in the study by Revilla et al. (2018) were younger than those in the study by Höhne (2021). Because the current study and the study by Höhne (2021) were conducted in Germany, national or cultural differences can be ruled out as an explanation for the differences in the magnitude of willingness. Also, taking a closer look at the age structure in our study and in the study by Höhne (2021), we only find minor support for the third explanation. The median age category in our study is “41 to 45” years, compared to “51 to 55” years in the study by Höhne (2021). Instead, our results rather support the second explanation, namely, that willingness to use audio and voice channels is higher among members of nonprobability online panels than among members of probability-based panels. Members of nonprobability online panels, most frequently, voluntarily sign up online for the panels themselves, while members of probability-based online panels are usually recruited offline (see Blom et al., 2015). Thus, it is not surprising that the first are more open to Internet-based technological innovations than the latter.
With respect to the reasons for respondents’ (non)willingness, we found relatively similar patterns for both communication channels. The most frequently mentioned reasons for willingness to use this technology were a general openness to new technologies and the impression that these communication channels facilitate answering web surveys. These two reasons accounted for more than 55% of the reasons provided by respondents. Interestingly, the second reason (i.e., communication channel facilitates answering) was mentioned about twice as often for voice than for audio channels. This indicates that respondents perceive the voice channel as much more facilitating than the audio channel.
Respondents who expressed their nonwillingness to use one or both communication channels mostly argued that they prefer written communication (i.e., reading and writing instead of listening and speaking) and completing surveys on PCs instead of smartphones. Some respondents also questioned the added value of this new technology in comparison to traditional web survey interaction. This particularly applies to having the questions read aloud to them (audio channel). Potentially, these respondents could be convinced to participate in web surveys with audio and voice channels if they are provided with a sound explanation of the usefulness. In contrast, conversion attempts might be less successful among respondents concerned about third parties and privacy and data security. However, these reasons were mentioned comparatively rarely and only in relation to the voice channel with a relevant frequency.
Regarding respondent characteristics associated with respondents’ willingness to participate in web surveys with audio and voice channels, our findings largely overlap with those reported by Höhne (2021) and Revilla et al. (2018). Similar to these earlier studies, we found higher willingness for those participating in the current study with a smartphone and more frequent and competent Internet users. Moreover, an affinity for technology and enjoying participation in the current survey correlated positively with willingness, while age was negatively associated with willingness to use audio and voice channels. Taken together, these findings suggest that audio and voice channels in smartphone surveys appeal primarily to frequent and competent smartphone users as well as younger and tech-savvy respondents. Finally, perceiving the topics of the web survey sensitive decreased respondents’ willingness to use the voice channel. This finding can be explained by the fact that the voice channel (partially) mimics interviewer-administered survey modes, in which respondents are less willing to answer sensitive questions than in self-administered modes (see Tourangeau and Yan (2007) for a comprehensive review of research on sensitive questions in surveys). Employing sensitive open-ended questions with requests for voice answers might be critical because of social desirability. However, this is only an assumption that needs to be investigated empirically. We therefore recommend that future studies examine the proneness of voice answers to socially desirable answer behavior when it comes to sensitive question topics.
Three limitations to this study provide avenues for future research. First, we only asked respondents for their hypothetical willingness and did not examine their actual compliance when presented with audio and voice communication channels. Future research should investigate whether the response rates of smartphone surveys with audio and voice channels are indeed as high as suggested by respondents’ alleged willingness. For instance, these studies could build on existing theories, such as the Technology Acceptance Model (Davis, 1989), to draw more theoretically driven conclusions. Second, we conducted our survey among members of an online access panel, and thus, we cannot infer to the general population. For instance, as shown by Höhne (2021), willingness among the general population might be considerably lower than reported for our sample. If members of probability-based online panels are indeed more reluctant to use this technology than members of nonprobability online access panels, then researchers and practitioners would have to weigh the (possible) benefits of collecting richer and more nuanced data (by employing the audio and voice channels in nonprobability web surveys) against the possibility of inferring from the sample to the general population. Therefore, it is important that future research examines differences in the willingness of respondents from nonprobability and probability-based online panels. Third, we argued that audio and voice channels in smartphone surveys may be particularly well suited for respondents with lower literacy levels and with lower competence in the language of the web survey. However, we were not able to include measures of these competencies in the web survey. Therefore, we encourage future research to examine this issue more thoroughly.
As more and more respondents participate in web surveys via smartphones and audio and voice communication channels become increasingly important in everyday life, it seems to be only a matter of time before these communication channels also find their way into web surveys. Some age cohorts, such as millennials, are already quite familiar with these means of communication options (see Bosch, Revilla, & Paura, 2019). In addition, it is likely that other age cohorts follow and adapt their behavior to the new technologies and communication options. From a data analysis perspective, powerful data processing and analysis capabilities, such as Automatic Speech Recognition, Natural Language Processing, and Text-as-Data Methods, enable proper handling of audio and voice data (even from large-scale web surveys). Thus, it seems wise to begin examining the benefits and limitations of these communication channels in web surveys and deriving best practices for their implementation.
Acknowledgements
The authors would like to thank Patricia Steins (GESIS) for her support in coding the respondents' answers to the open-ended probes.
Declaration of Conflicting Interest
The author(s) declared no potential conflicts of interest with respect to the research, authorship, and/or publication of this article.
Footnotes
Funding
The author(s) disclosed receipt of the following financial support for the research, authorship, and/or publication of this article: This work was funded by the Deutsche Forschungsgemeinschaft (DFG, German Research Foundation) – Project number 491156185
Notes
Screenshots of the Questions and Probes on Reasons for (Non) willingness
Screenshot of the question on audio channel (presentation on a PC).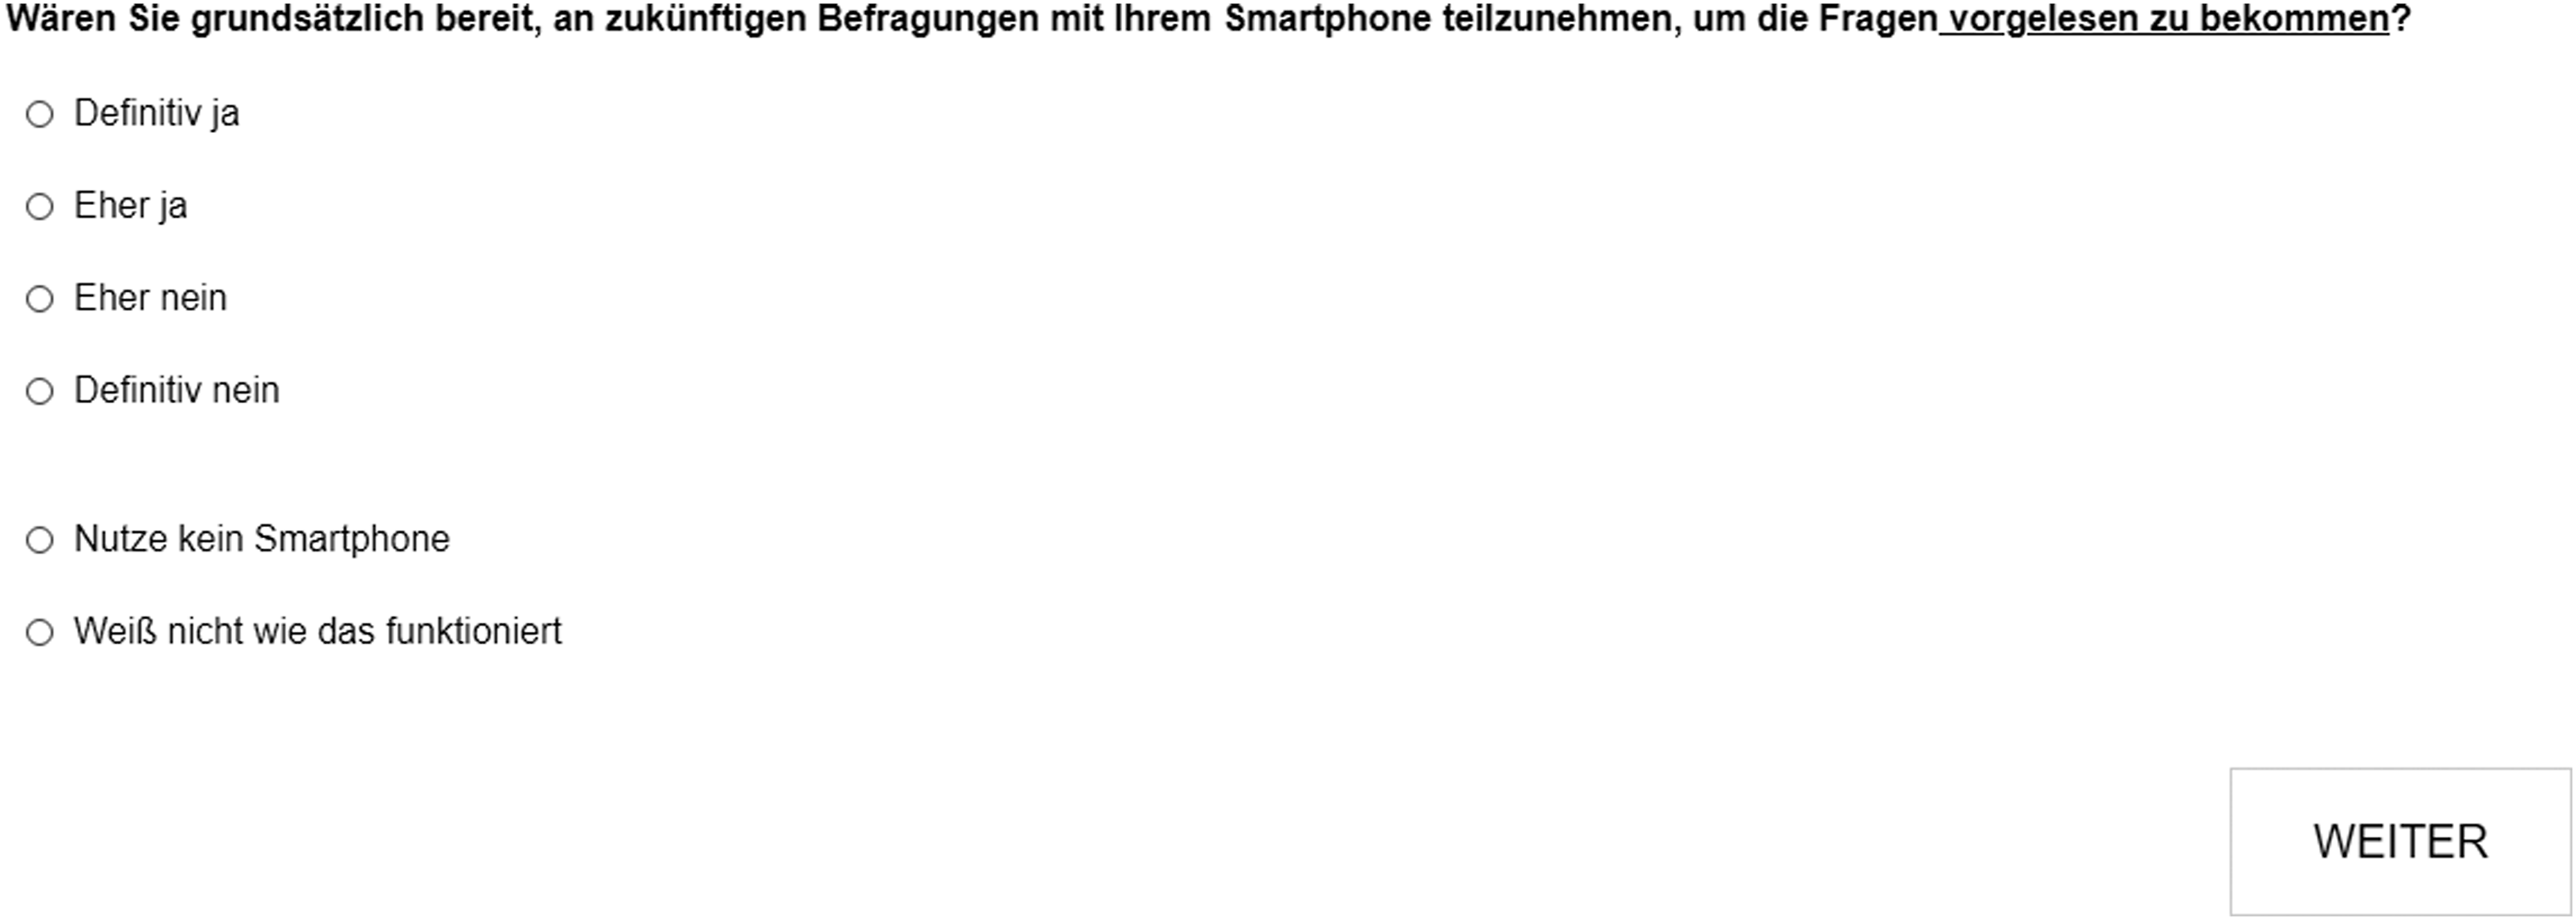
Screenshot of the probe on reasons for (non)willingness to use the audio channel (presentation on a PC).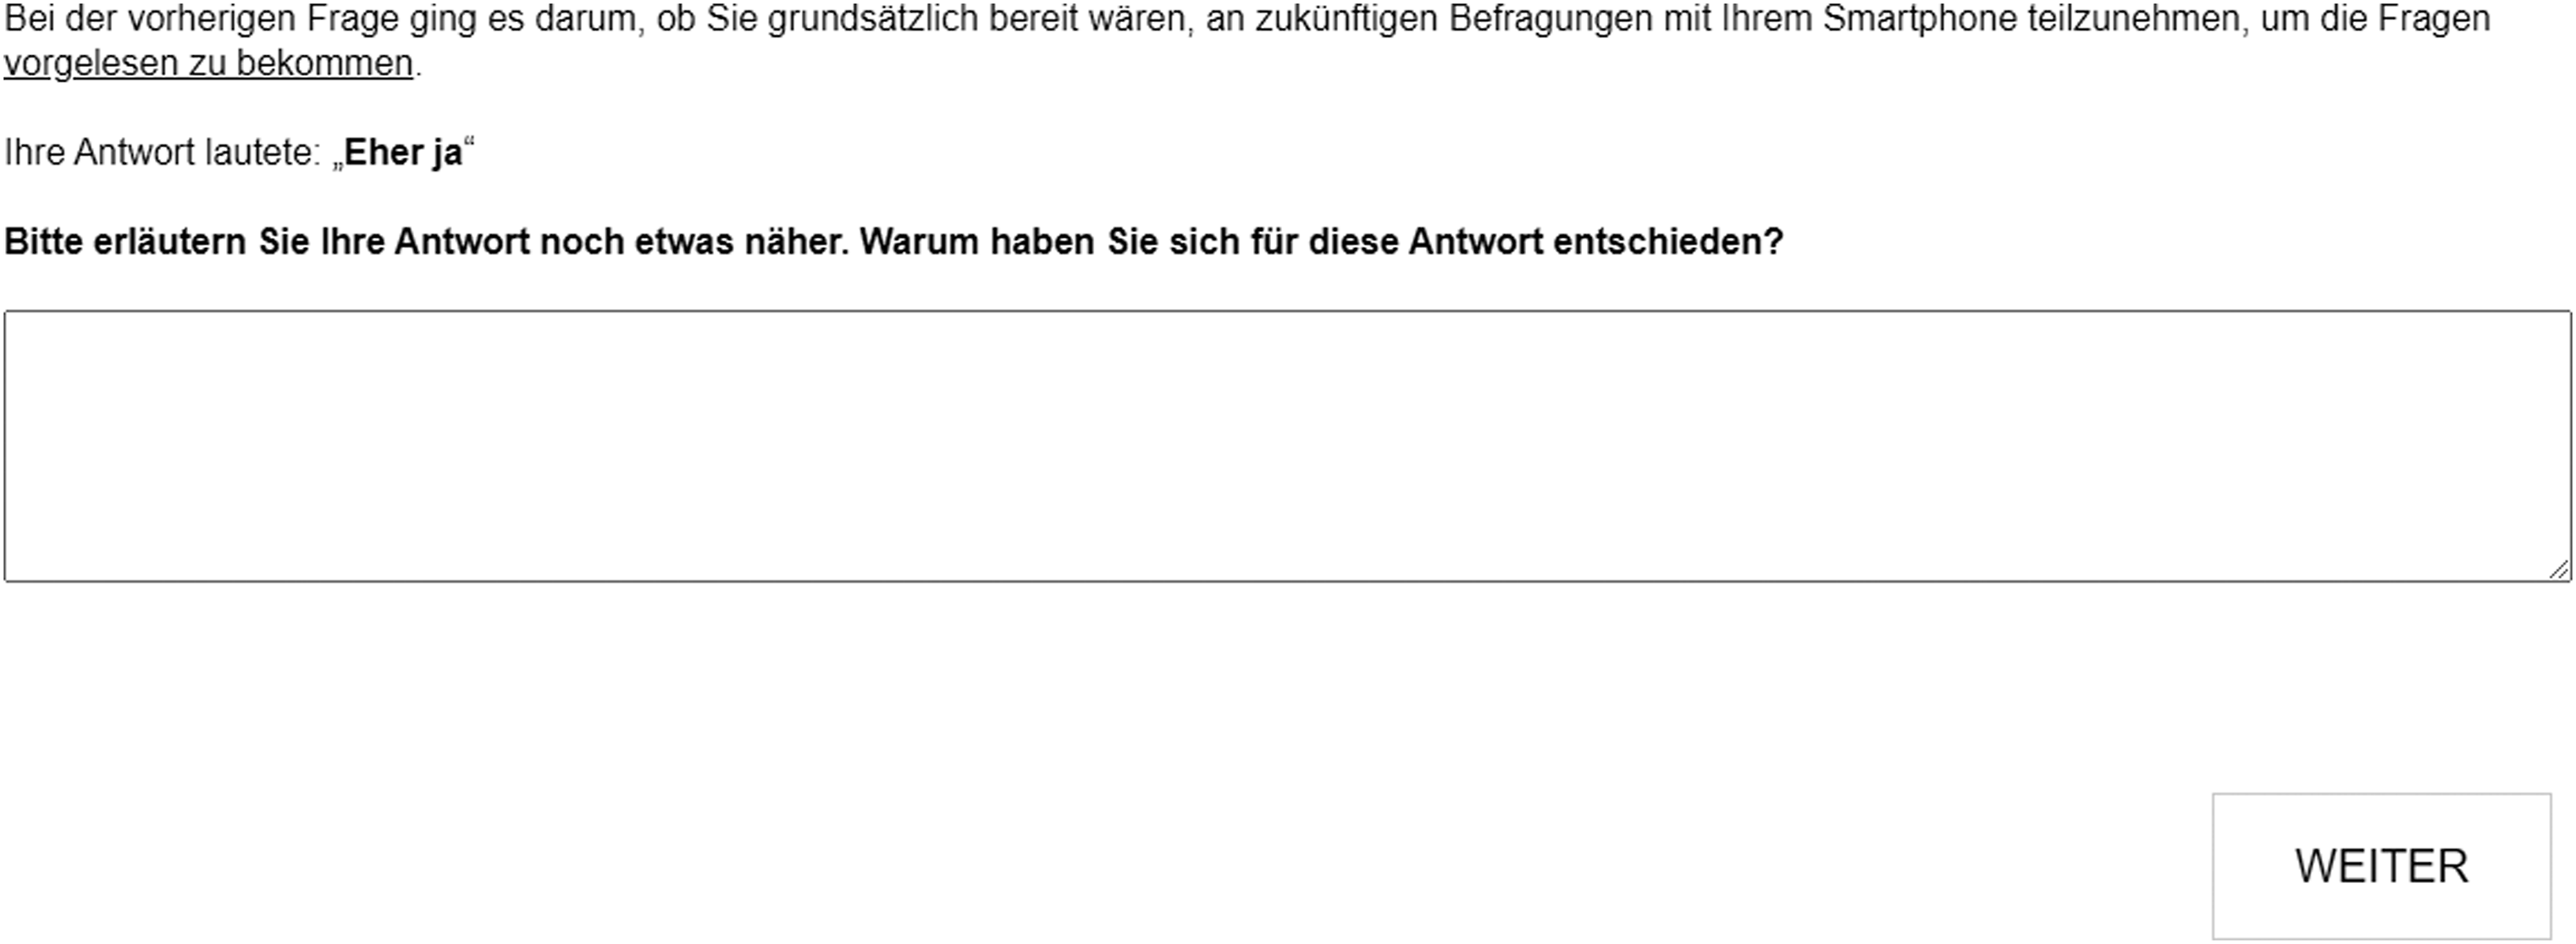
Screenshot of the question on voice channel (presentation on a PC).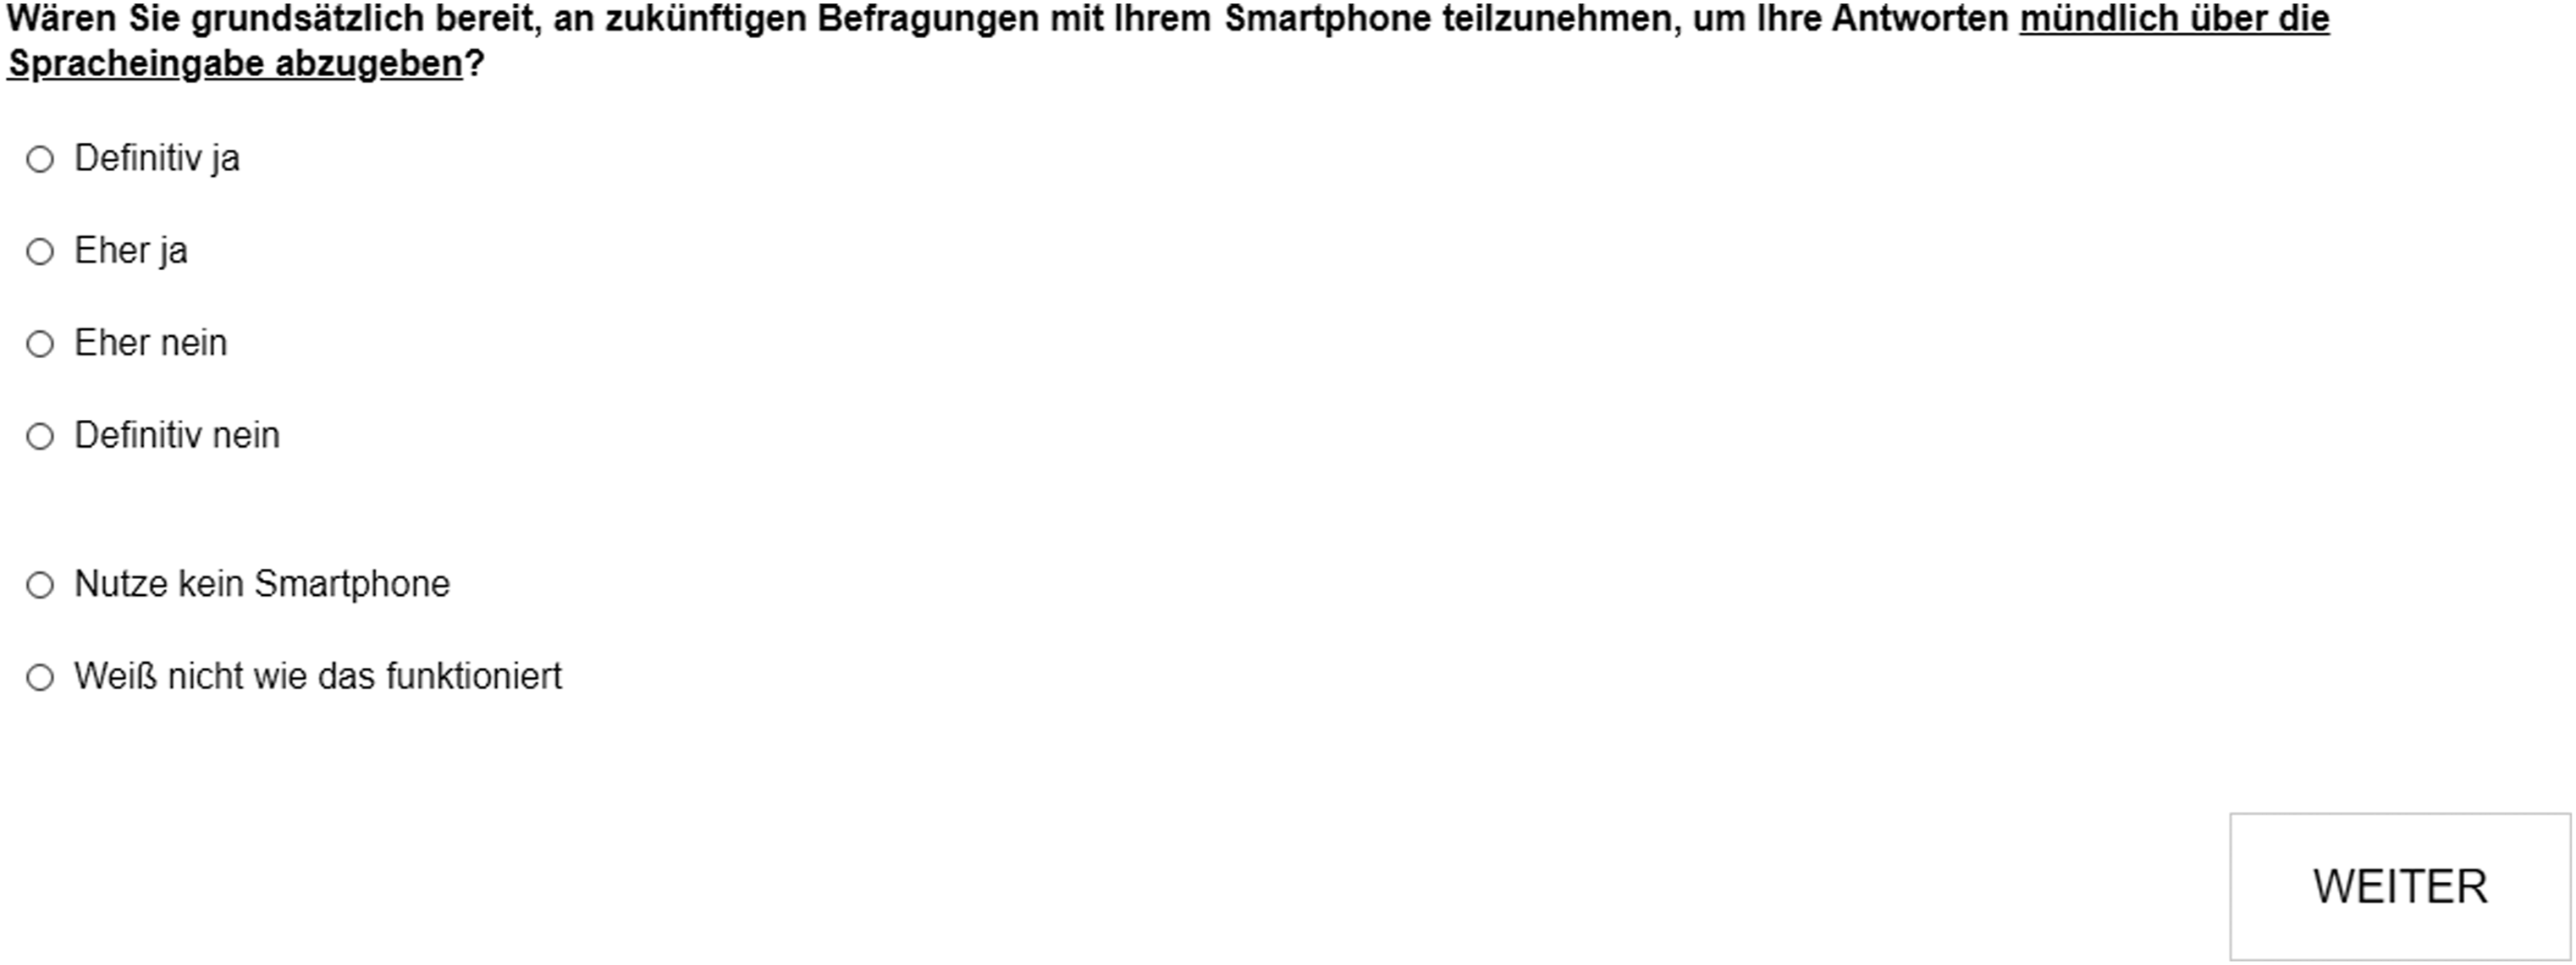
Screenshot of the probe on reasons for (non)willingness to use the voice channel (presentation on a PC).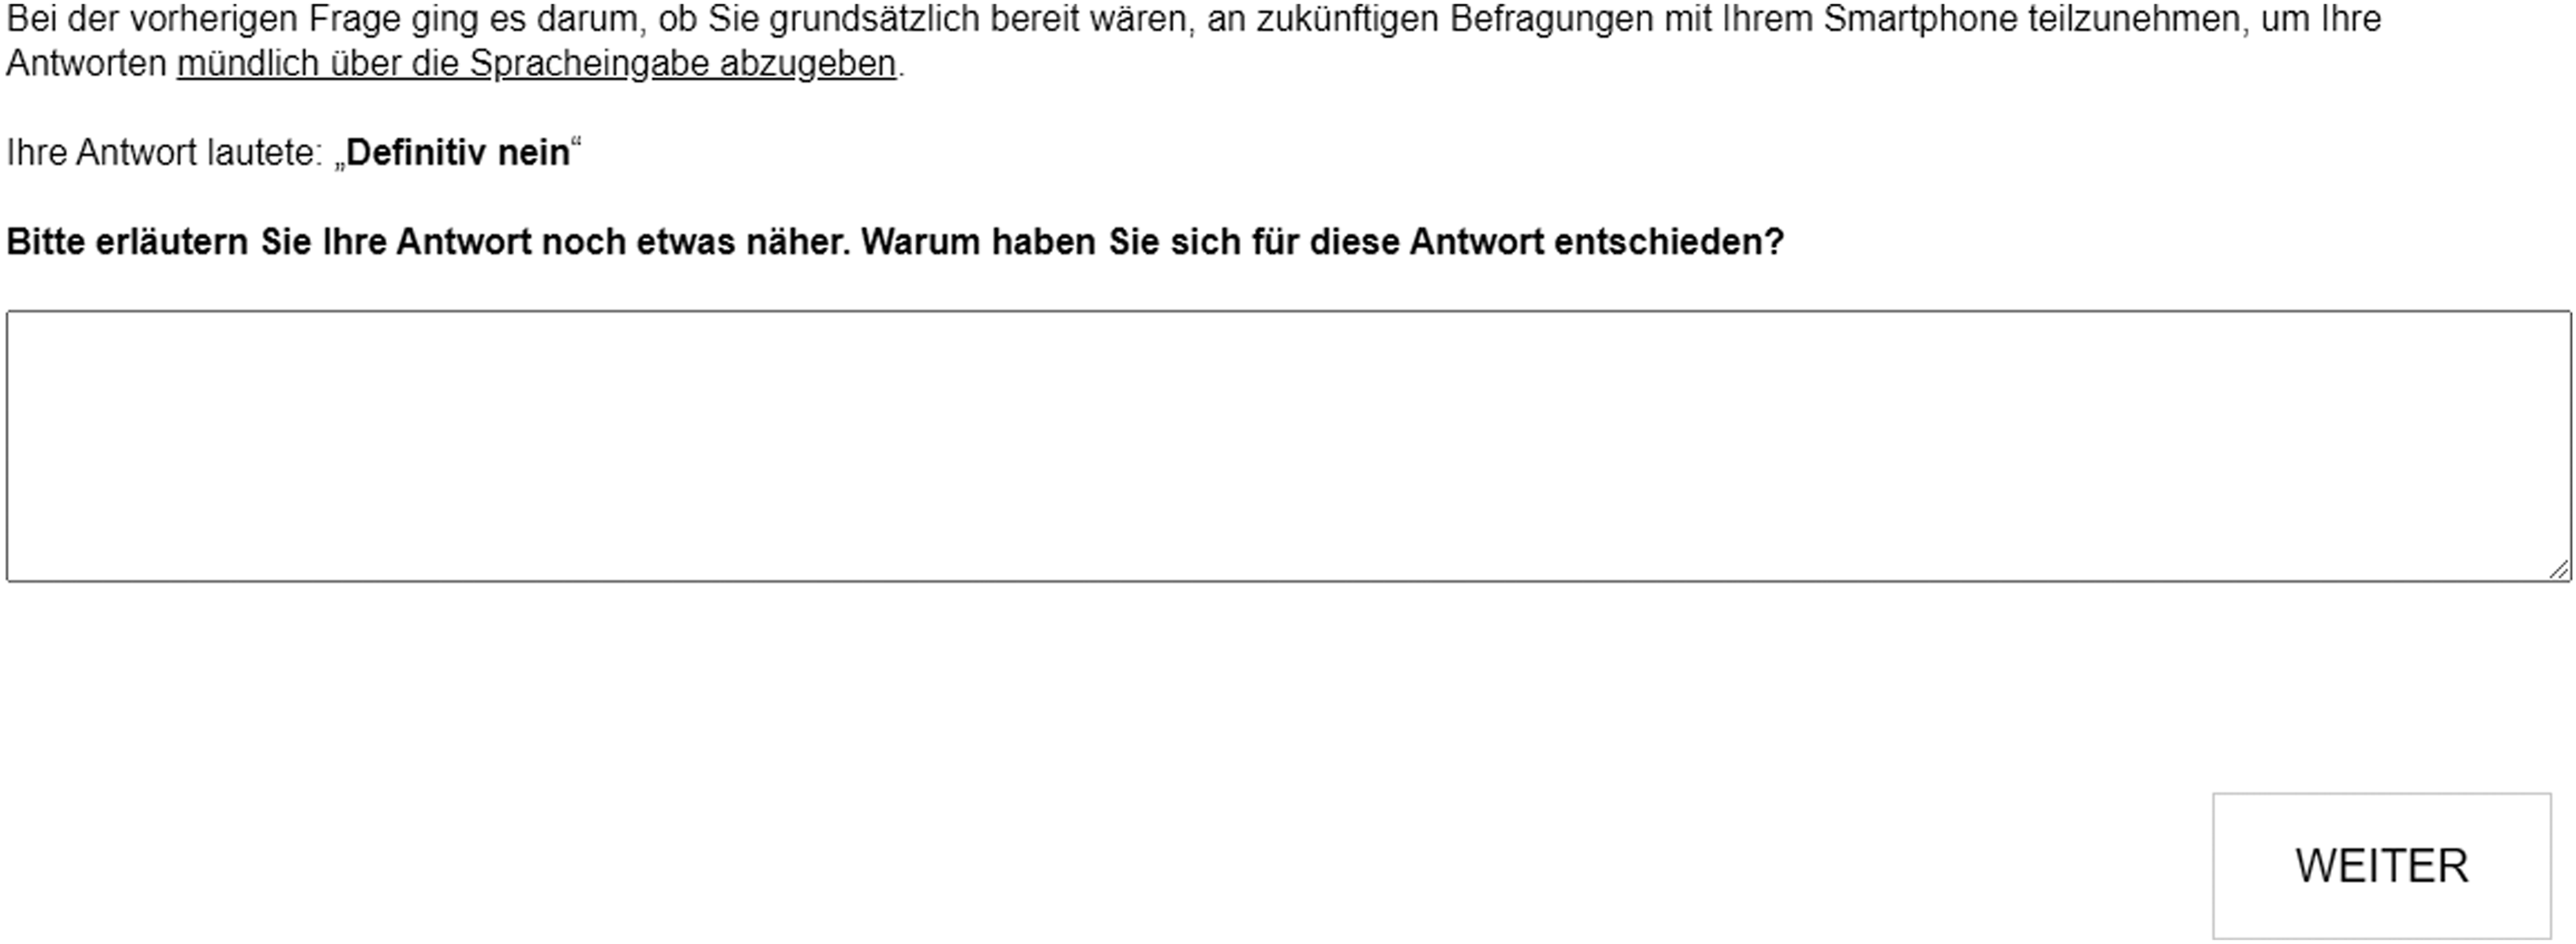
English Translations of the Independent and Control Variables
Smartphone Use in This Survey: Determined via Paradata.
Smartphone competence: In general, how would you rate your ability to use smartphones? Answer options: (1) very bad, (2) bad, (3) moderate, (4) good, and (5) very good.
General Internet use: How often do you use the Internet, the World Wide Web, or email for private purposes whether at home, at work, or elsewhere? Answer options: (1) more than 2 hours a day, (2) one to 2 hours a day, (3) less than 1 hour a day, (4) several times a week, (5) once a week, and (6) once a month or less.
Internet use via smartphone: Did you use a smartphone to access the Internet during the last three months? Answer options: (1) yes and (0) no.
Belief that Internet facilitates communication: To what extent do you agree or disagree with the following statement? The Internet simplifies communication between people. Answer options: (1) disagree strongly, (2) disagree somewhat, (3) neither/nor, (4) agree somewhat, and (5) agree strongly.
Affinity for technology: To what extent do you agree or disagree with the following statement? It is exciting to try out new technologies or equipment. Answer options: (1) disagree strongly, (2) disagree somewhat, (3) neither/nor, (4) agree somewhat, and (5) agree strongly.
Survey evaluation: difficulty: How difficult did you find the survey? Answer options: (1) not at all, (2) hardly, (3) partly, (4) quite, and (5) very.
Survey evaluation: enjoyment: How did you like the survey? Answer options: (1) not at all, (2) hardly, (3) partly, (4) quite, and (5) very.
Survey evaluation: length: How lengthy did you find the survey? Answer options: (1) not at all, (2) hardly, (3) partly, (4) quite, and (5) very.
Survey evaluation: topic sensitivity: How personal did you find the survey? Answer options: (1) not at all, (2) hardly, (3) partly, (4) quite, and (5) very.
Need for cognition: a. Simply knowing the answer rather than understanding the reasons for the answer to a problem is fine with me. b. I prefer my life to be filled with puzzles that I must solve. c. I would prefer complex to simple problems. d. I think primarily because I have to. Answer options: (1) agree not at all – (4) neither/nor – (7) agree strongly.
Age: In what year were you born? Answer field: [Please enter your year of birth].
Gender: What is your gender? Answer options: (1) male, (2) female, and (3) other.
Educational attainment: What is your highest school degree? Answer options: (1) still attending school, (2) left school without a degree, (3) “Polytechnische Oberschule GDR,” completion of eighth or ninth grade, (4) “Polytechnische Oberschule GDR,” completion of 10th grade, (5) lower secondary school degree, (6) intermediate secondary school degree, (7) UAS-entrance degree, and (8) university-entrance degree.
Note. The German wordings of all questions including answer options are available from the first author upon request.