
Abstract
Since cash lotteries are frequently employed to stimulate participation in web surveys sampled from online access panels, the present study assesses the research gap concerning the relevance of respondents knowing their odds of winning these cash lotteries. Prior studies on the use of cash lotteries have not provided the odds of winning to respondents, which may have obscured their effects. Based on an experiment in which we varied the number of prizes, the size of prizes, and whether respondents knew the odds of winning, we replicated the findings of prior studies on the use of cash lotteries. Most importantly, our findings show that knowing the odds of winning cash lotteries did not affect the participation in our survey and did not influence the effects of other survey design elements. In our study, we provide survey practitioners with recommendations on the use of cash lotteries in online access panels and close with an outlook for future research on this topic.
Introduction
Commercial online access panels (OAPs) are widely used for market research and social science research (Callegaro et al., 2014; Cornesse et al., 2020). Whether surveys draw on the samples provided by OAPs or use other sampling approaches, a common goal for survey researchers is to achieve high participation rates. Ensuring high participation is especially important for panel surveys that require respondents to participate in several subsequent interviews (i.e., panel waves) so to allow the measurement of intra-individual change or to employ test-retest methods.
Cash lotteries, frequently employed to stimulate participation, have been investigated by several studies (e.g., Bosnjak & Tuten, 2003; Göritz, 2006a; Göritz & Luthe, 2013b; Göritz & Wolff, 2007; Heerwegh, 2006; Porter & Whitcomb, 2003; Tuten et al., 2004; Zhang et al., 2017). Previous research has been conducted based on different samples that include online access panels (e.g., Göritz & Luthe, 2013b; Pedersen & Nielsen, 2016), university students (e.g., Heerwegh, 2006), professional sales associates (e.g., Bosnjak & Tuten, 2003), and web site owners (e.g., Marcus et al., 2007). For reviews and meta-analyses of existing studies, see Singer and Ye (2013) and Göritz (2006a, 2006b). Overall, a tendency seems to exist among prior studies that the effects of cash lotteries on survey participation are small or nonexistent. Despite their limited, or at least questionable impact, on survey participation, cash lotteries are still widely used. As Göritz and Wolff (2007) have argued, this widespread use is likely the result of cash lotteries having modest transaction costs, since only a few respondents will receive payment, and costs can be capped ahead of time when designing a survey, since the amount of money invested in a lottery can be predetermined.
With respect to OAPs, it seems reasonable to assume that “payment” is a relevant motivation to participate for a major part of the sample, which is an assumption many survey practitioners seem to share given the persistence of cash lotteries. Regarding commercial OAPs, panelists self-select for participation in the panels and receive payment for completing surveys. Often, they do so for each survey they complete and for completing screening questions that are part of quota-based surveys to screen-out non-eligible cases. From a theoretical point of view, leverage saliency theory (Groves et al., 2000) can be utilized to derive expectations about why cash lotteries might increase participation in OAPs (Zhang et al., 2017). In leverage salience theory, earning money (i.e., winning prizes in a cash lottery) for survey participation can be a “leverage,” and the prize size can be understood as the “saliency” of that leverage. In other words, offering higher and more cash prizes can be assumed to increase the saliency of the monetary motivation among those interested in receiving payment for participation.
Göritz and Luthe (2013b, p. 614) have distinguished three features of a cash lottery: (1) the total payout of a lottery, (2) the number of prizes into which the total payout is split, and (3) the size of single prizes. Feature (2) determines the respondents’ odds of winning—by defining how many prizes are available for a finite number of respondents. We argue that knowing the odds of winning is essential for respondents to calculate their expected value of participating in a survey. However, knowing the number of prizes alone is not helpful to respondents without knowing how many other respondents are eligible to win the lottery. Respondents cannot compute their odds of winning just by knowing the number of prizes offered. If the odds are not known, the size of the prizes is the sole information respondents can rely on. When reviewing the previous literature, we found that only a few studies stated that their survey respondents knew their odds of winning (Göritz & Luthe, 2013a; Pedersen & Nielsen, 2016) and none (that are known to us) included the odds of winning as a factor in their experimental design. Most commonly, the experimental designs varied as to whether a cash lottery was offered to respondents or not, and whether prizes were split into several single prizes or offered as one “lump sum” (e.g., Göritz & Luthe, 2013b).
The present study assesses the research gap concerning the relevance of respondents knowing their odds of winning a cash lottery that is used to stimulate their participation in a survey. Not providing the odds of winning to respondents may help to explain why some studies found lump sum approaches more successful than split prizes (e.g., Göritz & Luthe, 2013b) and why other studies found cash lotteries had limited effects when compared to offering no incentives (e.g., Göritz, 2006a). Accordingly, we investigated a research question about whether knowing the odds of winning a cash lottery for survey participation in an OAP influences and/or obscures the effects of the size of prizes and the number of prizes. Thus, we conducted a web survey experiment that systematically varied the number of prizes, the size of prizes, and whether respondents knew the odds of winning.
Data and Methods
Survey
We implemented our experiment in a web-based panel survey with two waves fielded in Germany. The first wave was fielded between November 17 and 27, 2021. The respondents who finished the first interview were invited to participate in a re-interview. The second wave was fielded between February 22 and March 2, 2022. We sampled survey respondents from a large German online access panel using quotas on gender, age, and education. For each wave of our survey that respondents participated in, they received an incentive in panel points equivalent to 0.50€. This incentive was independent from our experiment on cash incentives (see below) and was paid to all respondents independent of the experimental condition to which they were assigned. Completing the first wave questionnaire took 3.6 minutes on average (Median = 2.7). The second wave questionnaire took 2.8 minutes on average to complete (Median = 3.6). Both questionnaires featured questions regarding respondents’ life course and occupational status.
In the first wave, a total of 5128 respondents followed the invitation to participate. Of these respondents, 104 did not consent to participate; 31 were screened out based on the age restriction to individuals between 18 and 69 years; 1066 were rejected due to full quotas; and 55 broke off, yielding a break-off rate of 1.4% (Callegaro & DiSogra, 2008). Of those who finished the first wave, 2786 respondents followed the invitation to the second wave. Of these respondents, 38 did not consent to participate and 34 broke off, yielding a break-off rate of 1.2%.
Experimental design
Experimental design.
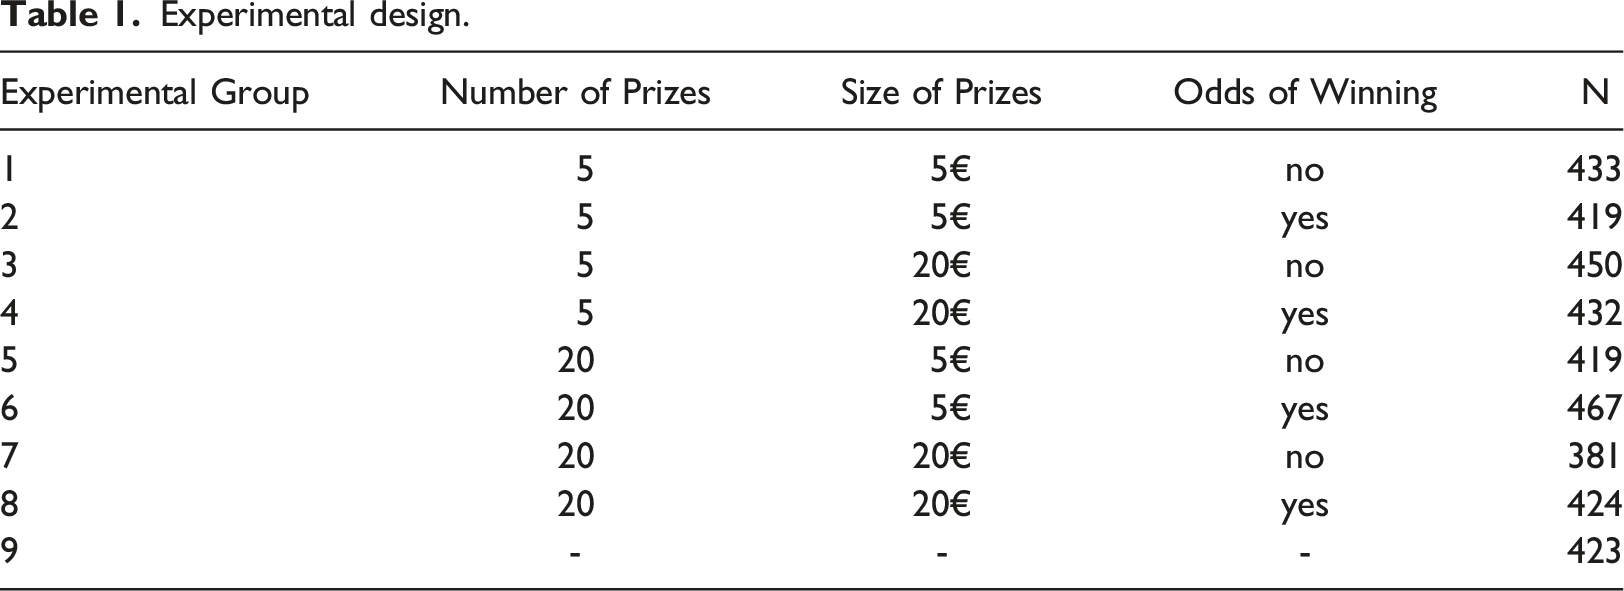
The allocation of respondents to experimental groups was randomized and varied between 381 and 467 with an average of 428. We computed
Analytical strategy
To compare the effects between the experimental groups, we computed the participation status in the second wave of the survey for each respondent who was invited (0 = no participation, 1 = participation). Allocation to experimental groups was coded in nine dummy variables (0 = no, 1 = yes). We compared the participation rates between the groups using χ2-tests.
Results
Main Findings
Participation in the second wave of the web survey across experimental groups.
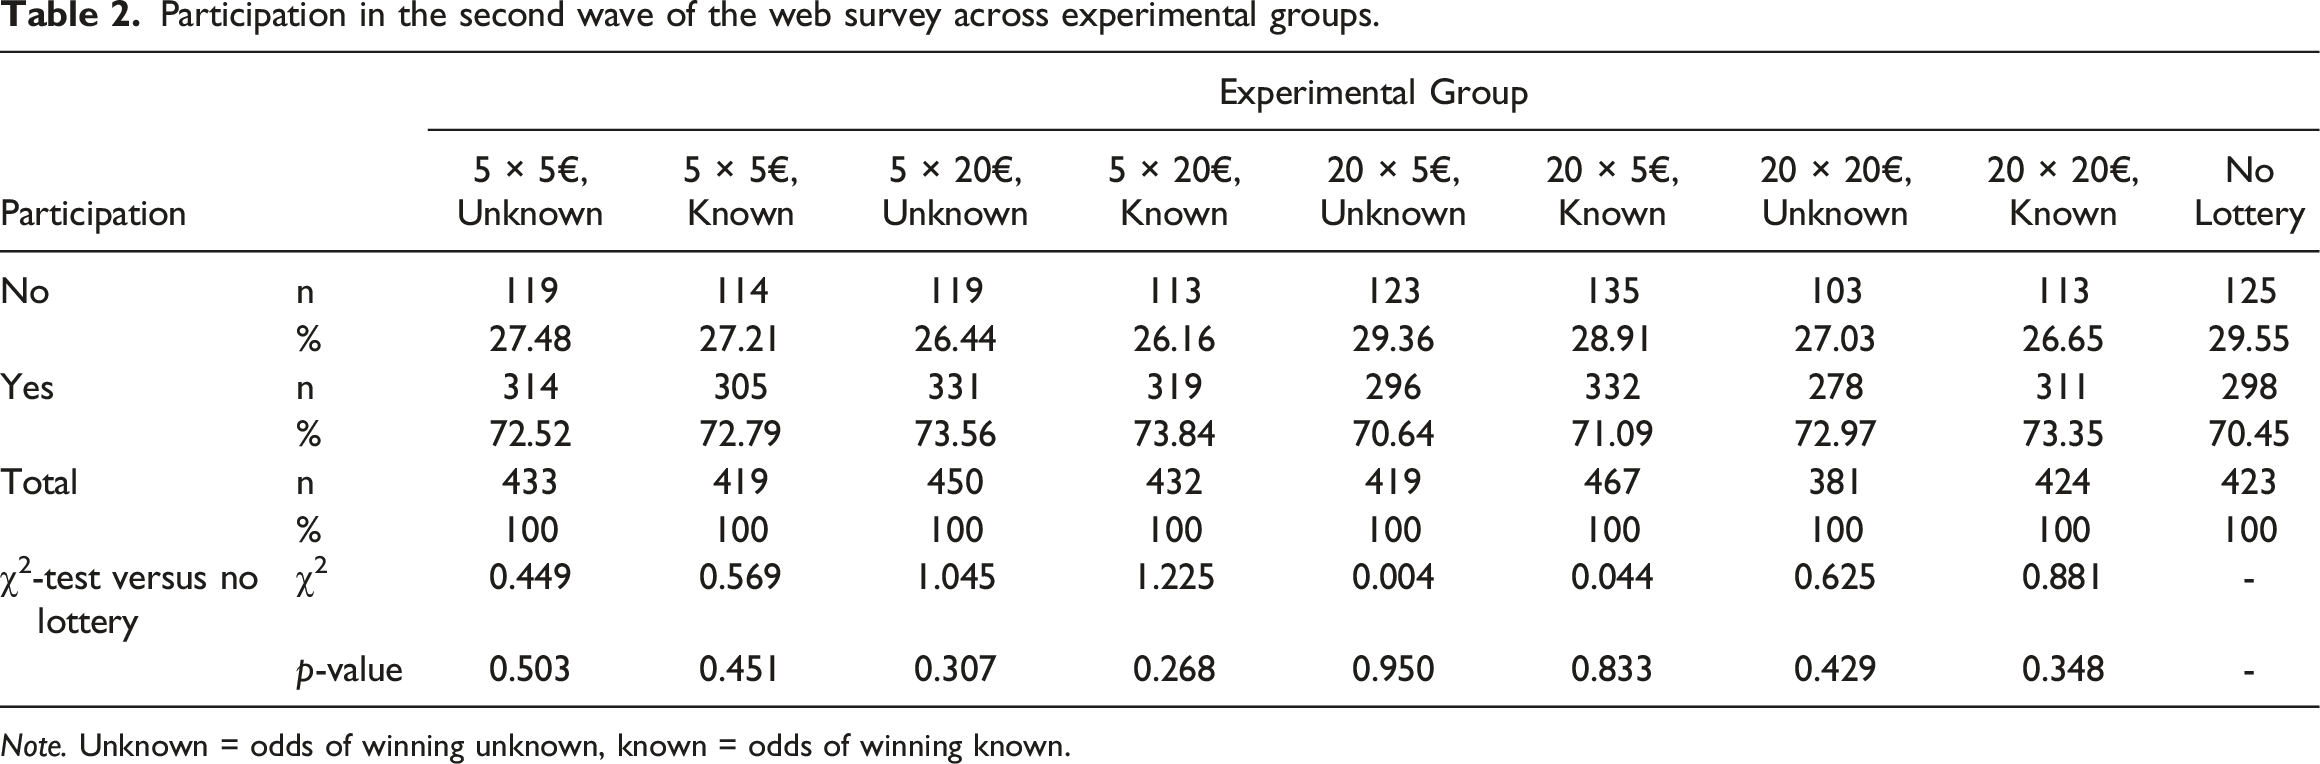
Note. Unknown = odds of winning unknown, known = odds of winning known.
To complement our analyses, we pooled the experimental groups to investigate whether main effects occurred with respect to an offer of a cash lottery, the number of prizes, the size of prizes, or respondents knowing their odds of winning. When comparing all experimental groups (groups 1–8) to the control group, to assess whether providing a cash lottery had an impact on participation (no matter its design), we found no differences between an offer of a cash lottery and no offer of a cash lottery (χ2 = 0.858, p = 0.354). Similarly, we found no differences in participation between the groups for which the size of prizes was smaller (5€) compared to the groups with larger prizes (20€) (χ2 = 1.236, p = 0.266). Our analyses also showed no differences in participation between the groups for which the number of prizes was lower (5x) compared to the groups with a higher number of prizes (20x) (χ2 = 0.634, p = 0.426). Finally, we found no differences in participation between the groups for which the odds of winning were known compared to those groups that did not know the odds of winning (χ2 = 0.039, p = 0.843).
Robustness Check
Main effects of design characteristics on participation in the second wave of the web survey for respondents with low education or unemployed.
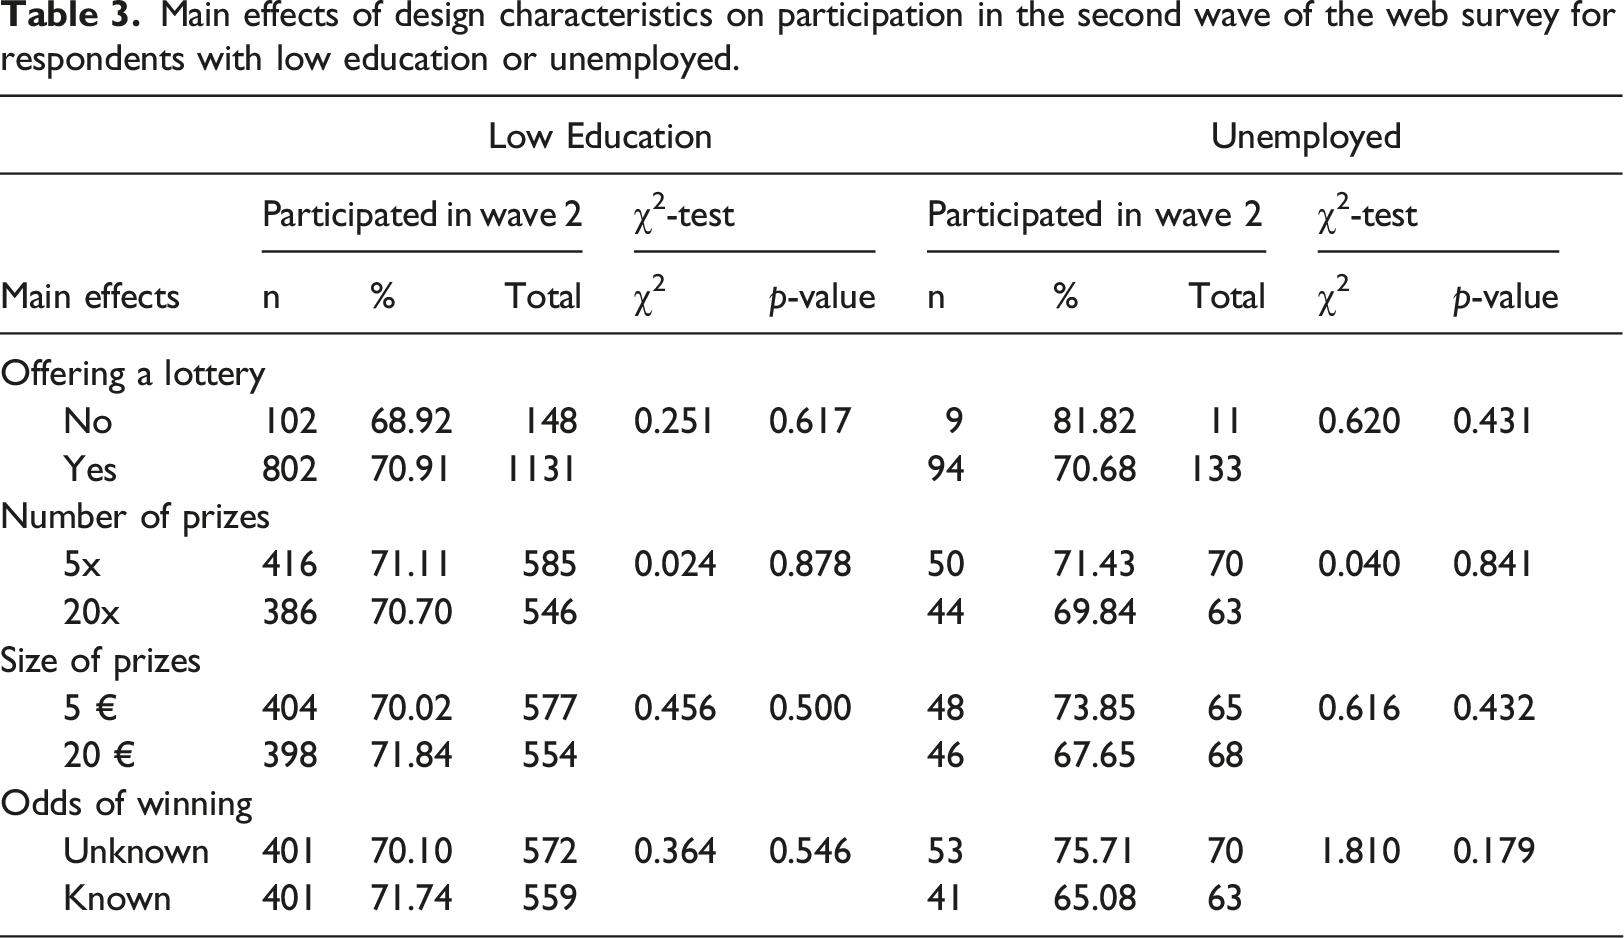
For those respondents who had lower education, we replicated our previous results. Thus, we did not find any significant differences in participation between each experimental group and the control group (all χ2-tests with p > 0.05, see Appendix Table A1). We also did not find any main effects of offering a cash lottery, the number of prizes, the size of prizes, or respondents knowing their odds of winning.
Regarding our survey, 144 respondents were unemployed when they completed the first wave. Due to this low number, we only re-ran the pooled analyses. Again, we did not find any main effects of offering a cash lottery, the number of prizes, the size of prizes, or respondents knowing their odds of winning.
Conclusions
The present study complements previous research on the use of cash lotteries in OAPs. Thus, we conducted a web-based survey experiment to investigate whether respondents not knowing their odds of winning in previous experiments on cash lotteries had obscured or influenced the effects found by these studies. Fortunately, our findings are in line with previous research on cash lotteries that have indicated a limited or nonexistent effect of cash lotteries on respondents’ likelihood of participating in a survey (e.g., Göritz, 2006a; Göritz, 2006b; Singer & Ye, 2013). We found that knowing the odds of winning did not obscure the effects of the number of prizes offered to respondents nor the size of the prizes offered. Our data showed that offering a cash lottery did not increase respondent participation when compared to offering no lottery. Most importantly, our findings show that knowing the odds of winning a cash lottery did not affect participation in our survey, and, moreover, this knowledge did not influence the effects of other design elements.
Our findings are of relevance to survey practitioners, especially those who routinely work with OAPs. First, offering a cash lottery in an OAP does not seem mandatory for stimulating participation regarding the whole sample—at least with respect to the moderately sized prizes we tested in the present study. Our study supports the conclusion of Göritz and Luthe (2013b, p. 624) that cash lotteries “need to be seen in a nuanced light,” which suggests that they are not a panacea for increasing participation among all respondents. Cash lotteries may be a useful tool, but one that needs to be carefully applied to those respondents most inclined to be influenced. However, in our robustness checks focused on groups, which we assumed especially likely to be affected by monetary incentives, we did not find a cash lottery effect. Thus, practitioners might consider investing their limited resources not in cash lotteries but in other aspects of surveys that are known to improve participation or the overall survey experience. Second, our findings indicate that those researchers who are already using cash lotteries and whose respondents are used to these approaches are not under any pressure to implement drastic design changes to these instruments. Our findings indicate that knowing the odds of winning did not change participation behavior. In other words, instruments with cash lotteries can be used as before, and existing templates of cash lotteries (e.g., for design and/or programming) can be implemented as before.
Our study is not without limitations that hold opportunities for future research. First, for our study, we drew on one web survey experiment fielded in Germany. Replication in other OAPs and other countries is certainly desirable to test the generalizability of our findings. Second, we decided to implement an experiment using moderately sized cash prizes that would reflect the cost savings and cost capping nature of cash lotteries. It might be the case that higher prizes (e.g., 200€) could affect participation. The panelists of the OAP we used for our survey received an incentive (independent from our experiment) of 0.50€ for participation in a 2–4 minute survey—an amount our cash prizes surmounted by a factor between 10 and 40. Future studies could investigate whether the odds of winning are of relevance when larger categories of cash prizes are offered. For this purpose, future studies could adapt our research design and adjust the number and size of prizes accordingly. The standard incentives paid in OAPs might provide a baseline to assess whether prizes appear high or low to panelists. Third, we reported the odds of winning as a ratio (e.g., “1 to 5”), and certainly other ways of reporting odds are available. Further research should investigate whether our results hold true for other formats of reporting winning odds that may be processed differently by respondents. Fourth, the focus of the present study was on commercial OAPs for which leverage saliency theory provides a reasonable argument why cash incentives and lotteries might work. Yet, other sources of samples exist such as river sampling via websites or non-commercial OAPs. In our view, it would be interesting to test whether knowing the odds of winning is of relevance with respect to these samples. Again, our research design could be applied to different sources of survey samples.
Footnotes
Declaration of conflicting interests
The author(s) declared no potential conflicts of interest with respect to the research, authorship, and/or publication of this article.
Funding
The author(s) received no financial support for the research, authorship, and/or publication of this article.
Note
Table A1. Participation in the second wave of the web survey across experimental groups for respondents with low education.
Note. Unknown = odds of winning unknown, known = odds of winning known.
Participation
Experimental Group
5 × 5€, Unknown
5 × 5€, Known
5 × 20€, Unknown
5 × 20€, Known
20 × 5€, Unknown
20 × 5€, Known
20 × 20€, Unknown
20 × 20€, Known
No Lottery
No
n
42
44
43
40
48
39
38
35
46
%
28.97
28.21
29.25
29.20
33.10
29.77
28.15
25.93
31.08
Yes
n
103
112
104
97
97
92
97
100
102
%
71.03
71.79
70.75
70.80
66.90
70.23
71.85
74.07
68.92
Total
n
145
156
147
137
145
131
135
135
148
%
100
100
100
100
100
100
100
100
100
χ2-test versus no lottery
χ2
0.156
0.301
0.117
0.120
0.138
0.056
0.291
0.918
-
p-value
0.693
0.583
0.732
0.729
0.711
0.812
0.590
0.338
-