
Abstract
Introduction:
The renin gene has been suggested as a good candidate in the study of genetic mechanism of essential hypertension. However, studies on the contribution of renin gene polymorphisms to essential hypertension, have not had consistent outcomes. The purpose of the present study is to explore the association of renin gene polymorphisms with essential hypertension in the Han population of northern China.
Methods:
A case-control study was conducted among 3090 Han farmers (1533 essential hypertension patients and 1557 normotensives). Genotyping was performed by polymerase chain reaction-restriction fragment length polymorphism and polymerase chain reaction-sequencing.
Results:
The genotypic and allelic distributions of rs2368564 in essential hypertension and control was significant statistically (p<0.001). The allelic distribution of rs10900557 showed marginal statistical significance (p=0.048). There were no significant differences in other genotypic and allelic distributions (p>0.05). In the haplotypes comprised by the six single-nucleotide polymorphisms, there were differences in the distribution of haplotypes A-T-C-G-C-A, A-T-C-G-C-G, G-C-T-G-T-A and G-C-T-G-T-G in both groups, and their differences reached to significant levels, respectively. After having corrected for false discovery rate, this association still remained significant.
Conclusions:
The current study provides evidence for a possible association of renin gene polymorphisms with essential hypertension in a Han population of northern China.
Introduction
Essential hypertension (EH) is a complex multifactorial genetic disease with unknown etiology at the present time. EH has affected approximately one billion people worldwide and has become a major health problem globally.1,2 As is well-known, the classical renin-angiotensin-aldosterone system (RAAS) mainly includes angiotensinogen, renin, angiotensin, angiotensin-converting enzyme (ACE), and aldosterone, playing an important role in the regulation of blood pressure and water-electrolyte homeostasis. Therefore the genes that encode for the RAAS, have been selected as causative candidates for EH. Moreover, studies on candidate-gene-based association are still very popular for identifying genetic components of EH. 3
Renin, as the first enzyme of the RAAS cascade, is an aspartyl protease synthesized by the juxtaglomerular cells of the kidney. Renin cleaves angiotensinogen to angiotensin I, which is further catalyzed to angiotensin II by ACE. Angiotensin II is a potent vasoconstrictor and effective stimulator of aldosterone release, thus affecting blood pressure and electrolyte homeostasis. Thereby, the gene encoding renin is a good candidate for the study of EH etiology. The renin gene (REN) is located in chromosome 1q32, 12.5kb in length with 10 exons and nine introns in coding region. 4
In the past two decades, a number of association studies between single-nucleotide polymorphisms (SNPs) of REN and EH have been performed, but unfortunately, results have been inconsistent. Frossard et al.5–7 discovered MboI and BglI polymorphisms, and their haplotypes had a significant association with EH among the United Arab Emirates (UAE) and US Caucasian populations. Ahmad et al. 8 also found MboI was implicated in the pathogenesis of EH in Emirati people. However, Valdez-Velazquez et al. 9 found 10607G>A (MboI) and 1303G>A (BglI) had no association with EH in the populations of Mexicans and Germans. Mohana Vamsi et al. 10 indicated that REN MboI polymorphism was not associated with EH in the South India population. Fu et al. 11 showed that there was lack of correlation between MboI polymorphism and essential hypertension in Japanese. Afruza R et al. 12 found that there was not any distinct association between BglI, TaqI, MboI, and EH in the Bangladeshi population. The above-mentioned studies were all about the REN intron. There were some studies about other regulatory regions of the REN. In 2010, Vangjeli et al. 13 found that the REN-5312C/T polymorphism was associated with increased blood pressure in the Irish population. Park et al. 3 suggested that carriers of the A allele in rs6682082 were more likely to have hypertension amongst Korean women. Another aspect of REN variation was insert/deletion (I/D). Ying et al. 14 found REN I/D polymorphism was associated with EH in the Chinese Mongolian population. Among these studies, the SNPs in the first and ninth introns were hot topics. Collectively, the research results were sometimes inconsistent and contradictory.
In our previous investigation, 15 we found that SNPs were clustered in intron 1. In order to explore the contribution of this clustered feature to EH and the association of rs2368564 with EH, we implemented a case-control study in the Han population of northern China.
Methods
Subjects
Three thousand and ninety Han farmers of northern China were selected from a large scale of field survey in the Lanxi county of Heilongjiang province, including 1533 EH patients and 1557 normotensives (NTs) aged more than 40 years old. The inclusion criteria for EH were: (a) average systolic blood pressure (SBP)≥140 mm Hg and/or average diastolic blood pressure (DBP)≥90 mm Hg tested on three separate occasions; (b) although the blood pressure in three tests had not reached the required scale, the individual had taken anti-hypertension drugs within the past two weeks. Subjects with diabetes, stroke, and secondary hypertension were excluded. The inclusion criteria for controls were: attending the same field survey, with normal blood pressure, and not having taken any antihypertensive drugs, excluding those for diabetes and stroke. All data were collected via demographic questionnaire, direct measurement, and laboratory examination.
All of the participants were independent and gave informed consent. The study protocol was approved by the ethics committees of Harbin Medical University.
Genotyping
Genomic DNA was extracted from leukocytes of peripheral venous blood using a commercial Blood Gen Midi kit (CWBio,China).
Genotyping of 451bp DNA fragment in REN intron 1
Primers were designed via Primer Premier 5.0 software. The reference sequences were described in GenBank of human REN intron 1 (AF213461). The total volume of polymerase chain reaction (PCR) system was 25 μl (Supplementary Material Table 1). An amplification was performed in Mycycler thermal cycler (Bio-Rad, USA). The primer nucleotide sequence and cycle reaction conditions are referred to in Supplementary Material Table 2. After the amplification, PCR products were subjected to 1% agarose gel electrophoresis for quality detection. The distinct and bright gel with single band of 451 bp was collected and then delivered to the commercial company (Huada Gene Company, Beijing, China) for DNA sequencing via the dideoxy chain termination method. Sequencing results were read with two software packages, DNAStar and Chromas respectively.
Genotyping of rs2368564
Primers are referred to in the Frossard et al. study. 5 The cycle condition is summarized in Supplementary Material Table 2. Subsequent to amplification, PCR products were subjected to 1% agarose gel electrophoresis to detect the quality. The clear band of 250 bp could be subjected to digestion using restriction endonuclease MboI. A quantity of 20 μl of digestion mixture included 10 μl PCR products, 0.6 μl MboI restriction endonuclease (3U), 2 μl New England Biolabs (NBE) buffer and 7.4 μl double distilled water (ddH2O), which was incubated at 37°C for one hour. The digested products were genotyped on 3% agarose gel electrophoresis using the 500 bp ladder as standard.
Data analyses
Data analyses were performed with Statistical Analysis Software (SAS) version 9.1.3. Values were expressed as numbers, percentages, mean±standard deviation (SD). Demographic and clinical characteristics were analyzed by Student’s t-test (enumeration data) or χ2 test (measurement data). Genotype frequencies were measured via SHEsis online software (http://analysis.bio-x.cn/myAnalysis.php), to confirm whether they accorded with Hardy-Weinberg equilibrium (HWE). If they corresponded with HWE (p>0.05), further analysis could be carried out by subsequent χ2 test and logistic regression, which were utilized to analyze the genotypes and alleles distribution in both case and control. Analysis of variance (ANOVA) analysis was adopted to evaluate the distributional differences of SBP or DBP in three genotypes, based on SNP and group. SHEsis online software was employed to analyze the haplotype distribution in both groups. The false discovery rate (FDR) was applied to correct multiple hypothesis testing.16–18 The FDR significance threshold was defined as the value of 0.20. 19
Results
Demographic and clinical characteristics of subjects
A total of 3090 individuals, 1533 patients with EH and 1557 controls, participated in this study. Their demographic and clinical characteristics are illustrated in Table 1. Variables with significant differences between the two groups were age, abdominal circumference (AC), body mass index (BMI), triglyceride (TG), high-density lipoprotein (HDL), and fasting blood glucose (FBG). It was demonstrated that age, AC, BMI, TG, FBG were the risk factors for EH, whereas HDL was a protective factor for EH.
Demographic and clinical characteristics in essential hypertension (EH) and normotensive (NT) groups.

AC: abdominal circumference; BMI: body mass index; DBP: diastolic blood pressure; FBG: fasting blood glucose; HDL: high-density lipoprotein; SBP: systolic blood pressure; TG: triglyceride.
Genotyping
PCR/sequencing of the 451bp DNA fragment in REN intron 1 revealed five SNPs: 951A>G (rs11240687), 1064T>C (rs2177695), 1091C>T (rs10900557), 1162G>A (rs10900556), 1200C>T (rs11240686). Chromas technology was used to identify homozygous or heterozygous variants as shown in Figure 1 (taking rs10900557 for example). Electrophoretic pictures of rs2368564 are shown in Figure 2.
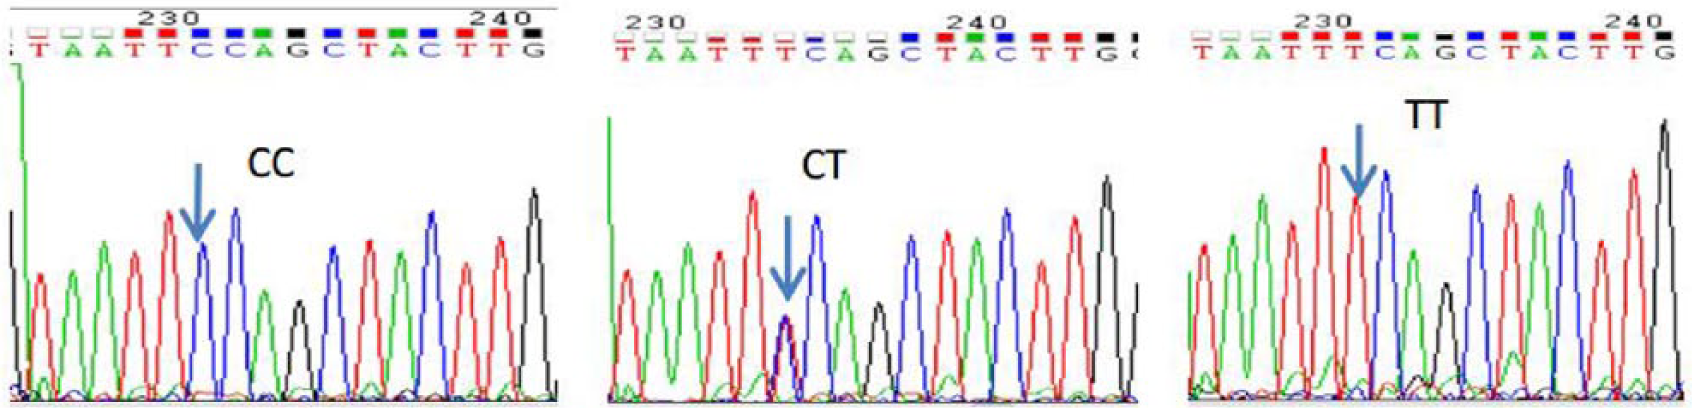
Sequencing figure of rs10900557. The arrow shows the variation sites.

3% Agarosel gel electrophoresis showing polymerase chain reaction (PCR) product of REN and rs2368564 polymorphism.
Analyzing distribution of genotype and allele in two groups
At first, all genotypes of the six SNPs in the control group were fitted to the HWE (p>0.05). Genotypes and allele distributions of six SNPs between patient and control groups are displayed in Table 2. Among the six SNPs, the genotypic and allelic distribution of rs2368564 were both statistically significant (p<0.001, FDR=0.00, adjusted by age, family history of EH, gender, AC, BMI, TG, HDL and FBG). In the other five SNPs, only allelic distribution of rs10900557 was statistically significant (p=0.048, FDR=0.14). The result in Table 2 shows that, compared to GG genotype, GA and AA genotypes were statistically associated with the risk of EH, with odds ratios (ORs) (95% confidence interval (CIs)): 1.97 (1.63–2.38) and 3.63 (1.96–6.71), respectively. Moreover, dominant model analysis disclosed that the dominant model (GG versus AA+GA) had a statistically significant difference between EH and NT groups (FDR=0.00). The proportion of EH was 60.8% in genotype AA or GA carriers, and 45.0% in the genotype GG.
Distributional difference of genotypes and dominant models between cases and controls.

AC: abdominal circumference; BMI: body mass index; CI: confidence interval; FBG: fasting blood glucose; HDL: high-density lipoprotein; OR: odds ratio; TG: triglyceride.
Adjusted age, family history of EH, gender, AC, BMI, TG, HDL, and FBG.
Analysis of haplotypes
The analysis of linkage disequilibrium showed its relationship among five clustered SNPs, D’>0.8 (Supplementary Material Figure). There were only three haplotypes (A-C-C-A-C, A-T-C-G-C, G-C-T-G-T) consisting of the five SNPs, of which their frequencies were more than 3% in EH or NT group. The distributional differences of the three haplotypes between two groups had no statistical significance. However, their effect was observed after they were connected with alleles of rs2368564. There were six haplotypes, of which frequencies were more than 3% in EH or NT group (Table 3). The distributional differences of the six haplotypes between the two groups, except for haplotypes H1 and H2, reached significant levels in the other four haplotypes (p<0.05, FDR<0.2).
The haplotype frequencies of six single-nucleotide polymorphisms (SNPs) and the distributions between cases and controls (the frequencies in both groups are more than 3%).

CI: confidence interval; FDR: false discovery rate; OR: odds ratio.
Risk factor; bprotective factor.
Discussion
In China, the prevalence of hypertension decreases from north to south. All the participants in this study were from rural areas of Lanxi County located at 46.27°N latitude, where the prevalence rate of hypertension was high (the prevalence was 33.9% in 2014). 20 Farmers were selected as subjects in our study, which could rule out the interference of population mobility that might affect the accuracy of this study. The demographic and clinical characteristics between EH and NT showed that age, AC, BMI, TG, FBG were the risk factors, while HDL was the protective factor for EH, findings which were consistent with other researchers.21,22
In recent decades, substantial association studies of REN polymorphism with EH were conducted. More so, the research results could not be repeated for the geographical and genetic heterogenicity of EH. There was a lot of previous research on the REN intron 1 polymorphism with EH, but almost no study involved the clustered variants that were shown in the current investigation. Hopefully, this can be a new direction in future research.
The analyses of genotype and allele suggested that rs2368564 polymorphism was significantly associated with EH in the Han population of northern China. The frequency of the A allele was EH 19.6% vs NT 12.0% respectively. The OR (95% CI) was 1.79 (1.52–2.11), which implied that the variant A was the risk factor for EH. Moreover, the dominant model analysis revealed that the risk to EH with genotype AA or GA was higher than that with genotype GG. However, the analyses of genotype and allele of the other five SNPs clustered in the intron 1 showed no association with EH.
By the analysis of haplotype, 26 haplotypes were found in whole subjects. But there were only six haplotypes, of which frequencies were more than 3% in EH or NT. The distributions of haplotypes H3, H4, H5, and H6 between cases and controls revealed a significant association (p<0.05, FDR<0.2). The OR values of haplotypes H3 and H5 were more than 1.2, which were consistent with the single site rs2368564, and confirmed that allele A was the risk factor for EH. Moreover, the five clustered SNPs could increase the risk of single allele A for EH, because the OR values of haplotypes H3 and H5 were 2.0 and 2.8, both more than 1.8. The OR values of haplotypes H4 and H6 were less than 0.9, which also proved that allele G was the protective factor for EH. The analysis of haplotypes implied that taking six SNPs simultaneously could enable us to find the association with EH. Haplotypes H3 and H5 would increase the risk of EH, while haplotypes H4 and H6 would protect people from getting EH.
There were several limitations in our study. First, it is better to randomly select SNPs in the whole gene when analyzing the contribution of haplotype to disease. However, in order to explore the contribution of clustered SNPs in intron 1 to EH, we chose five SNPs that were clustered in intron 1, while rs2368564 is sited in intron 9. Thus, the next step we need to do is to study the SNPs sited in the 5’-control region and other introns. Second, confirmative studies in other ethnic groups need to be performed.
In conclusion, we have preliminarily shown the significant association between rs2368564 and EH and ascertained that the variant A of rs2368564 was the risk factor for EH in the Han population of northern China. Furthermore, we found that haplotypes A-T-C-G-C-A, A-T-C-G-C-G, G-C-T-G-T-A and G-C-T-G-T-G out of REN intron 1 and intron 9, contributed to the development of EH in the Han population of northern China. We believe that further studies about the interaction of more SNPs in RAAS can help to elucidate the genetic mechanism of EH.
Footnotes
Acknowledgements
The authors wish to thank all of the participants and doctors who co-operated with them.
Declaration of conflicting interests
The author(s) declared no potential conflicts of interest with respect to the research, authorship, and/or publication of this article.
Funding
The author(s) disclosed receipt of the following financial support for the research, authorship, and/or publication of this article: This work was supported by the Natural Science Foundation of China (NSFC; grant number 31440054) and the major project of Qiqihar Medical University (grant number 201202).
References
Supplementary Material
Please find the following supplemental material available below.
For Open Access articles published under a Creative Commons License, all supplemental material carries the same license as the article it is associated with.
For non-Open Access articles published, all supplemental material carries a non-exclusive license, and permission requests for re-use of supplemental material or any part of supplemental material shall be sent directly to the copyright owner as specified in the copyright notice associated with the article.