
Abstract
Introduction:
Apelin plays an important part in regulating blood pressure, metabolism, and the development of cancer. Recent studies have investigated the association of apelin polymorphisms and hypertension risk, but no meta-analysis has been conducted.
Materials and methods:
Five studies were included in this meta-analysis in total. The pooled odds ratio and its corresponding 95% confidence interval were calculated by the random-effect model.
Results:
The overall pooled odds ratio of the distribution of rs3761581 G allelic frequency was 0.90 (95% confidence interval: 0.82–1.00). In female participants, the pooled odds ratio of the frequency of G allele was 1.01 (95% confidence interval: 0.89–1.14). For males, the pooled odds ratio of the frequency of G allele was 0.69 (95% confidence interval: 0.46–1.03). As for rs56204867, the overall pooled odds ratio of the frequency of G allele was 1.09 (95% confidence interval: 0.86–1.37). In females, the pooled odds ratio of the frequencies of the G allele was 1.05 (95% confidence interval: 0.86–1.29). In male participants, the frequency of G allele did not show significant correlation with hypertension (pooled odds ratio=1.21 95% confidence interval: 0.81–1.79).
Conclusion:
This meta-analysis revealed that there was no correlation between apelin polymorphisms, rs3761581 and rs56204867, and the prevalence of hypertension.
Introduction
Essential hypertension (EH) is regarded as a clinical syndrome characterized by increased blood pressure (systolic blood pressure (SBP)⩾140 mm Hg/diastolic blood pressure (DBP)⩾90 mm Hg) induced by environmental factors and genetic factors, which often leads to damage or dysfunction of other organs. Blood pressure can be ameliorated under the modulation of hypertensive risk factors, such as the lipid and glucose levels. The EPIC-Norfolk study suggested that 93% of the cardiovascular risk could be decreased by hemoglobin A1c (HbA1c) and cholesterol intervention, when body mass index (BMI), diet, physical activity, smoking activity were under control. On the other hand, genetic factors provide a promising future for the prediction of the prevalence of hypertension, since an increasing number of genes are considered hypertension-susceptible genes, including angiotensin-converting enzyme (ACE), angiotensin-converting enzyme 2 (ACE2), and the apelin/APJ system.1–4 Deeper understanding of the role of these genes in mediating hypertension or their correlation with hypertension may provide a promising strategy for hypertension prevention.
Apelin is an endogenous ligand of an orphan G protein-coupled receptor APJ. Its encoding apelin gene (APLN) is located on chromosome Xq25-26.1. 5 The apelin/APJ system may play an important part in many physiological or pathophysiological conditions, including blood pressure, 6 angiogenesis, 7 energy metabolism, 8 and cardiac contractility. 9 The apelin/APJ system may play an important role in both vasoconstriction and vasodilation and, thus, regulating blood pressure. However, its detailed mechanism in regulating hypertension remains contradictory and elusive. Multiple studies investigated the association of apelin-APJ polymorphisms with the prevalence of hypertension in the population of various ethnicities. These single nucleotide polymorphism (SNP), loci include rs3115757, rs56204867, rs7119375, rs3761581, rs909656, rs5975126, rs10501367, rs11544374, rs2235306, and rs2235307 of apelin or APJ.4,10–19 And the results were debatable among different regions and genders.
Considering the limited studies of other apelin/APJ system SNPs, this study targeted rs3761581 and rs56204867. As for the apelin SNP locus rs3761581, seven studies were identified. One study was based on the population of Mexican-Mestizo ethnic origin and did not find any significant correlation of this SNP locus with the prevalence of hypertension (p=0.1707). 10 Another study based on the Indian population failed to observe an association of rs3761581 with the hypertensive risk as well. 11 However, among the Chinese Han population, the results were conflicting. In the Southern Chinese population (Fujian), the T allele of rs3761581 was correlated with the higher prevalence of hypertension (odds ratio (OR)=1.949, 95% confidence interval (CI): 1.205–3.154, p=0.007 for males; OR=2.000, 95% CI: 1.327–3.013, p=0.001 for females). 12 Zhu et al. demonstrated the association of rs3761581 with hypertension as well (P=0.008 for males, P=0.009 for females). 15 One study which recruited participants from Eastern China (Shanghai) reported an association of the T allele of this SNP locus in male participants with hypertension (p=0.0156), which was absent in female counterparts (p=0.3882). 16 While among the Northern Chinese population (Heilongjiang), there was no significantly different hypertension risk between different genotypes (p=0.809 for male, p=0.684 for female). 13 Although Li et al. included rs3761581 in their study, they did not discuss its association with hypertension since the data did not satisfy the Hardy-Weinberg Equilibrium (HWE). 20
For rs56204867, seven studies were identified. The study based on Mexican-Mestizo ethnic origin demonstrated the lack of association of this SNP with hypertension (p=0.0769). 10 In the Southern Chinese population (Fujian), the C allele was found to be associated with hypertension in males (OR=2.410, 95% CI: 1.490–3.891, p<0.001) and females (OR=2.052, 95% CI: 1.213–3.470, p=0.007). 12 Another study based on the Southern Chinese population also reported the association of rs56204867 and hypertension in males (p<0.001). 15 One study based on Eastern China (Shanghai) population did not find a significant relationship of rs56204867 and hypertension in both males (p=0.07) and females (p=0.4621). 16 In the Northeastern Chinese population (Heilongjiang), one study demonstrated the significant association between rs56204867 and hypertension in both females (p=0.001) and males (p=0.001), 20 which was absent in another study (p=0.922 for males and p=0.251 for females). 13
Considering the conflicting results of these studies regarding the association of apelin polymorphisms and hypertension in the Chinese population, this meta-analysis was performed to obtain a more comprehensive and precise result. Since meta-analysis of the association between apelin and hypertension has never been reported yet, our study is the first to focus on this correlation.
Materials and methods
Publication search and inclusion criteria
The online databases including PubMed, Web of Science, Embase, China Biological Medicine Database, China National Knowledge Infrastructure, and WanFang were used for the publication search. The search process was conducted by two authors independently. Although several studies written in Chinese were identified, those studies were excluded since the participants in those studies have been included in other published articles. The medical subject heading we used was “hypertension,” “apelin or APLN,” and “polymorphism or mutation or variant.” The studies were included based on the following inclusion criteria: (a) the studies demonstrated the association of apelin or APLN polymorphisms with hypertension; (b) the hypertension diagnosis was SBP⩾140 mm Hg, DBP⩾90 mm Hg. The presence of secondary hypertension was excluded.
Data extraction
Based on the inclusion criteria and after HWE evaluation, three studies regarding rs3761581 and five studies about rs56204867 were included in this study. Data were extracted from these studies, including the author, publication year, region, the design of the study (whether case-control study or cross-sectional study), the sample size of hypertensive group and control group, the source of sample, and the number of genotypes or alleles in female and male participants.
Statistical analysis
The ORs and the corresponding 95% CI were used to evaluate the association of apelin polymorphism and hypertensive risk. The Review Manager 5.3 software (The Cochrane Collaboration, Oxford, UK) was used for meta-analysis. The random-effect model (DerSimonian and Laird’s method) was applied for meta-analysis. 21 Chi-square-based Q-test was performed to evaluate the heterogeneity between these studies. The heterogeneity was considered significant when p<0.10. I2 was used for heterogeneity evaluation as well. The assessment of heterogeneity using I2 statistics was based on following criteria: I2=0–25%, no heterogeneity; I2=25–50%, moderate heterogeneity; I 2 =50–75%, large heterogeneity; I2=75–100%, extreme heterogeneity. 22 The significance of the pooled OR was evaluated by the Z-test. The result with a p<0.05 was significant. The funnel plot was applied to evaluate the publication bias. The asymmetry of the funnel plot was assessed by Egger’s test. The HWE was tested by Fisher’s exact test. As for the sensitivity analysis, we deleted one study each time and investigated if there was any modulation of pooled ORs and heterogeneity. The Chi-square test was used for comparison of frequencies of mutated alleles between different groups. All the statistical analyses were performed through Review Manager 5.3, Stata 15.0 software (Stata Corporation, College Station, Texas, USA), and SPSS version 23.0 (SPSS, Inc., Chicago, Illinois, USA). All p values were two-sided.
Results
The flow of included studies
According to our search strategy, 25 potential studies were searched. Two review articles were excluded.23,24 Four studies not associated with apelin polymorphisms were excluded.25–28 Six studies not suitable for hypertension study were excluded.14,19,25,29–33 Two studies only included other apelin polymorphisms were excluded.18,19 Six studies were excluded, from which appropriate data cannot be extracted.4,10,11,15,34,35 Among excluded studies, although two studies based on the Indian population and Mexican-Mestizo ethnic origin were identified, these two studies were excluded because of limited sample size and low frequency of mutated alleles, the OR value of which cannot be estimated.10,11 The study of Zhu et al. was excluded since it was based on the same participants as the study of Huang et al.12,15 As for rs3761581, the study of Li et al. was excluded considering its dissatisfaction of HWE. 20 All articles included possible confounding factors for hypertension, such as the BMI, age, low-density lipoprotein (LDL), and high-density lipoprotein (HDL). This flow of included studies was demonstrated in Figure 1.

The flow diagram of studies included for apelin polymorphisms and hypertensive risk meta-analysis. SNP: single nucleotide polymorphism.
Study characteristics
The characteristics of the included studies are shown in Table 1 and Table 2. In three studies regarding the rs3761581, the participants were from Southern, Eastern, and Northeastern China, respectively. Two of these studies were case-control studies and one was a cross-sectional study. Two were population-based and one was hospital-based. Among the five studies about rs56204867, two studies included participants in Northeastern China, two studies in Eastern China and one study in Southern China. One study was a cross-sectional study, while others were case-control studies. Three were population-based, while two were hospital-based.
The characteristics of the studies regarding the association of rs3761581 and hypertension.
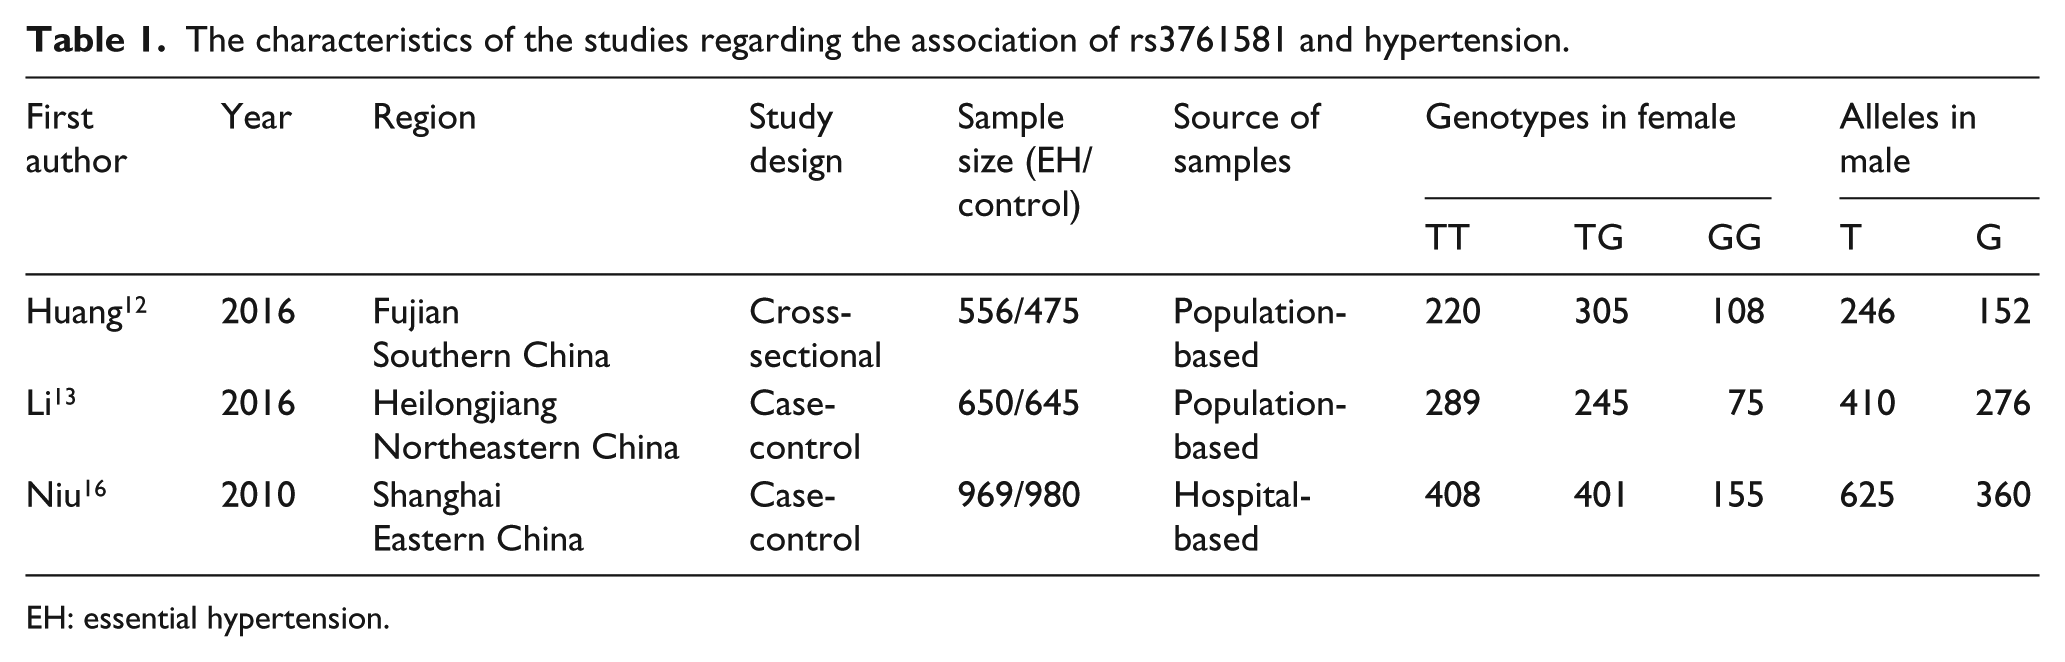
EH: essential hypertension.
The characteristics of the studies regarding the association of rs56204867 and hypertension.

EH: essential hypertension.
Description of data
Since the apelin (APLN) gene locates at the X chromosome, the data were analyzed separately after dividing into two groups by sex. For rs3761581, the frequency of the G allele was 36.2% in the female hypertension group and 38.4% in normal counterparts (p=0.075). The prevalence of the TT/TG/GG genotype was 42.7%/40.5%/16.9% in hypertensive patients and 40.3%/46.2%/13.5% in normal participants. In male participants, the frequency of G allele in hypertensive participants and control group was 34.1% and 41.7%, respectively (p<0.001). For rs56204867, the frequency of the G allele was 32.0% in female patients and 29.6% in normal counterparts (p=0.038). The prevalence of the AA/AG/GG genotype was 48.5%/38.8%/12.6% in hypertensive patients and 50.9%/38.9%/10.2% in normal participants. In male participants, the frequency of the G allele in hypertensive participants and control group was 32.3% and 28.6%, respectively (p=0.020).
Meta-analysis result
As for the genetic variant rs3761581 of apelin, 2175 hypertensive patients and 2100 normal participants were recruited. The HWE was tested and evaluated for the control group in included studies. No study was found to be deviated from the HWE (data not shown). As shown in Figure 2 and Table 3, the pooled OR of the distribution of G allelic frequency was 0.90 (95% CI: 0.82–1.00), regardless of sex. The results of heterogeneity comparison indicated that these studies were not significantly different (p=0.61, I2=0%). The difference between the hypertension group and the control group was not significant as well (p=0.05). In female participants, the frequency of the G allele in hypertensive patients (36.2%) was not significantly different than that in normal counterparts (38.4%) (p=0.075). The pooled OR of the frequency of the G allele was 1.01 (95% CI: 0.89-1.14) (Figure 2 and Table 3). The heterogeneity comparison did not exhibit a significant difference between these studies (p=0.49, I2=0%). Moreover, as was indicated in the overall effect, the difference between the hypertension group and normal counterparts was not significant as well (p=0.89). Under the dominant model of inheritance, the pooled OR of GG+TG/TT value was 0.84 (95% CI: 0.56–1.25). Large heterogeneity was observed in this comparison (p=0.006, I2=81%). There was no significant relationship between GG+TG/TT and the prevalence of hypertension (Z=0.86, p=0.39) (Figure 2 and Table 3). The recessive model of inheritance was also evaluated in female subjects. The result indicated the lack of significant association of GG/TT+TG and hypertension (pooled OR=1.34 95% CI: 0.73–2.48, Z=0.94 (p=0.35)), with high heterogeneity among studies (p=0.003, I2=83%) (Figure 2 and Table 3). For males, the overall comparison of the G allele and T allele indicated the lack of association of this variant with hypertension risk (pooled OR=0.69, 95% CI: 0.46–1.03, p=0.07) (Figure 2 and Table 3). The heterogeneity was significant as well (p=0.010, I2=78%).

Combined forest plots of hypertension associated with the apelin gene (APLN) single nucleotide polymorphism (SNP) rs3761581. CI: confidence interval; EH: essential hypertension.
Comparisons of rs3761581 in different models for hypertension risk.

CI: confidence interval; OR: odds ratio.
As for rs56204867, 3458 hypertensive patients and 3054 normal counterparts were included in this study. No study was found to be deviated from HWE (data not shown). The overall comparison between the G and A allele in predisposing hypertension showed no significant difference (pooled OR=1.09 95% CI: 0.86–1.37, p=0.49), with high heterogeneity (p<0.0001, I2=85%) (Figure 3 and Table 4). In females, the pooled OR of the frequencies of the G allele was 1.05 (95% CI: 0.86–1.29). The heterogeneity among studies was high (p=0.01, I2=70%) (Figure 3 and Table 4). Under the dominant model of inheritance, the pooled OR of the frequencies of GG+AG was 1.01 (95% CI: 0.77–1.34), with high heterogeneity (p=0.006, I2=73%) (Figure 3 and Table 4). Under the recessive model of inheritance, the GG genotype was not highly associated with the prevalence of hypertension (pooled OR=1.22 95% CI: 0.87–1.69), with moderate heterogeneity (p=0.09, I2=50%) (Figure 3 and Table 4). In male participants, the frequency of G allele did not show significant correlation with hypertension (pooled OR=1.21 95% CI: 0.81–1.79). The result indicated an extreme heterogeneity among studies (p<0.0001, I2=84%) (Figure 3 and Table 4).

Combined forest plots of hypertension associated with the apelin gene (APLN) single nucleotide polymorphism (SNP) rs56204867. CI: confidence interval; EH: essential hypertension.
Comparisons of rs56204867 in different models for hypertension risk.

CI: confidence interval; OR: odds ratio.
Sensitivity analysis
In order to find the influence of an individual study on the pooled ORs, we omitted one study each time and investigated if there was any fluctuation of pooled ORs and heterogeneity. And we also used the fix-effect model and random-effect model to test the result of meta-analysis as well. Interestingly, for rs3761581, we found that when we omitted the result of study of Huang et al., although the overall pooled ORs did not vary significantly, the heterogeneity decreased dramatically (I2=45% in female GG+TG vs TT analysis, I2=0% in female GG vs TT+TG analysis and I2=48% in male G vs T analysis) (Figure 4). 12 We found that this study was based on the Fujian population in Southern China, which might be genetically different from participants in other studies. This study also included subjects with a history of hypertension and who were using antihypertensive drugs. More importantly, the age of hypertensive patients was significantly higher than normal counterparts (p<0.05 in both females and males), which may lead to a higher mutation possibility and higher frequency of the G allele in hypertensive patients. While the age disparity between the patients and control group in other studies was not significant (p=0.850 for males and p=0.271 for females in Li et al.’s study, 13 p=0.724 for males and p=0.106 for females in Niu et al.’s study). 16 For rs56204867, omitting Li et al.’s study, could decrease the heterogeneity among studies without significant influence on pooled ORs as well (I2=0% in female G vs A analysis, I2=0% in female GG+AG vs AA analysis) (Figure 5). We noticed that Li et al. included antihypertensive drug users in the hypertension group and adjusted hypertension diagnosis by adding 15 and 10 mm Hg to the SBP and DBP, respectively. 20 Hence, the hypertensive group in this study may not be representative enough.

Combined forest plots of hypertension associated with the apelin gene (APLN) single nucleotide polymorphism (SNP) rs3761581 after omitting the study of Huang et al. 12 CI: confidence interval; EH: essential hypertension.

Combined forest plots of hypertension associated with the apelin gene (APLN) single nucleotide polymorphism (SNP) rs56204867 after omitting the study of Li et al. 20 CI: confidence interval; EH: essential hypertension.
Publication bias diagnostics
The funnel plots were used to evaluate the publication bias (Figure 6). Then, the Egger’s test was used to analyze the funnel plot asymmetry (Table 3 and Table 4). As was indicated in the result, no publication bias was found (all p>0.05).

Combined funnel plots of studies regarding association between apelin rs3761581, rs56204867 polymorphisms and hypertension risk.
Discussion
As an important ligand for APJ receptor, a G protein-coupled receptor, apelin (APLN) could regulate its downstream molecules and plays an important part in the occurrence and development of obesity, type 2 diabetes mellitus, hypertension, and other cardiovascular diseases. 5 The combination of apelin and APJ could stimulate its downstream Amp-activated protein kinase (AMPK) and PI3K/Akt signaling pathway, which induce regulators such as endothelial nitric oxide synthase (eNOS) and peroxisome proliferator-activated Receptor Gamma Coactivator 1-α (PGC1-α), to regulate the process of intestinal glucose absorption, mitochondrial biogenesis, and fatty acid oxidation. 8
It has been suggested that the apelin/APJ system could decrease blood pressure through nitric oxide (NO)-dependent pathway. 36 Moreover, apelin could activate its receptor APJ and increase ACE2 promoter activity. This upregulation of ACE2 expression could accelerate the hydrolysis of angiotensin II (Ang-II) in vitro.37,38 However, Apelin may also promote vasoconstriction and the elevation of blood pressure through directly activating the APJ on vascular smooth muscle cells (VSMCs) and phosphorylating myosin light chain (MLC). 39 Therefore, this gene is considered essential in controlling the prevalence and development of hypertension. This study concentrated on its two polymorphisms, rs3761581 and rs56204867, which are located in the promoter region of APLN. It is reasonable to think that this SNP locus may be correlated with the recognition and combination between transcription factors and the promoter region of APLN, and thus, influences the transcription and translation of this gene. Under the circumstances of mutation, variable expression of APLN may result in modulation of phenotypes, including blood pressure.
Our study included five studies in total, and is the first meta-analysis focusing on the association of apelin polymorphism and the prevalence of hypertension. For rs3761581, after integrating the data of both female and male, different alleles were not significantly associated with hypertension risk. Considering the localization of APLN on the X chromosome, the data was divided into a female subgroup and a male subgroup for further investigation. Our results revealed that the T allele of rs3761581 was not strongly correlated with a higher prevalence of hypertension in the female subgroup. We did not find a significant association of the ratios of GG+TG/TT, GG/GT+TT and the hypertensive risk in the dominant and recessive models of inheritance, respectively. In the male subgroup, there was no significant correlation of the frequency of the G allele with hypertension risk as well. Interestingly, we found the study of Huang et al. increased the heterogeneity among studies, which may be due to significant age disparity between patients and the control group. Higher age in the hypertensive group may lead to an increased possibility of mutation. Different regions of China and disparity in the recruitment of hypertension patients might be other primary factors leading to the high heterogeneity.
For rs56204867, the overall comparison of the G and A allele was not significantly correlated with the prevalence of hypertension. The frequency of the G allele was not highly associated with hypertension risk in female and male subgroups, respectively. The ratios of GG+AG/AA or GG/AG+AA did not show any high correlation with hypertension risk under the dominant and recessive models, respectively. The sensitivity analysis indicated that the study of Li et al. increased heterogeneity greatly. 20 We thought that the adjustment of the hypertension definition for hypertensive drug users and different participant recruitment criteria may be the reasons. Different regions of China and ethnic groups may be another leading factor as well.
For the studies based on Indian population and Mexican-Mestizo ethnic origin, the frequency of the mutated genotype or allele was significantly lower than that in Chinese population. For example, the study of Esteban et al. demonstrated that the frequencies of the rs3761581 G allele were 3.4% in female patients and 5.5% in normal counterparts, which was significantly lower than those in the Chinese population (both p<0.001). For rs56204867, the frequencies of the G allele were 2.9% and 5.5% in female patients and control group, respectively (both p<0.001). 10 The study of Gupta et al. reported that the frequencies of the G allele were 5.1% in female patients and 6.0% in female normal participants, 7.5% in male patients and 0.0% in male normal subjects (all p<0.001 when compared with Chinese population). 11 Since these two studies were based on a limited sample size with a low distribution level of mutated alleles, the association of the polymorphisms and hypertension remained elusive. The disparity of the genetic background of different populations in the worldwide may lead to different effects of apelin polymorphisms in predicting hypertension. Therefore, larger sample-size studies worldwide are still needed for a comprehensive evaluation.
Limitations
This study has some limitations. Two studies based on the Indian population and Mexican-Mestizo ethnic origin were not included in this meta-analysis considering the limited sample size and low frequency of mutation. Thus, this study is restricted to the Chinese population. The studies and sample size were limited. Further studies in China and in the worldwide are warranted for a more concise and comprehensive analysis.
Conclusion
In conclusion, this current meta-analysis revealed that there was no correlation between apelin polymorphisms, rs3761581 and rs56204867, and the prevalence of hypertension in China.
Footnotes
Acknowledgements
The authors are grateful to the staff at the NHC Key Laboratory of Radiobiology (Ministry of Health).
Declaration of conflicting interests
The author(s) declared no potential conflicts of interest with respect to the research, authorship, and/or publication of this article.
Funding
The author(s) disclosed receipt of the following financial support for the research, authorship, and/or publication of this article: This study was supported by the National Natural Science Foundation of China (NSFC) grants (grant number 31500682).