
Abstract
Population Health Management – often abbreviated to PHM – is a relatively new approach for healthcare planning, requiring the application of analytical techniques to linked patient level data. Despite expectations for greater uptake of PHM, there is a deficit of available solutions to help health services embed it into routine use. This paper concerns the development, application and use of an interactive tool which can be linked to a healthcare system’s data warehouse and employed to readily perform key PHM tasks such as population segmentation, risk stratification, and deriving various performance metrics and descriptive summaries. Developed through open-source code in a large healthcare system in South West England, and used by others around the country, this paper demonstrates the importance of a scalable, purpose-built solution for improving the uptake of PHM in health services.
Keywords
Introduction
Population Health Management (PHM) is an emerging new direction for healthcare services in many countries, where the planning of healthcare activity is driven by a more holistic view of health needs and the wider determinants of health.1,2 In England, it is increasingly referred to as the ‘golden thread’ for longer-term planning of the country’s public health service.3–5 PHM requires the relatively novel practical use of analytical techniques and technologies to interpret large quantities of clinical, demographic, socioeconomic and lifestyle data; encouraging collaboration between healthcare services in designing and implementing targeted interventions at either the population, place or person level. 6
Many healthcare systems are under increasing pressure from ageing populations, workforce constraints, and decreasing real-term budgets.7,8 Ultimately, systems must operate more efficiently if they are to maintain the same level of care to patients or make meaningful improvements. PHM supports this through promoting data-driven approaches that can enhance population health outcomes while reducing the costs to the healthcare provider – essentially increasing the ‘value’ of care provided to the patient.9,10 While the exact definition of PHM used in the literature and by healthcare systems varies, several key analytical approaches appear to be shared between them: population segmentation, risk prediction and stratification, and descriptive analyses of patient healthcare interactions.11–13
Successful PHM requires system engagement and data maturity, with a first task for stakeholders often being the identification of the requisite datasets to address the considered issue or question in hand. 14 For most PHM tasks, data is needed at patient level (i.e., not aggregated) and is required to be linkable across various datasets (e.g., patient activity and patient attribute datasets), typically through some common unique patient identifier. 15 While healthcare systems are being encouraged to develop linked datasets – indeed every system in England is required to have linked data by 2023 16 – the volume and complexity of such data can be difficult to analyse and make sense of. 17 In this respect, and to help support the shift towards PHM, healthcare analysts, decisions makers and clinicians would benefit from the appropriate analytical tools to facilitate key PHM activities.
Historically, there has been a competency gap in England’s publicly-funded National Health Service (NHS) regarding certain aspects of analytical and visualisation skills required for effective PHM. 18 This deficit has led to the involvement of independent sector consultancies offering time-limited solutions for bespoke PHM projects or pieces of work. 19 However, these efforts have rarely featured development and application of purpose-built and reusable tools to support the longer-term use of PHM, and have instead concentrated around existing reporting requirements, which may not consider wider determinants of health and other sources of information regarding health inequalities.20,21 Alongside sporadic collaboration with frontline analysts, these one-off and often costly exercises have not generally endeared a sustainable approach to PHM. 22 Yet the need for successfully embedding PHM is particularly prescient given the recent move in England to Integrated Care Systems on 1 July 2022. 23
For PHM to be successful, and achieve its ‘golden thread’ status in NHS planning, we propose that healthcare systems need purpose-built, reusable, and scalable solutions for efficiently employing PHM in day-to-day, business-as-usual work. To such end, this paper details the design, functionality and use of an interactive tool developed to provide healthcare systems with a cost-free and accessible solution for implementing the key PHM analytical activities. The tool, which has been developed over 18 months with clinicians and managers within a major healthcare system, has since been used to support a variety of PHM projects and has been shared with and used by other healthcare systems in England’s NHS. While the tool has been developed in the NHS in England and primarily promoted to NHS healthcare systems, its genericity in capturing key PHM activities could facilitate wider use in other geographies.
Methods
PHM analytical approaches
Population segmentation uses information about individual patients, such as age and sex, to divide a population into similar groups 24 ; typically with the aim of identifying population cohorts with similar healthcare needs. 25 Wood et al 26 used primary and secondary care data for segmenting a 51,072 population by annual healthcare spend. The study recommended the use of classification and decision trees, which were found to be the most intuitive and conceptually appropriate approach for exploring and defining population segments. Other studies have focused on smaller population cohorts. In Singapore, 928 elderly patients were segmented using baseline survey data, as defined by four predefined population segmentation schemes, with segments able to satisfactorily predict health outcomes and healthcare utilisation over the next 180 days. 27 Van et al 28 demonstrated that adopting a shielding strategy for COVID-19 based on segmentation of the population could limit the risk of a new wave of infection while also increasing the opportunity to partially exit COVID-19 lockdown.
Risk stratification assigns patients into risk strata or levels by using objective or subjective data 29 often to predict health outcomes or healthcare needs. 30 These predictions can be used to tailor proactive clinical care or to install preventive measures. For example, in Brighton, UK, a study found that for unplanned hospital admissions among the homeless population, tri-morbidity (defined by chronic physical illness, mental illness, and alcohol/drug misuse) was a significant risk factor. In addition, it also provided suggestions for the development of a risk stratification tool to identify ‘at risk’ individuals from this population. 31 In Ohio, USA, a practice used risk stratification as part of the Comprehensive Primary Care Plus programme to reduce overall Medicare spending on patients by 23%, as well as to decrease Emergency Department (also known as Accident and Emergency, or A&E) utilisation by 19%. 29 In Valencia, Spain, population segmentation was used by the ValCrònic programme to stratify patients in four health centres, then deliver a highly tailored telemonitoring and education intervention to those considered high-risk. This reduced the use of emergency primary care services by 51%, and emergency acute care by 32% compared to the year before. 32 At the start of the COVID-19 pandemic, Kenward et al 3 used risk stratification to identify population groups most at risk, as well as to identify and recommend high-risk individuals for shielding. Using chronic conditions, historical healthcare utilisation and socioeconomic status, this process uncovered six distinct clusters that comprised the high-risk population. The identified characteristics allowed a more tailored response for individuals requiring shielding.
Another analytical approach in the PHM toolkit is using relatively novel illustrative techniques to aid descriptive analyses. Theographs (also known as theoplots) are patient-level visual representations of patient points of contact in the healthcare system, plotted over time. Theographs can be used to view system-wide patient interactions and identify otherwise undetectable patterns of behaviour, 33 from which tailored interventions can be realised. For example, frequent A&E attenders may have patterns of behaviour that precede the A&E attendances, which if targeted could reduce the chance of subsequent emergency admissions. Berkshire West Integrated Care System has used theographs to monitor high intensity patients. 11 Theographs can help care professionals to identify patterns of events that appear to be concerning, or gaps in care. 34
Scoping and design principles
Before considering a solution capable of facilitating the above analytical techniques, it is firstly important to understand the wider context in which any such tool could be used. This involved assessing and reflecting upon the (at the time) current analytical and PHM maturity of healthcare systems, as well as considering how PHM can address the various strategic needs of target users and stakeholders within those healthcare systems.
Healthcare systems in the NHS have been inconsistently developed with regard to applying PHM, with some mature in their practices and others only just beginning to initiate their programmes.5,35 While PHM case studies have been generated, many of these – as mentioned in Introduction – are undertaken with the support of external management consultancies. 22 This has been, in part, due to a lack of analytical capacity and skills within the NHS, 36 meaning the uptake of open-source software and operational research and data science techniques has lagged behind other sectors. 37 The fragmentary and ‘siloed’ nature of the analytical community has been a likely contributor, leading to limited opportunities for teams to access specialist skills and share learning. 38
However, there has been a growing sentiment and desire to improve analytics within the NHS. The authors delivered an ‘Introduction to PHM’ workshop at the 2019 conference of the NHS-R Community, set up in 2018 to promote the use of the statistical programming language ‘R’ within the NHS. During this session, an anonymous survey was conducted, revealing an overwhelming interest in an R-based PHM tool, with 31 out of 33 attendees responding affirmatively to the question: “Would an R-based PHM analytics suite be valuable to you or your organisation?”. Only two of these 31 attendees described their own system’s PHM maturity as “high”, with all other responses ranging from “none” to “medium”, thus indicating a large pool of potential end-users of the tool. The majority of attendees (88%) voluntarily provided their emails to add to a mailing list should such a tool be developed (the survey and results are available at the permanent repository: https://github.com/nhs-bnssg-analytics/ExploreR).
Following various observations and discussions from the ‘Introduction to PHM’ workshop, several initial design principles were identified as important for the PHM tool: • Shaped by user need: in order to ensure fitness for purpose, the tool’s design and development must be influenced by feedback from target users, such as operational analysts and planners, General Practitioners (GPs, also known as family doctors), clinical leads, and public health specialists. • Key method functionality: the tool must facilitate the key PHM analytical techniques, such as population segmentation, risk stratification, and various descriptive analyses (Methods; PHM analytical approaches). • Ease-of-use: reflecting that many clinicians and managers lack analytical skills to perform complex data queries, the tool must be implemented in a way that can provide users with answers in as few steps as possible, through an easy-to-follow user interface. • Alignment to linked data: as linked data is essential for PHM, the tool should conveniently align to linked dataset formats that commonly exist within healthcare systems (typically this involves an ‘attributes’ and ‘activity’ dataset – more detail in Methods; Development within the BNSSG healthcare system). • Accessibility: as well as being coded in ‘R’, the tool should be developed and promoted in a way that appeals to various users and healthcare systems, in containing as few barriers to access as possible. • Flexible and adaptable: the tool should be able to be modified to meet any specific user needs and to ensure any necessary maintenance upgrades to comply with the latest software version.
Development within the BNSSG healthcare system
The development of the tool took place in the Bristol, North Somerset and South Gloucestershire (BNSSG) Integrated Care System (ICS) by the team based at the ICS’s Integrated Care Board (ICB). The ICS represents a large network of healthcare providers covering primary care, secondary care, mental health care, community care, and social care. This system serves over one million residents across urban, rural and coastal areas. Bristol, a large metropolitan area, contains a higher proportion of younger individuals and has a culturally and ethnically diverse demographic, whereas coastal and rural areas have a generally older population.
Early PHM efforts in the BNSSG system began in 2017, with linkages of secondary care data and subsequent segmentation of secondary care spend by age, sex and deprivation. This basic analysis provided a proof of concept that led to a 2018 pilot project linking secondary care data with primary care data for five GP practices. This, in turn, was scaled up to include each of the 72 GP practices in the BNSSG system and expanded to include mental health and community care datasets. This became the System Wide Dataset (SWD), which went live in August 2019. Further extensions were made in 2020, including the introduction of 111 (non-emergency phone calls) and 999 (emergency calls and ambulance) data. Several PHM studies have been reported which benefited from access to SWD data.3,39,40
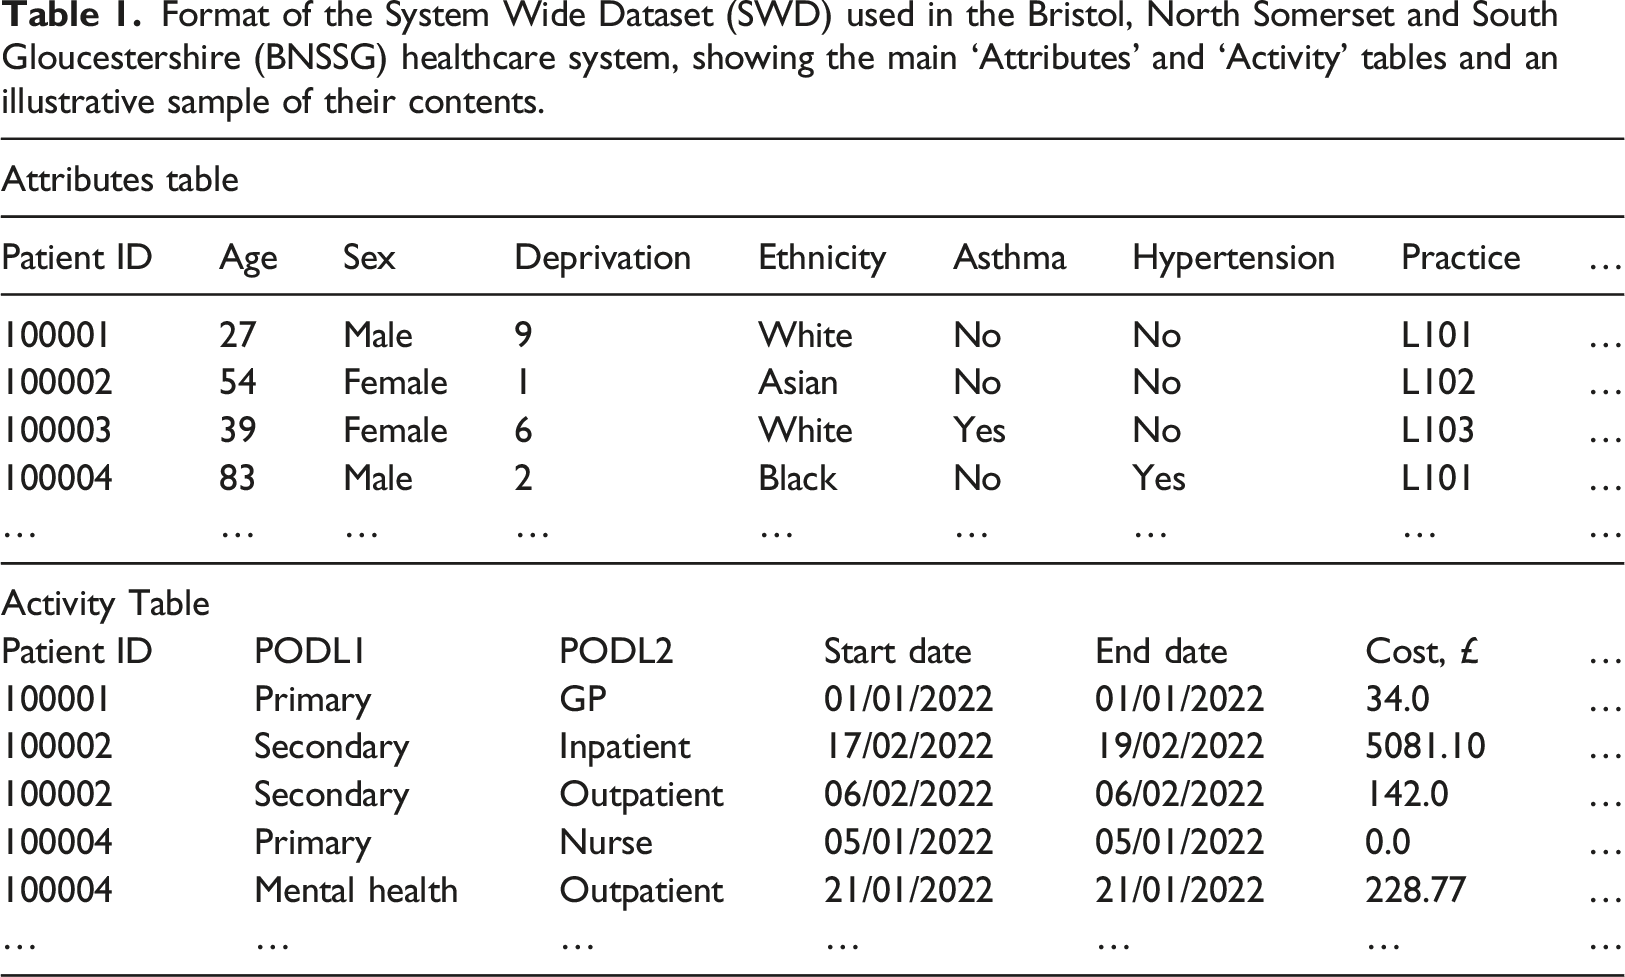
Format of the System Wide Dataset (SWD) used in the Bristol, North Somerset and South Gloucestershire (BNSSG) healthcare system, showing the main ‘Attributes’ and ‘Activity’ tables and an illustrative sample of their contents.
The project began in late 2020, during a relatively intense phase of the pandemic for local healthcare services. While this limited the availability of clinicians and managers, an ongoing PHM programme was leveraged to extract from stakeholders the key user needs, which provided sufficient insight for the development of a first version of the tool. Based on feedback from within BNSSG and in other healthcare systems with which the ‘beta’ version was shared, the tool (Methods; The PHM ExploreR tool) was refined and then publicly released in November 2021 at a dedicated workshop during the 2021 NHS-R Conference. Of the 14 attendees who responded to the anonymous survey following the workshop, 13 of these (93%) agreed that the tool “is user friendly” and “would be specifically useful to my work”, thus providing some support to achievement of the design principles concerning ‘key method functionality’ and ‘ease-of-use’ (the survey and results are available at the permanent repository: https://github.com/nhs-bnssg-analytics/ExploreR). The tool was also presented in dedicated sessions at two regional seminars, with the Midlands Analysts Network (54 attendees) and the East of England PHM Analytical Development Network (74 attendees). Feedback from these events, alongside that received through 1:1 sessions with other interested parties, was used to make a number of adjustments to improve navigation and user experience and to accommodate the needs of less technical users. The final version of the tool was publicly released in March 2022 and is available at the permanent repository: https://github.com/nhs-bnssg-analytics/ExploreR.
Information governance is an important part of working with patient-level data. Use of such individual data is, in the UK, like many countries in Europe, governed by the General Data Protection Regulation, commonly known as GDPR. 42 This sets out requirements for those who own the data (‘Data Controllers’) and those who use it (‘Data Processors’). In the data sharing agreements overseeing use of the SWD within BNSSG, the ICB acts as a Data Processor in order to analyse the patient-level data provided to it from each of the Data Controllers: the GP practices (primary care), NHS Digital (secondary, mental health and community care), and the local authorities (social care). As required under GDPR, a specific legal basis is needed for processing data. Given the overarching system planning role of an ICB, data is mostly used under GDPR Articles 6(1)(e) and 9(2)(h), which cover the management of health and social care services. Also reflecting this role, and the according lack of usual need to identify individual patients, all unnecessary personal identifiers in data provided to the ICB are removed, and the NHS number (which acts as the unique patient identifier, per Table 1) is ‘pseudo-anonymised’. For any direct care purposes, such as targeted healthcare interventions to patient cohorts identified through the tool (not covered in the examples presented here, in Results), the pseudo-anonymised identifiers would need to be reversed, to reveal the actual NHS numbers, which may thereafter be securely passed to clinicians in the relevant healthcare setting for identifying the patients. In NHS organisations, it is typical for Commissioning Support Units (CSUs) to provide services for anonymising and deanonymising the personal data contained in data flows between the ICB and data providers.
The PHM ExploreR tool
To fulfil the outlined design principles (Methods; Scoping and design principles), the analytical tool – named the PHM ExploreR – was developed as a self-contained program, coded in open-source ‘R’ and with a graphical user interface written in ‘R Shiny’ – the R package used to provide interactive user front-ends. 43 Specifically, coding in R supported the design principles to be ‘accessible’ and ‘flexible and adaptable’, given the substantial R user base in the NHS and the ability to readily customise code written in this language. By ensuring that new techniques and functionality can be added by future users, this guards against the tool losing relevance as the PHM field evolves.
The input data requirements were based on the structure of the BNSSG System Wide Dataset (SWD), which, as previously mentioned, is known to align to the format of other linked datasets from healthcare systems within the NHS. Specifically, the user is required to provide data in an ‘Attributes’ table and an ‘Activity’ table, as per the descriptions provided in Table 1. In terms of user experience, the tool was designed as a dashboard with non-linear navigation. The user must first define a population of interest, and he/she may define a specific population cohort by filtering from the uploaded dataset according to various criteria relating to fields contained in the Attributes table (e.g., age, sex, chronic conditions, or combinations thereof). This represents the entirety of the data thereafter analysed within the tool. Upon such specification, the user is taken to a landing page where he/she can navigate to the various pages within the tool relating to the key PHM analytical approaches described in Methods; PHM analytical approaches. As well as navigating between these approaches, the tool is also able to use the outputs of one as inputs to another. For instance, a population segmentation obtained by the user can then be taken as the basis of a descriptive analysis (e.g., illustrating levels of multimorbidity or healthcare use through segments defined by age and sex). Or theographs can be constructed for the highest risk patients as determined from the risk stratification function. The full range of navigation within the tool is summarised in Figure 1. Navigation of the PHM ExploreR tool. The wide horizontal boxes denote the sections of the tool (the names of each are on the left side). Each small text-containing box represents a specific page within the tool. Lines and arrows describe the ways in which users can navigate between each page.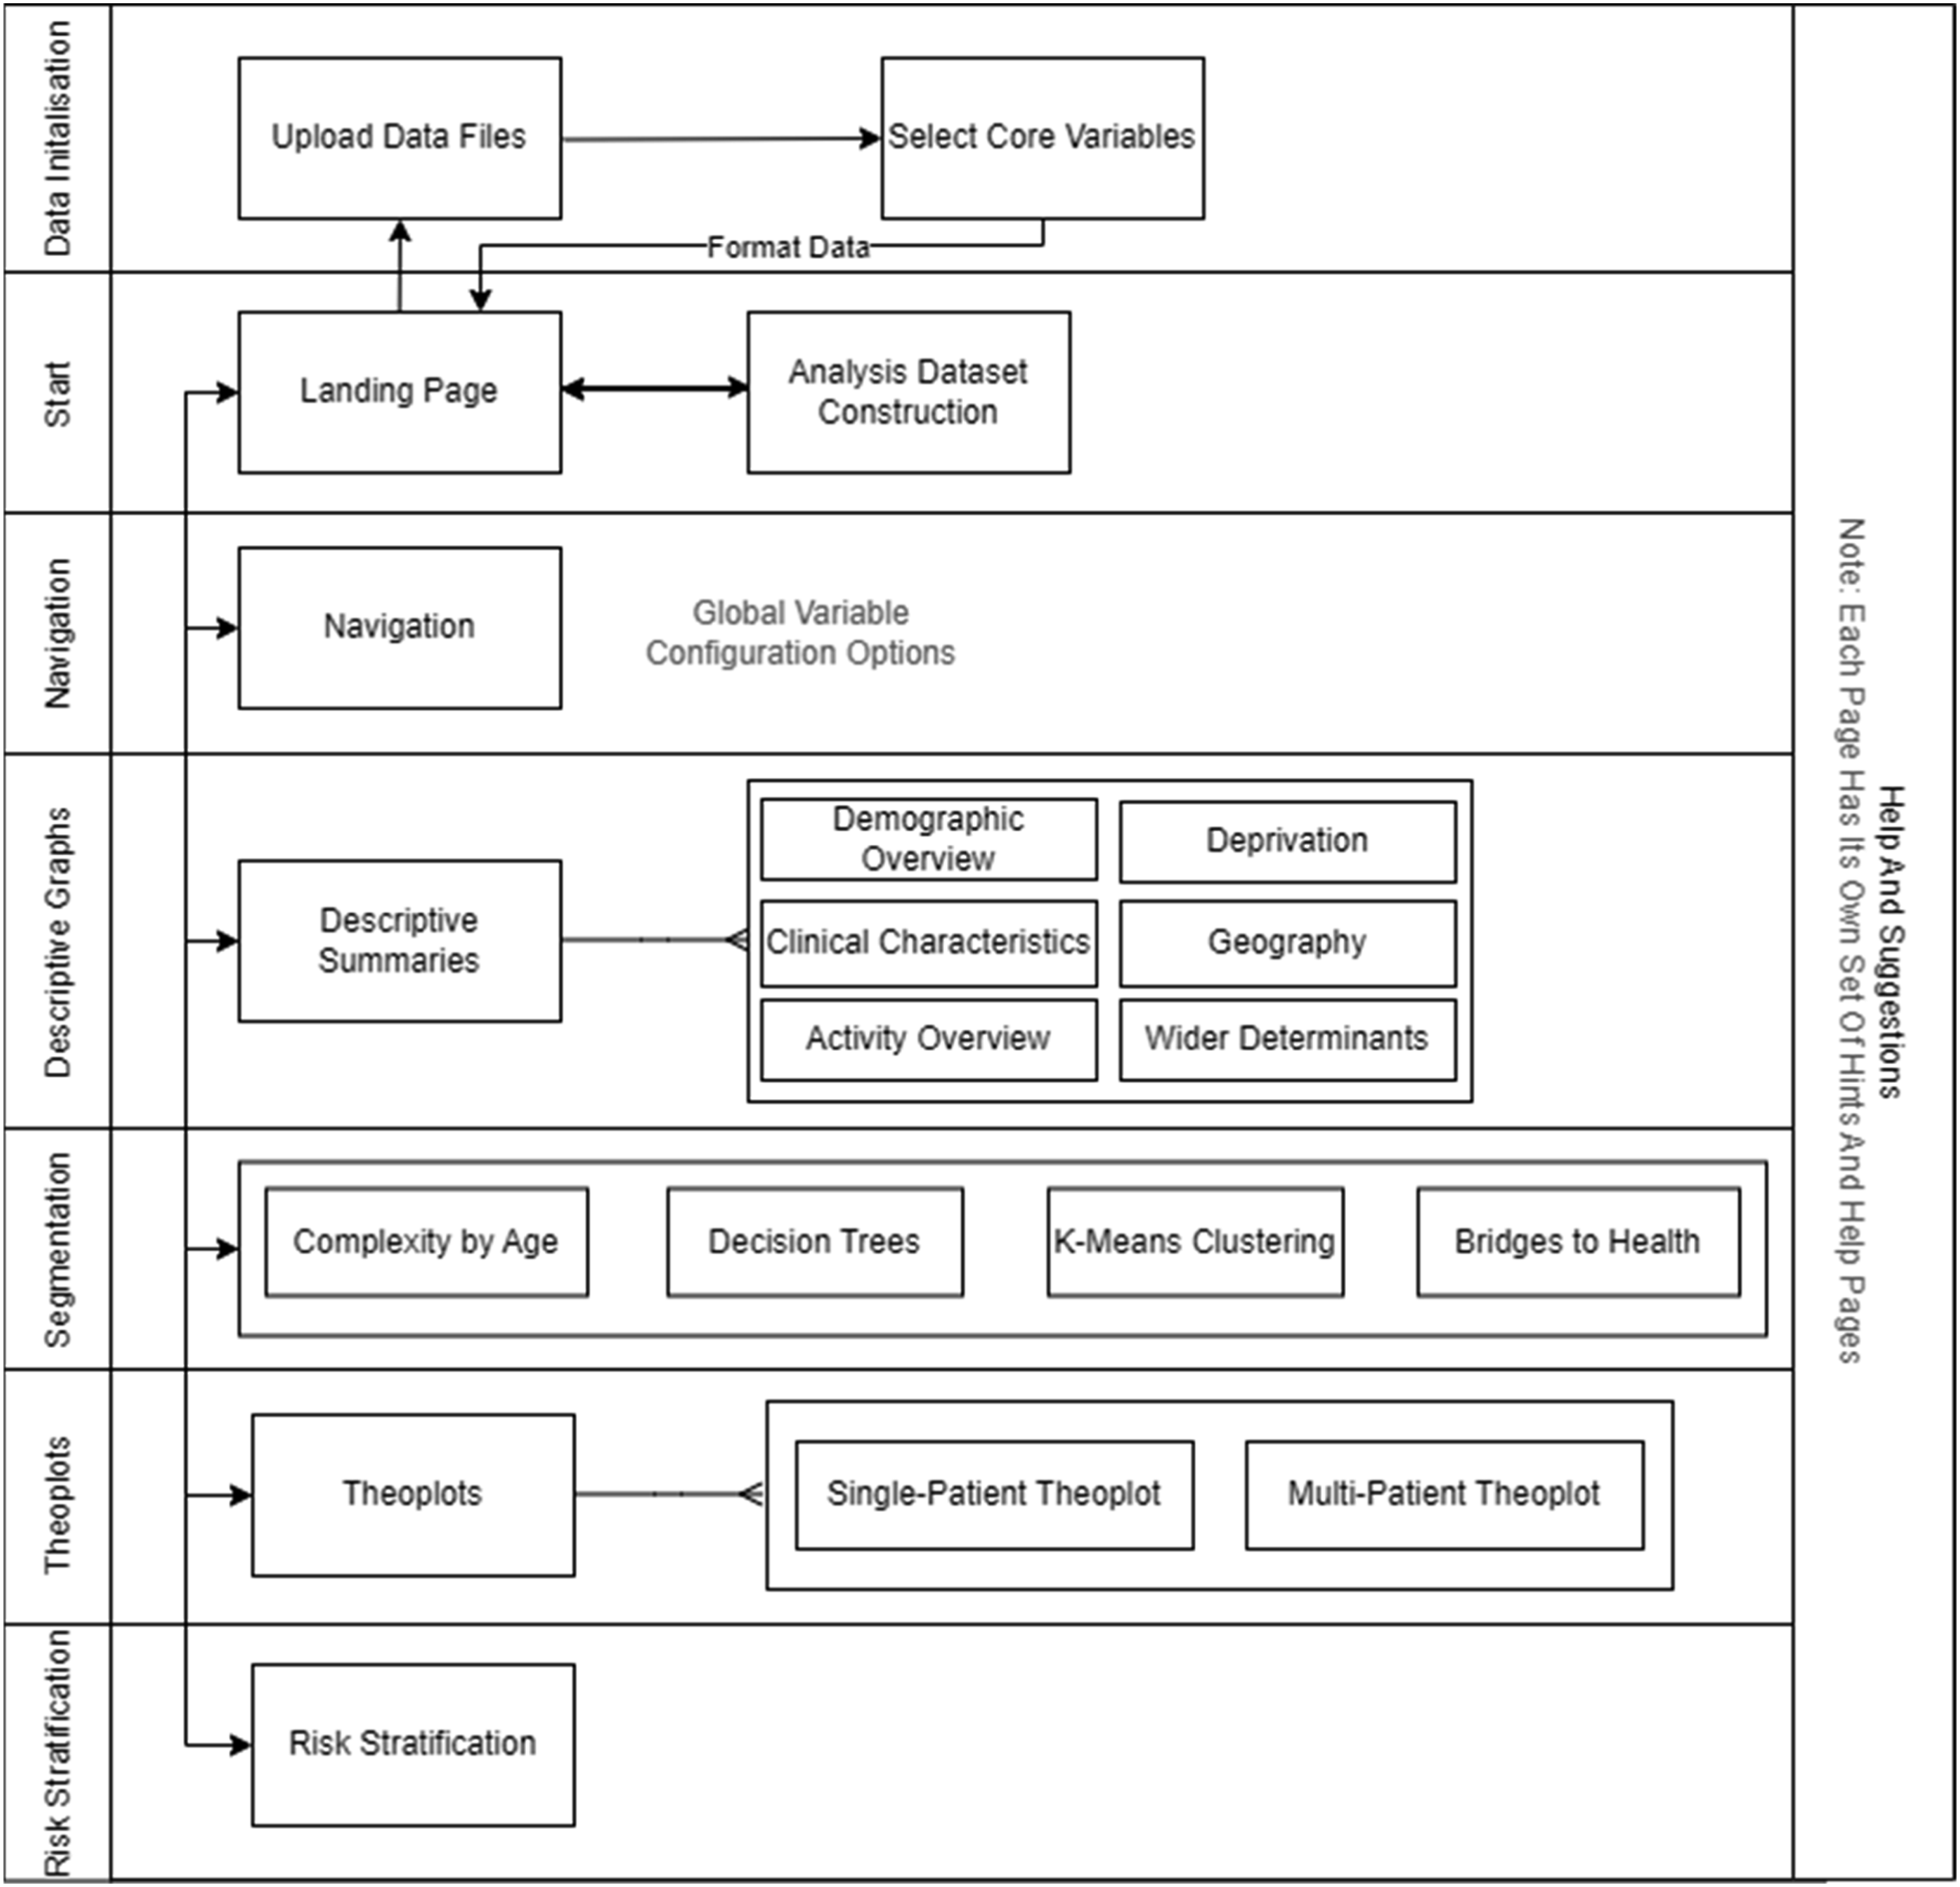
Results
Presented here are a number of case studies illustrating practical use of the PHM ExploreR tool for live projects undertaken within the BNSSG healthcare system.
Cohort identification for reducing healthcare spend in older individuals
Objective
The ‘Place Development Programme’ is a national PHM initiative to accelerate the design of place-based approaches to improving population health. 23 In addressing the ‘ageing well’ part of this programme, clinical leads turned to the PHM ExploreR tool with the aim of finding a suitable population cohort to target in reducing healthcare resource use with advancing age. The cohort would need to include people who are on a trajectory to high resource use and be appropriately sized to both have an impact on the healthcare system and remain readily targetable with intervention (size considered to be approximately 1000-3000 individuals).
Approach
A decision tree approach was taken, using annual secondary care cost per patient as the primary metric by which the population was segmented. Decision trees were used as they can quickly produce segments based on intuitive or easy-to-understand criteria while also maximising intersegment heterogeneity.
26
Over the course of several weeks, a number of clinicians, GPs and external management consultants met regularly to discuss the results of the segmentation and to review the characteristics of each group. This led to decisions on which attributes were then included or excluded within subsequent iterations of the segmentation. Gradually, the starting cohort of the 50+ years old population was reduced to 1920 individuals designated as amenable for intervention to mitigate escalating healthcare need. Use of the tool, to this end, was driven by the developer but involved independent use by one of the GPs and supervised use by the management consultants (due to information governance restrictions). Ultimately, the cohort was defined as individuals aged 50 to 65 with at least one chronic condition or repeat polypharmacy, up to three non-end-of-life chronic conditions and up to four repeat polypharmacy. Figure 2 presents one of the decision trees obtained during this process. According to the decision tree, Repeat Polypharmacy, Age, and the Number of Chronic Conditions are most significant in explaining the largest differences in annual secondary care cost. Decision tree indicating the branches on patient attributes that yield most discrimination in annual secondary care cost (mean values shown in rectangles for each segment) for those aged 50 years and over.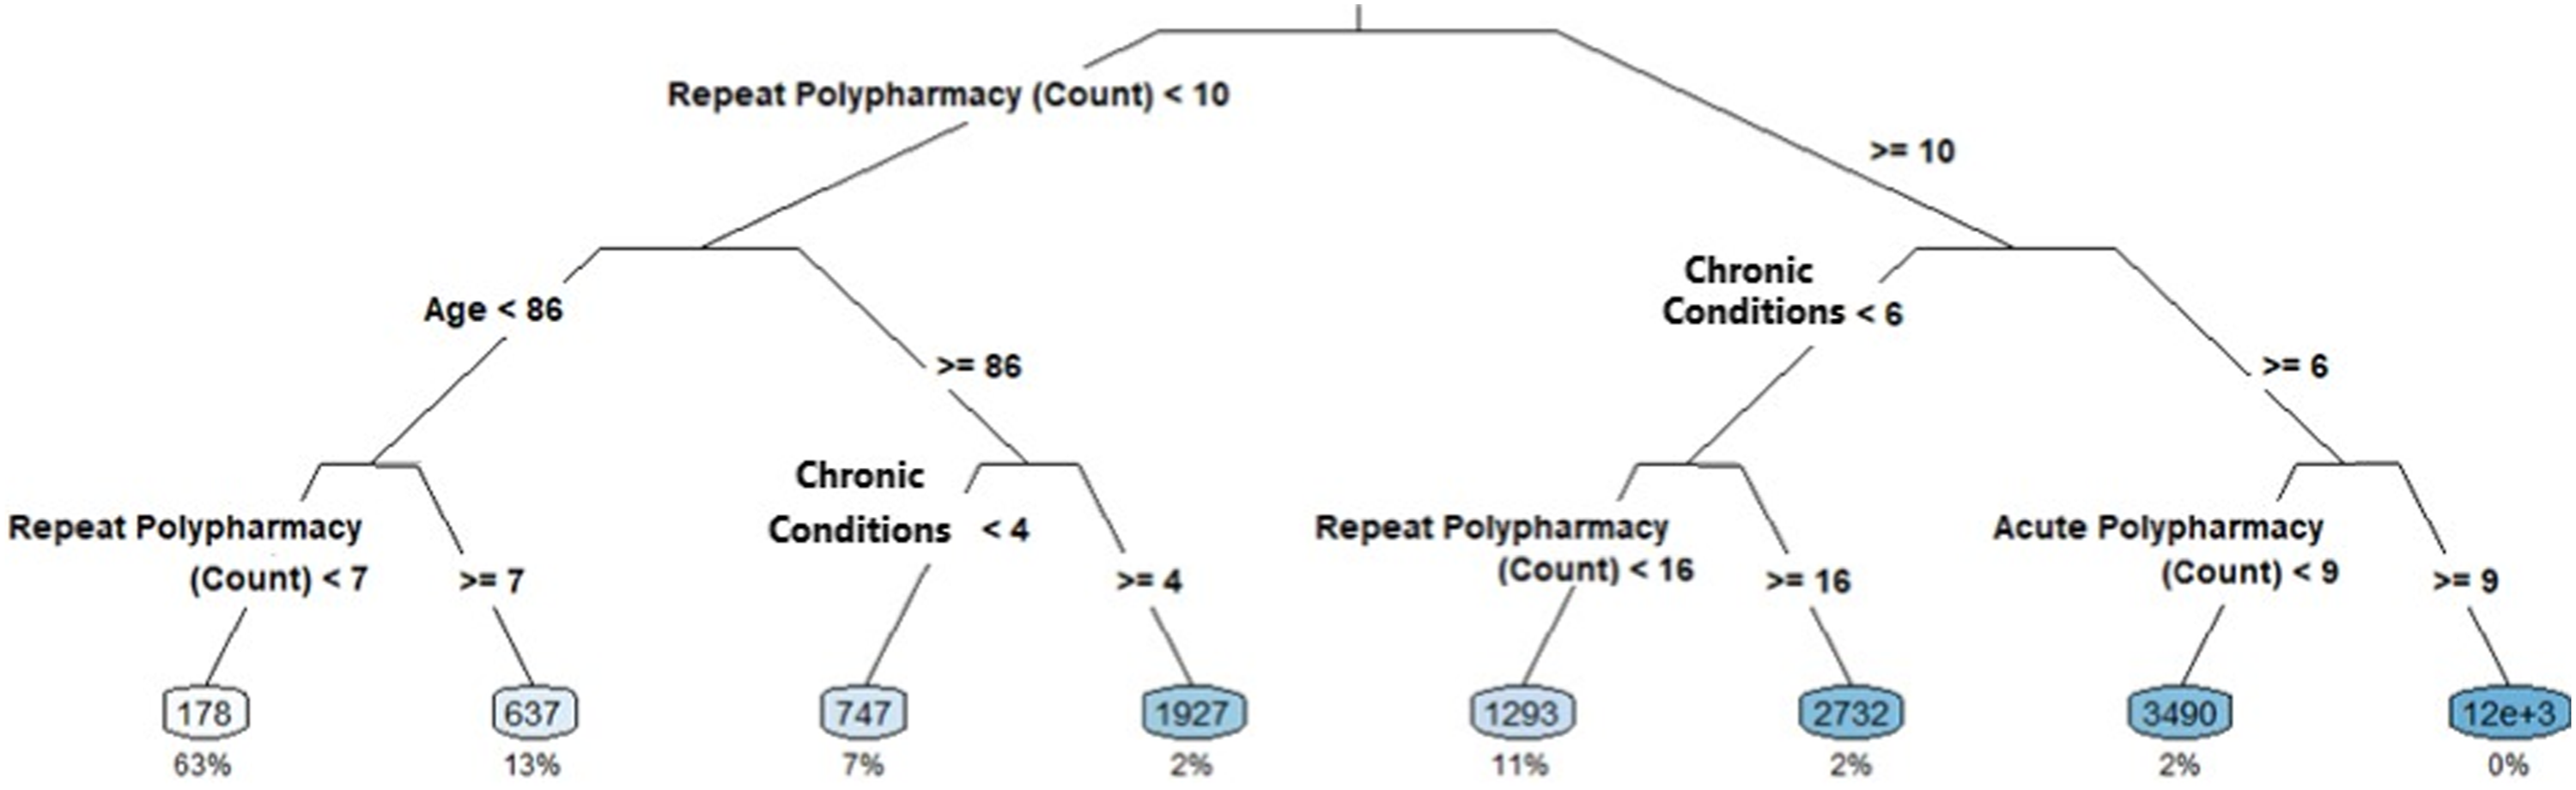
Outcomes
The project demonstrated the value of a self-contained tool that can be used without the need for end-users to implement advanced statistics or computer coding. Although analysts at the healthcare system were developing in these aspects, many (like others in the NHS) struggle to implement decision trees from scratch and within typical timeframes required. 18 Without the tool, the more familiar but simplistic manual approaches would likely have been used, involving clinician intuition and arbitrary cut-offs on common (but not necessarily statistically significant) variables like age, sex and chronic condition count. A particular benefit of the tool was the ability to quickly explore different decision trees on-the-fly within meetings, allowing experimentation and ultimately facilitating quicker progress.
Investigating interactions between social care and involuntary mental health hospitalisation
Objective
Introduction of social care data into the BNSSG System Wide Dataset brought with it the possibilities to consider analysis not just of NHS activity but also that of social care services provided by the local authorities. Following executive-level discussion between local authority social care and ICB finance, a request was made to investigate health and care activity of patients who were involuntarily hospitalised (or ‘sectioned’, in common parlance in the UK) under the 1983 Mental Health Act – a high-cost process that is disruptive to the patient. Specifically of interest were the interactions between NHS and social care providers, and the identification of opportunities to reduce cost and improve patient outcomes.
Approach
The cohort of interest was defined as individuals who had section-related events recorded in the social care data from 1 March 2020. Led by the developer, the tool was used to generate theographs to visualise patient journeys, instead of tabulating the information, given their ability to readily identify patterns or trends in patient activity across various health and care settings. A combination of single and grouped theographs were used in the analysis, while restricting the displayed activity points to only those care settings relevant to the scope of the question; namely community care, secondary care non-elective admissions, mental health, and section-related social care activity. Here, 20 of the 100-patient cohort are described through an individual theograph for one patient (Figure 3) and a grouped theograph for the remaining 19 patients (Figure 4). Individual theograph summarising healthcare interactions for one patient who had received involuntary mental health sectioning (the red point in July 2021). Grouped theograph summarising healthcare interactions for 19 patients who had received involuntary mental health sectioning (the red points).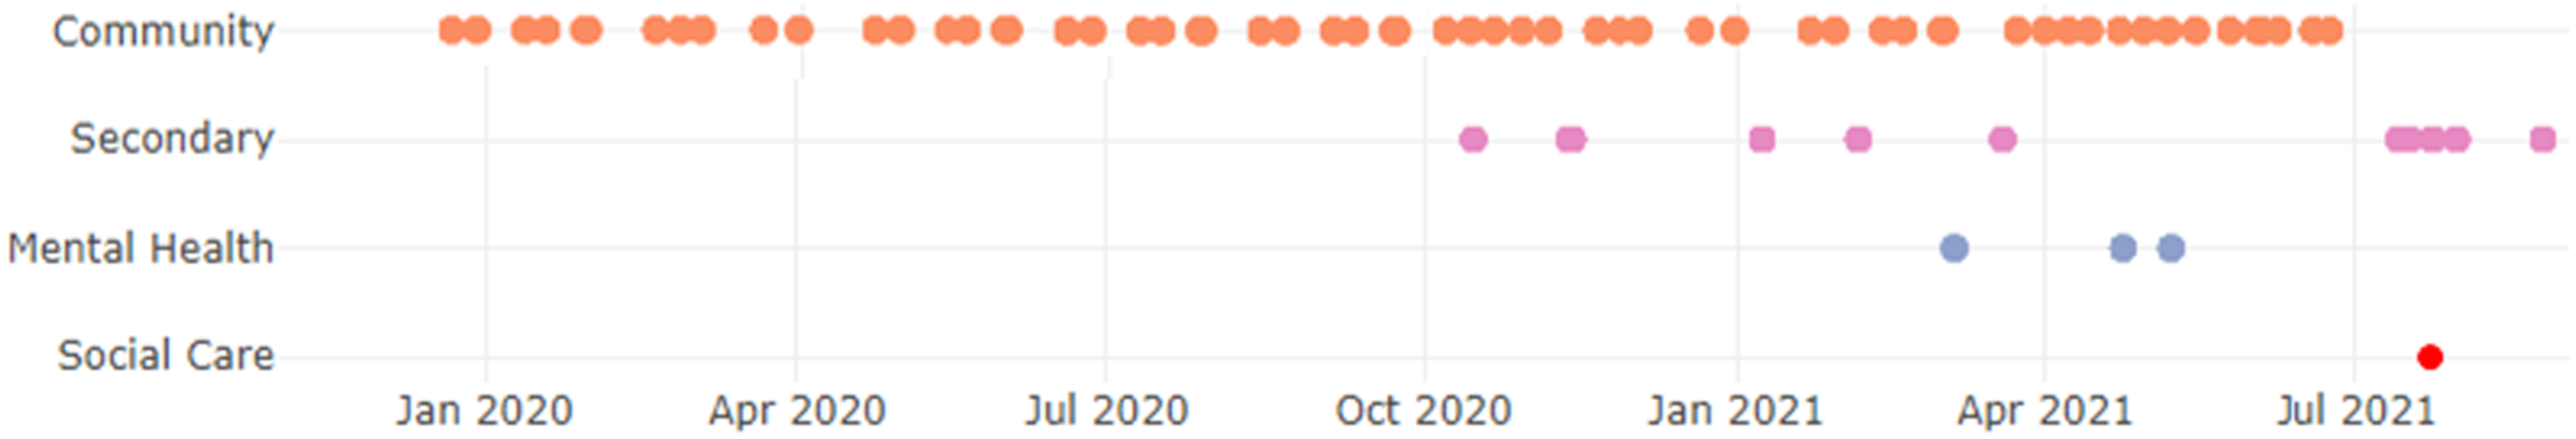
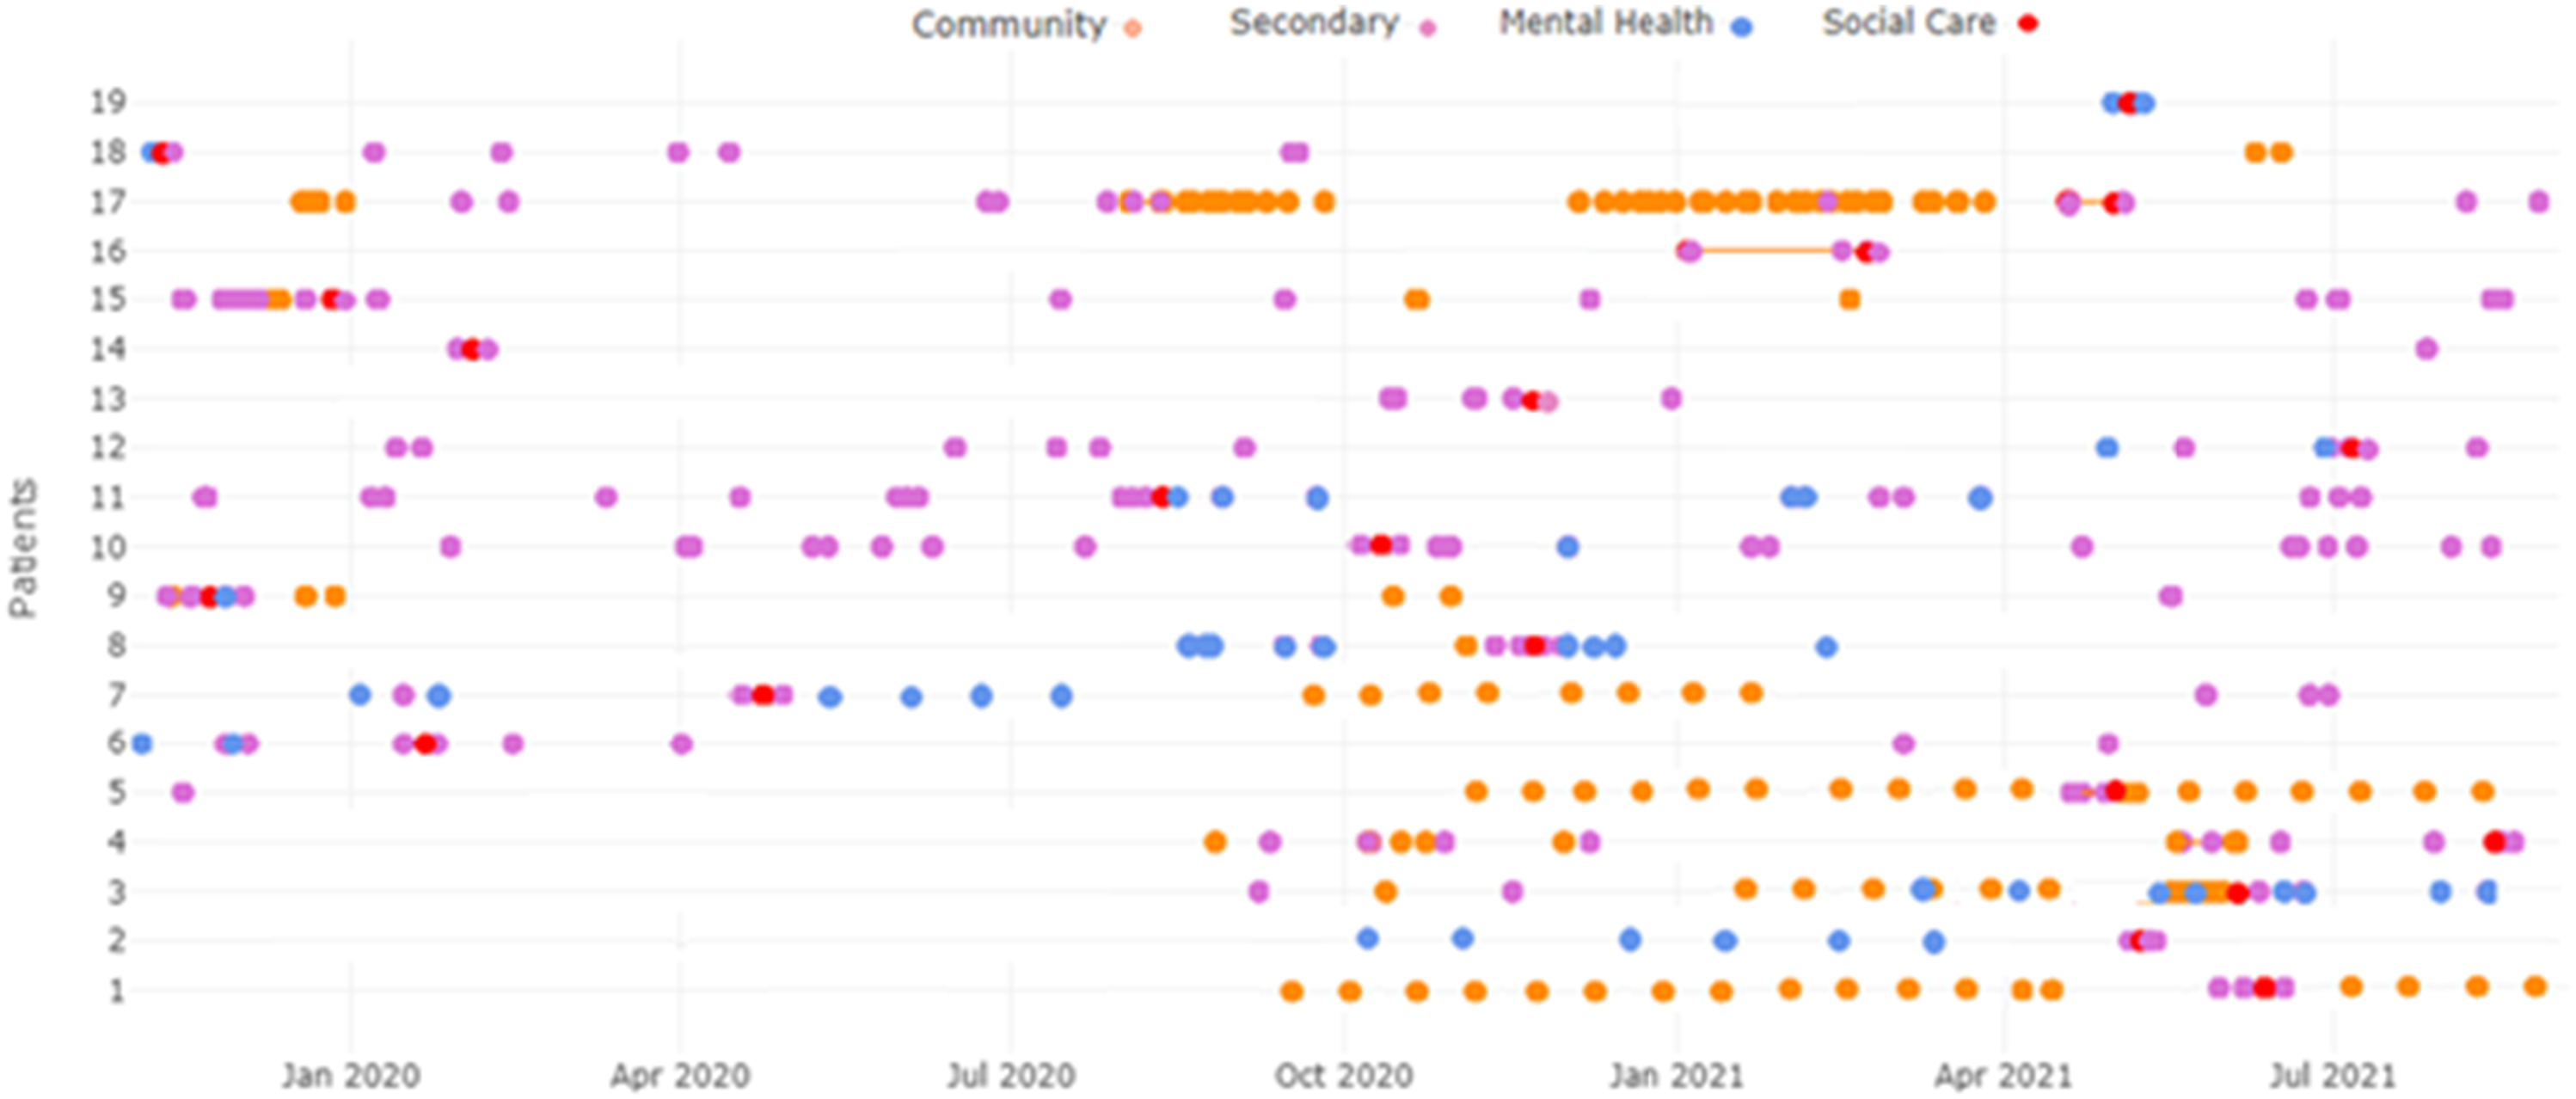
Outcomes
Given the exploratory nature of this project, most attention was on illustrating various patient ‘journeys’ for developing an understanding of patient-healthcare interactions prior to sectioning. Figure 3 shows one example. Regular community activity was recorded for this patient prior to October 2020 with no other activity from the considered care settings. From October 2020, the patient had various non-elective admissions, preceding contacts with the specialist mental health provider from March 2021, which initially seemed to avert further admissions. Prior to the patient being sectioned in July 2021, there was no specialist mental health care in over 2 months and regular community care had ceased 4 weeks prior: factors which may be causative. Figure 4 shows the healthcare activity of the remaining 19 patients in the cohort, including the section event which follows from either a specialist mental health or secondary care non-elective admission. Analysis of these plots reveals a similar pattern which could precede the need for sectioning, specifically a reduction in otherwise regular activity. For instance, patients 1 and 2 both receive a break in their respective community and mental health care activity prior to the section event. Further investigation could determine whether additional outpatient or home-based community and mental health care could lower net costs through reducing the need for sectioning.
Identifying potential sources of inequality in COVID-19 vaccination uptake
Objective
National guidelines expect local healthcare systems to identify and address factors contributing to unequal access or uptake of healthcare resources. 23 In particular, clinical leaders at the ICB detected a lower uptake of COVID-19 vaccination in the 25–29 years age group not considered to be ‘at significant risk’ from infection, after individuals of all ages had been offered two vaccine doses. The task was to identify which personal attributes may be accounting for this discrepancy.
Approach
Decision trees were first used to identify which patient attributes were explanatory of differences in vaccine uptake within the 25–29 year old low-risk cohort, revealing ethnicity and polypharmacy to be statistically significant (at the 0.01 level). These were then plotted against the number of doses received to understand how each cohort differs (Figure 5). Nine in ten of the polypharmacy cohort had received two doses (upper yellow bar), compared with only one in ten for those without polypharmacy (lower yellow bar). Being White was associated with the highest vaccine uptake, with greater proportions unvaccinated for Black and Asian ethnicities. These findings were generated through the tool by an analyst manager, who had not been involved in tool development. COVID-19 vaccination uptake in the BNSSG 25–29 years bold population, illustrating differences in proportional uptake between individuals with and without recorded acute polypharmacy (upper graph) and across different ethnic groups (lower graph).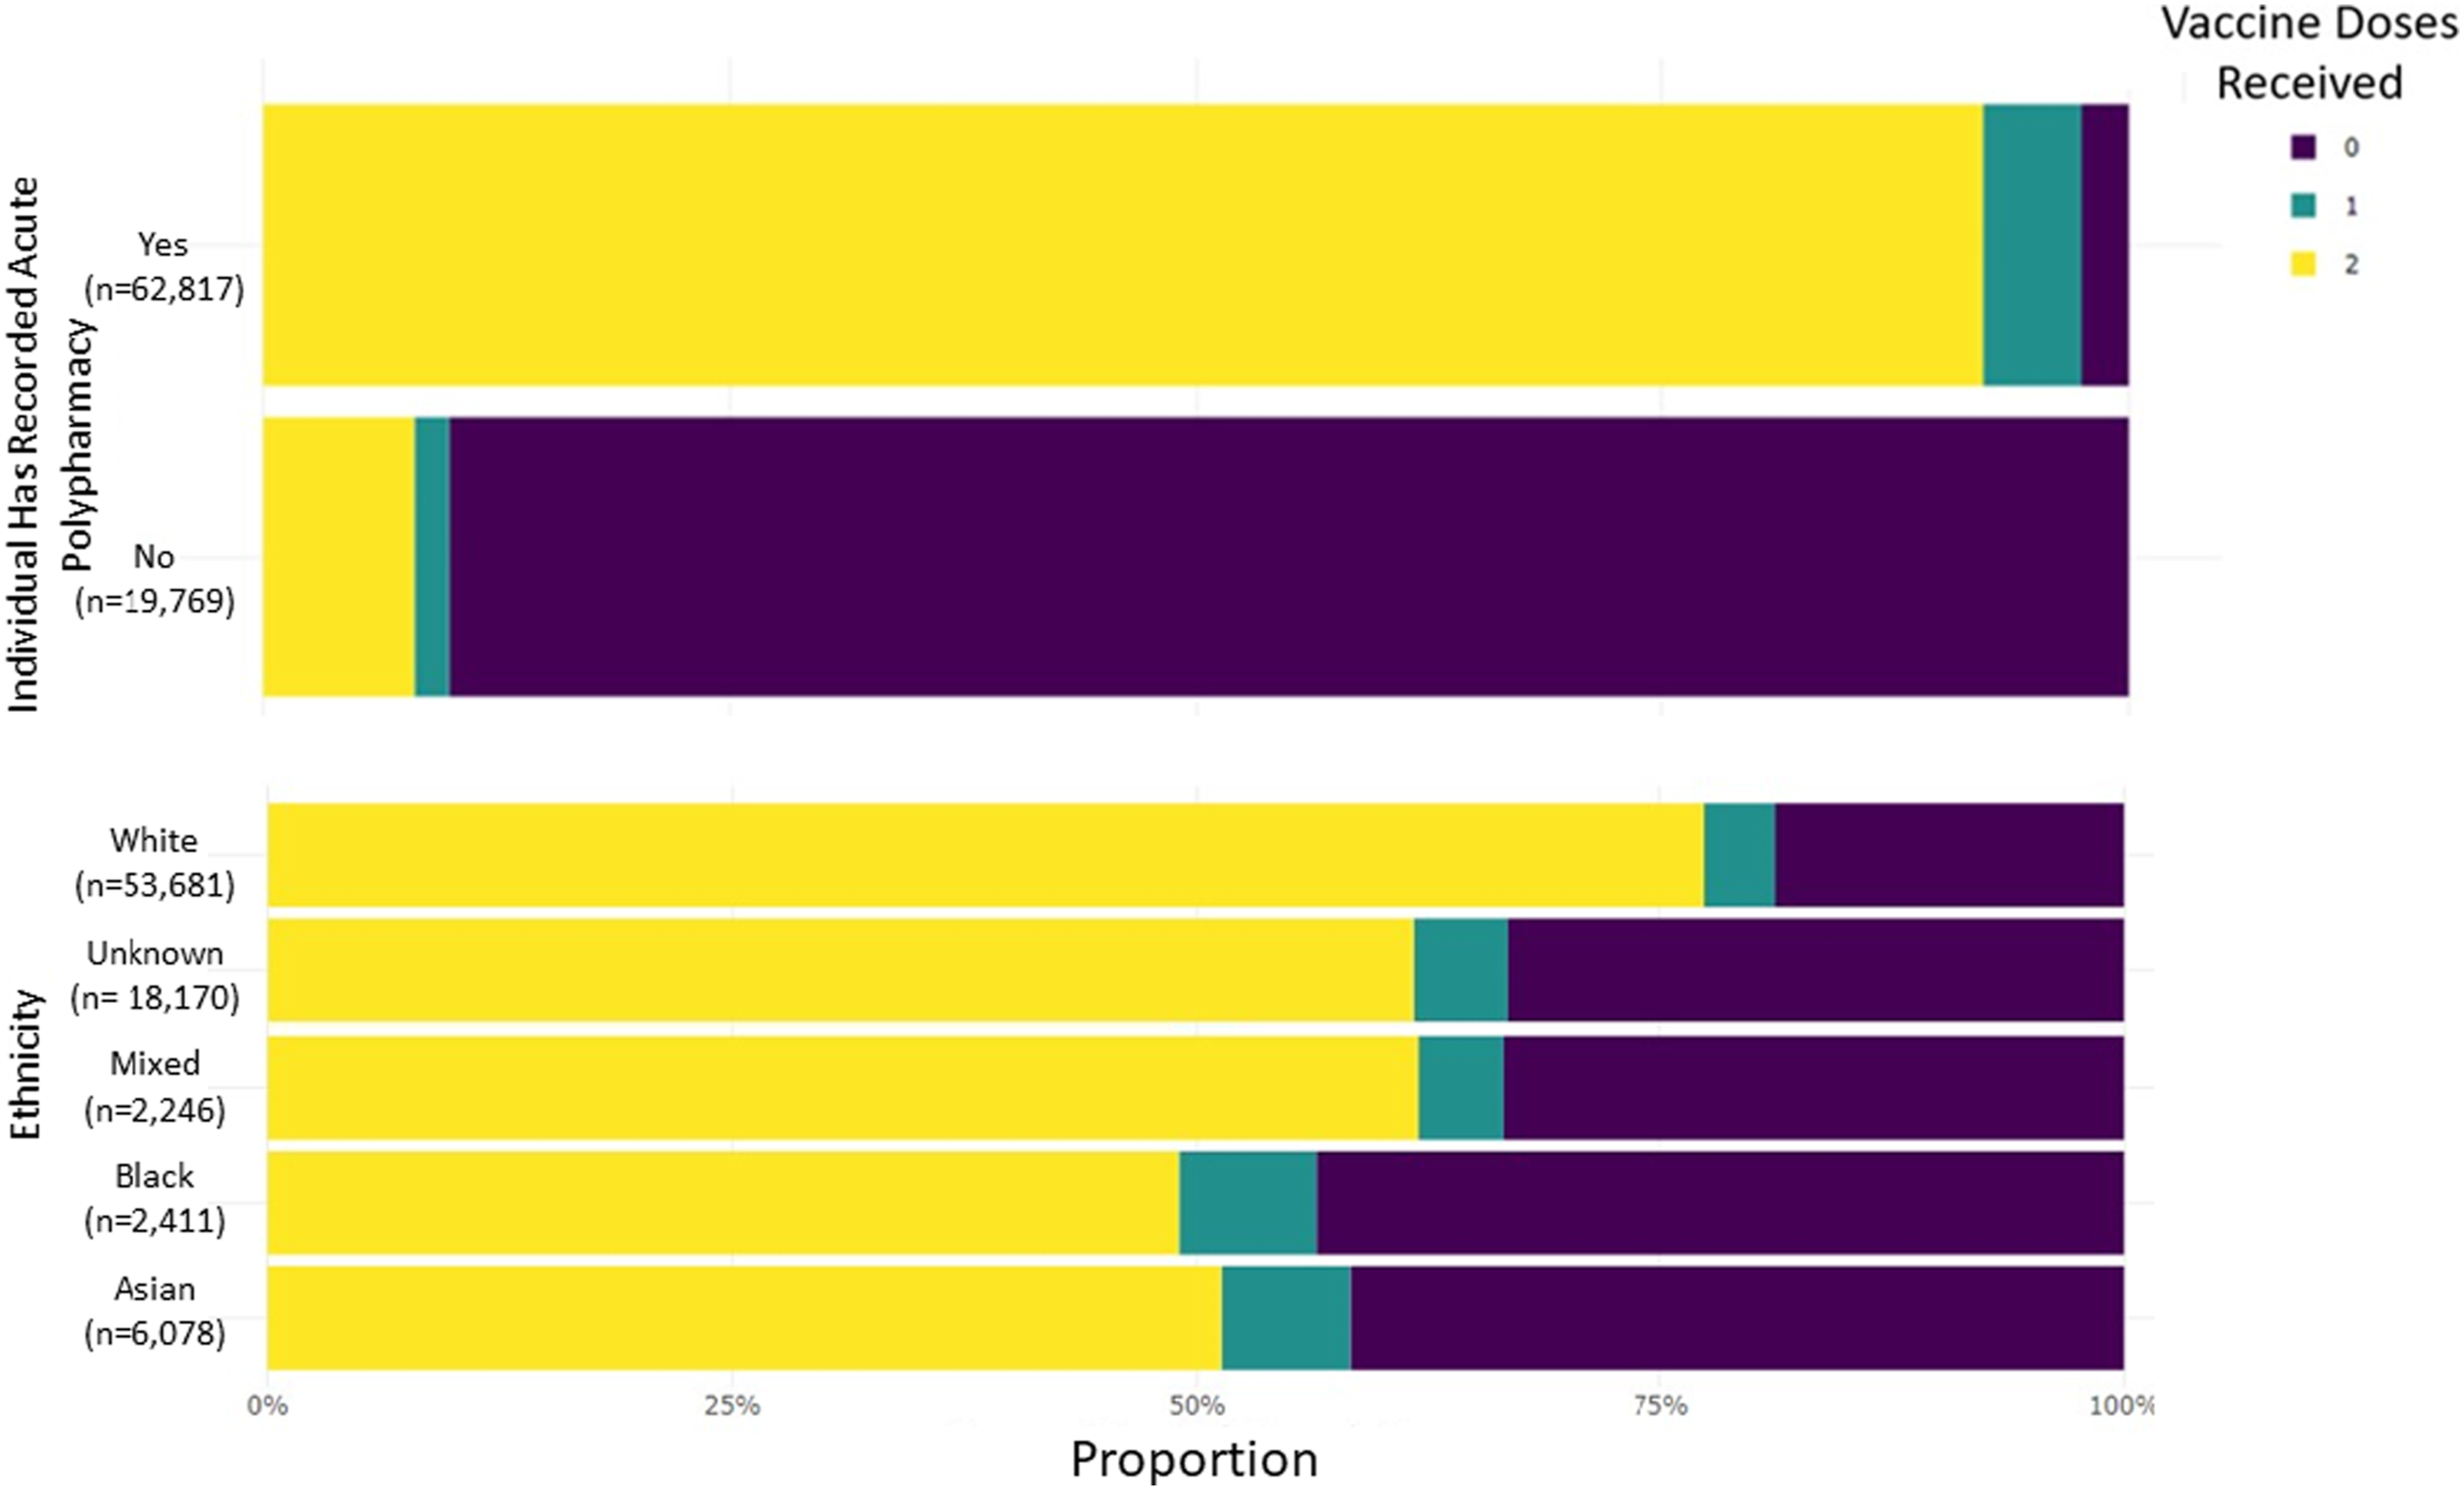
Outcomes
The analysis was useful in promptly identifying the types of people who had come forward for vaccination, and which groups could be targeted with additional efforts. Initially presented to the ICB Managerial and Clinical Senior Responsible Officers, this information contributed to the wider work on vaccine inequalities undertaken in the BNSSG healthcare system.44,45
Discussion
This paper describes a tool for improving the uptake of PHM in frontline healthcare services. In developing an interactive, customisable and reusable tool, whose practical use has been illustrated through three examples presented here, we have helped show how it is possible to meet healthcare systems’ PHM needs in-house and without potentially costly and time-consuming bespoke projects. Given the relative novelty of PHM in many health services, this paper has aimed to make a contribution to the sparse literature available in this domain, as well as to provide an open-source tool that can be used, reused and reconfigured by other healthcare systems.
A particular benefit of the tool developed here is the reduction in analyst time expended on tasks that are either or both technically demanding or repetitive. When considering tasks such as those described in Results, typical approaches have commonly involved analysts use of SQL code to query the relevant data and then Microsoft Excel to produce the relevant outputs. The time necessary for this process varies but would scale significantly on repetition, as there is little scope for saving time through automation. However, using a purpose-built tool such as the one described here, most of the pre-processing is done automatically for the user; meaning little input is required to format and clean the data and produce the outputs. This makes the tool well-suited for timely answering of PHM-related questions, specifically during workshop-style meetings when meaningful progress can require the ability to rapidly analyse data and answer questions ‘on the fly’. Furthermore, techniques such as regression and decision trees can be difficult to develop from scratch for non-statistically-trained analysts, especially when attempted in spreadsheets, but are comparatively straightforward using purpose-built interactive tools such as that presented here.
Alongside local use of the tool – by analysts, managers and clinicians (Results) – the potential of the tool in harnessing data-driven PHM techniques was demonstrated nationally to healthcare colleagues through various dissemination activities. As detailed in Methods; Development within the BNSSG healthcare system, the tool has been presented at a number of national and regional conferences and workshops. While 93% of those surveyed following demonstration at the 2021 NHS-R Conference agreed the tool “is user friendly” and “would be specifically useful to my work”, it remains difficult to accurately gauge use of the tool; although it is known from correspondence that at least two other NHS healthcare systems had actively been using it. Additionally, it has been learnt that use of the tool in these systems has encouraged some analysts to develop their technical skills, specifically those relating to risk stratification.
It is important to acknowledge the information governance requirements necessary for analysis of patient-level data, specifically those relating to GDPR. 42 Linking datasets from various healthcare organisations within the BNSSG system has required extensive governance arrangements to be in place. Also required is the appropriate data platform and protocols to enable safe and efficient access and sharing of data between partner organisations. These are recognised foundations for effective PHM. 46 Inevitably, there is some limitation with regard to aspects of widening (potential access to the tool) and deepening (the technical sophistication). Were the tool fitted solely to the BNSSG healthcare system, more could have been done on the latter, albeit at the expense of the former. While efforts were made to assess, through various surveys and engagements, the data infrastructure and PHM maturity in other healthcare systems, the tool development was principally guided by the BNSSG situation. In future years, as PHM and use of PHM becomes more mature, it is possible that healthcare systems will converge on more common data infrastructures and portfolios of PHM techniques that they require; thus improving the ability to both widen access and deepen sophistication of such a tool. Until then, healthcare systems may seek to modify the tool for their own particular uses or situation. Although no experience with ‘R’ is required to use the tool, some familiarity would be needed to effectively adapt or modify it for such ends. As has already been recommended by others, healthcare systems should promote technical development among their analysts to bolster capability for such purposes.46,47
Footnotes
Acknowledgements
The authors are grateful to Anna Powell for contributions to the design principles and dissemination activities.
Declaration of conflicting interests
The author(s) declared no potential conflicts of interest with respect to the research, authorship, and/or publication of this article.
Funding
The author(s) disclosed receipt of the following financial support for the research, authorship, and/or publication of this article: This work was supported The Health Foundation [Advancing Applied Analytics programme].