
Abstract
A deep integration of routine care and research remains challenging in many respects. We aimed to show the feasibility of an automated transformation and transfer process feeding deeply structured data with a high level of granularity collected for a clinical prospective cohort study from our hospital information system to the study’s electronic data capture system, while accounting for study-specific data and visits. We developed a system integrating all necessary software and organizational processes then used in the study. The process and key system components are described together with descriptive statistics to show its feasibility in general and to identify individual challenges in particular. Data of 2051 patients enrolled between 2014 and 2020 was transferred. We were able to automate the transfer of approximately 11 million individual data values, representing 95% of all entered study data. These were recorded in n = 314 variables (28% of all variables), with some variables being used multiple times for follow-up visits. Our validation approach allowed for constant good data quality over the course of the study. In conclusion, the automated transfer of multi-dimensional routine medical data from HIS to study databases using specific study data and visit structures is complex, yet viable.
Keywords
Introduction
An effortless access and sharing of data from hospital information systems (HIS) for medical research has become a premium focus of the digitized century. Such deep integration is challenging in many aspects, not only from an ethical and data protection perspective, but also in terms of implementation, maintenance, quality control, and sustainability. In particular, there is no simple solution for data documentation, as medical systems still widely use non-standardized data models and terminologies as well as narrative texts.
Conceivable approaches to pursue a routine data access are a single-source data collection for research and routine 1 and the direct extraction from a HIS after improved data search and standard support. 2 – 4 However, clinical data warehouses (CDW) currently appear to be the most promising, as they provide a technical basis for the comprehensive combination and use of intra- and inter-hospital secondary data. 5 – 9 . The potential of CDWs has been demonstrated to improve study feasibility analyses10,11 and enhance patient recruitment. 12 – 14 CDWs are also already being used to identify patients and extract their data for retrospective studies, thus, also facilitating an “hybrid approach,” that is, secondary enrichment of such data sets by manually extracted data from the HIS or dedicated study materials. 15 – 17 More often, CDWs are used to combine data of, for example, multi-institutional studies within a single database for analytical reasons.4,18– 21 In principle, such systems enable structured and harmonized data collection and optimized data exploitation. 22 CDWs are often implemented as complementary systems for research use only, which might not have the same attention and level of quality assurance provided by a dedicated clinical system, and might thus require specific steps for data verification.23,24 A major impetus for such and other use cases is provided by an increased number of national and international projects, such as the German medical informatics initiative. 25
However, major difficulties remain when detailed data from various hospital subsystems need to be assembled in a largely automated fashion for a clinical study, even if the required data originates from a single hospital. Since most clinical trials use study-specific Case Report Forms (CRF) and Electronic Data Capture Systems (EDC), a simple transfer of study-relevant data from HIS directly into EDC would be ideal. Because these processes are imperfect and incomplete, collected data must be extended by manual data acquisition and re-checked for quality control. 26 Some systems have been developed to enable such a data transfer, but describe only early experiences 27 or were developed specifically for the widely used systems i2b2 as CDW and REDCap as EDC. 28 – 30 They partially allow for customized aggregations of multiple CDW variables, but were primarily designed to map single CDW variables to single EDC variables. This may be explained by the fact that CDWs typically contain only individually usable variables (only linked on the level of the patient or encounter). In contrast, our CDW also provides data that are linked at document level (e.g., all variables in a lab report) as well as at group level (e.g., all values in a table row within a document), which can be used individually as well as in relation.
We are unaware of a CDW that allows variables to be assigned to a complex visit schedule and the study-specific variables without being tied to a specific EDC system. Maintaining linkage of these data to their original document (if needed) constitutes another unsolved challenge. Furthermore, the use of routine clinical data for generating robust evidence has been criticized,31,32 particularly with regard to data quality. We have not found any evaluation of a similar comprehensive data transfer process.
Objective
We aimed to show the feasibility of an automated transformation and transfer process feeding deeply structured data with a high level of granularity collected for a clinical prospective cohort study from our hospital information system to the study’s electronic data capture system, while accounting for study-specific data and visits.
Methods
We used an extension to our hospital’s CDW and a process that integrated all the necessary software and organizational processes into a system enabling the transfer large amounts of routine data to the study’s EDC system. We show the viability of this process by illustrating the finally adopted process and descriptive statistics of transferred data including the automated data preparation, verification steps, and interfaces to manual interferences. We describe key system components to characterize the identified individual challenges and their solutions. We used descriptive statistics to evaluate the proportion of all study data that we were able to automate with reasonable effort. For the current report, we used data entered into the EDC system up to February 18, 2021.
Data transfer process
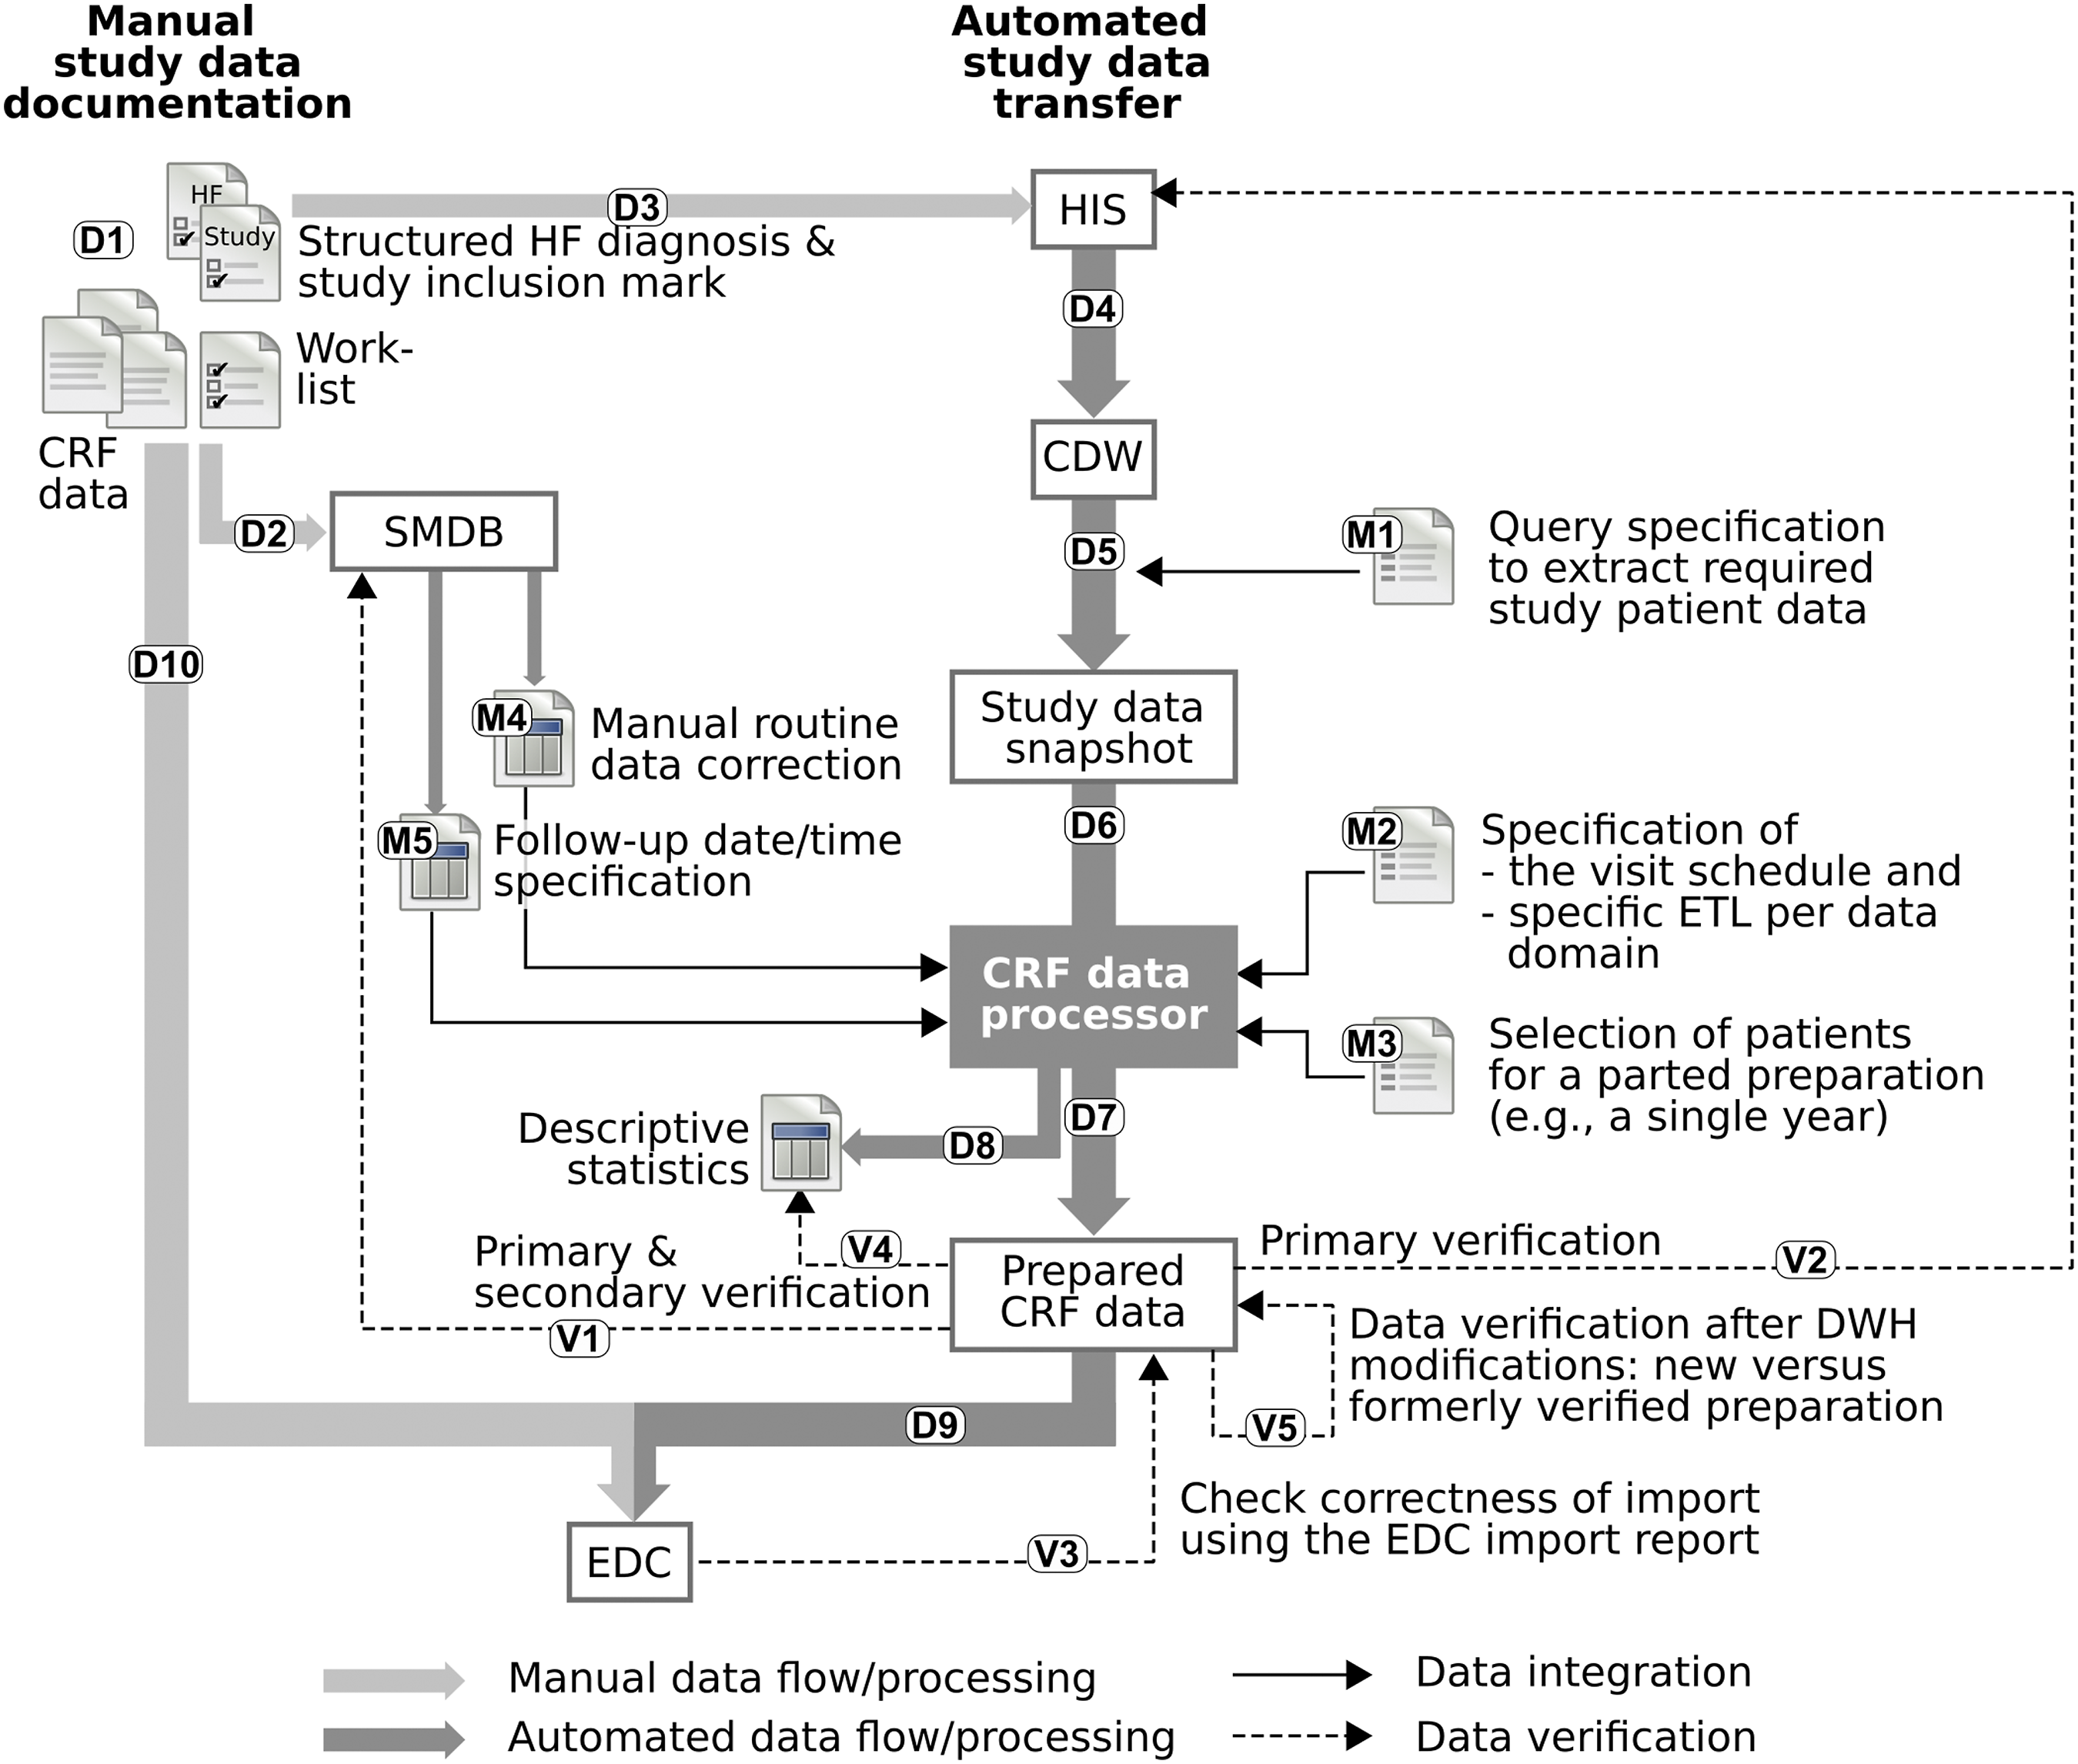
Figure 1 illustrates the entire process used to transfer data from the HIS into the study EDC system including associated steps for its verification. The process included three topics: a. The overall automated and manual data flow used to collect the study data is described in Overall data flow (cf. Figure 1: D1–D10). Additional details about the method used to map patient data to study visits are described in Data-study visit mapping (M2). b. Each execution of the CRF data preparation required a few manual interventions (cf. Figure 1: M1–M5): selecting patients and manually correcting and extending data exported from the HIS (see Data selection (M3) and Manual data modification (M4)). c. The steps undertaken to verify the prepared data (cf., Figure 1: V1–V6) are described in Data verification (V1-6). Illustration of the overall study data flow (D1-D10; manual data acquisition in light gray, automated transfer of data in dark gray), any manual documentation required in addition to the DWH interfaces (M1-M5), and all verification steps (V1-V5). CDW, clinical data warehouse; CRF, case report form; EDC, electronic data capture; ETL, extract-transform-load; HIS, hospital information system; SMDB, study management and logistics database.
Overall data flow
The process was based on the hospital’s CDW 1 containing a vast amount of data of all hospital patients, data domains from multiple subsystems, information extraction from narrative texts, and pseudonymized access to all imaging data of the PACS. An R-based 2 application programming interface (API) was developed to access data of the CDW with highest granularity.
The study-specific process began with a manual screening and patient visitation by study staff (cf. Figure 1: D1). There, study-specific information was collected (on sheet paper CRFs) that was not routinely available in the HIS (e.g., psychometric questionnaires). Study staff also completed two dedicated study-related forms in the HIS (cf. D3). One indicated the presumed diagnosis of “acute heart failure” as an index diagnosis, which allowed to track the patient within the HIS. The other documented successful study inclusion, once the patient had provided written informed consent. Study staff also completed worklist forms to obtain meta-information about the study process, that was entered into a study management database (SMDB; cf. D2) used to handle study logistics. The SMDB contained, among other information, the patient pseudonyms, the date of the study visit and inclusion, and markers of medical examinations performed during the visits.
The pseudonymized CDW was kept up to date by a CDW process (cf. D4), allowing to export all relevant data of all study patients via a CDW-API as a study data snapshot to file storage (cf. D5 and M1). Such an export is a permanent snapshot in the highest available data granularity and the basis for any study data preparation (multiple data values are at least linked on the level of patient, case, and document). A new snapshot was only required if a change to the CDW infrastructure has been made (e.g., a newly required domain has been added or a new software version has been deployed) or new study patients have been enrolled.
The CRF data processor (cf. D6) provided functionality to prepare data for the population of electronic CRFs in the study EDC system, used to collect all study-related medical data. It required a study data snapshot and few manual configurations (see following sections). The processor prepares data files (cf. D7) including a patient administration file (used to create all scheduled visits for the index hospitalization and follow-up visits in the EDC system) and a patient selection file with details of the patients (used for the verification steps, cf. V1). Most importantly, the prepared CRF data also included multiple tabular files for each prepared CRF. The files start with a column containing the patient pseudonym and visit name, followed by columns for any medical variable. The processor also provided descriptive statistics on the exported data (cf. D8), which is manually used in the verification steps. CRF files had to be re-pseudonymized to replace CDW pseudonyms with study pseudonyms (executed semi-automatically via a customized identity management system) and were then imported manually én bloc—without further processing—into the EDC system (cf. D9). The automated import formed the basis for the data input of the paper-based CRFs (cf. D10). After automated and manual data entry, data can be used for statistical plausibility checks and analysis.
Data-study visit mapping (M2)
Data collection for a study visit was based on a single complete hospital patient case. The case for the primary study visit (i.e., baseline visit at index hospitalization) as well as the study group was selected using the data of the manually entered HIS forms (cf. Figure 1: D3). Since follow-up study visits did not have a separate marker in the HIS, we attempted to automate the detection of such cases based on the calculated expected visit date (e.g., 6 months after the data of index hospitalization discharge), which however failed due to highly variable actual visit dates. Therefore, we included the metadata of actual completed visits into the process that was already documented in the SMDB (cf. Figure 1: M5), which further required manual correction (see Manual data modification (M4))
The visit schedule specification used in the automated data preparation for this study to map data of full hospital visits to a subdivided index and multiple follow-up visits.
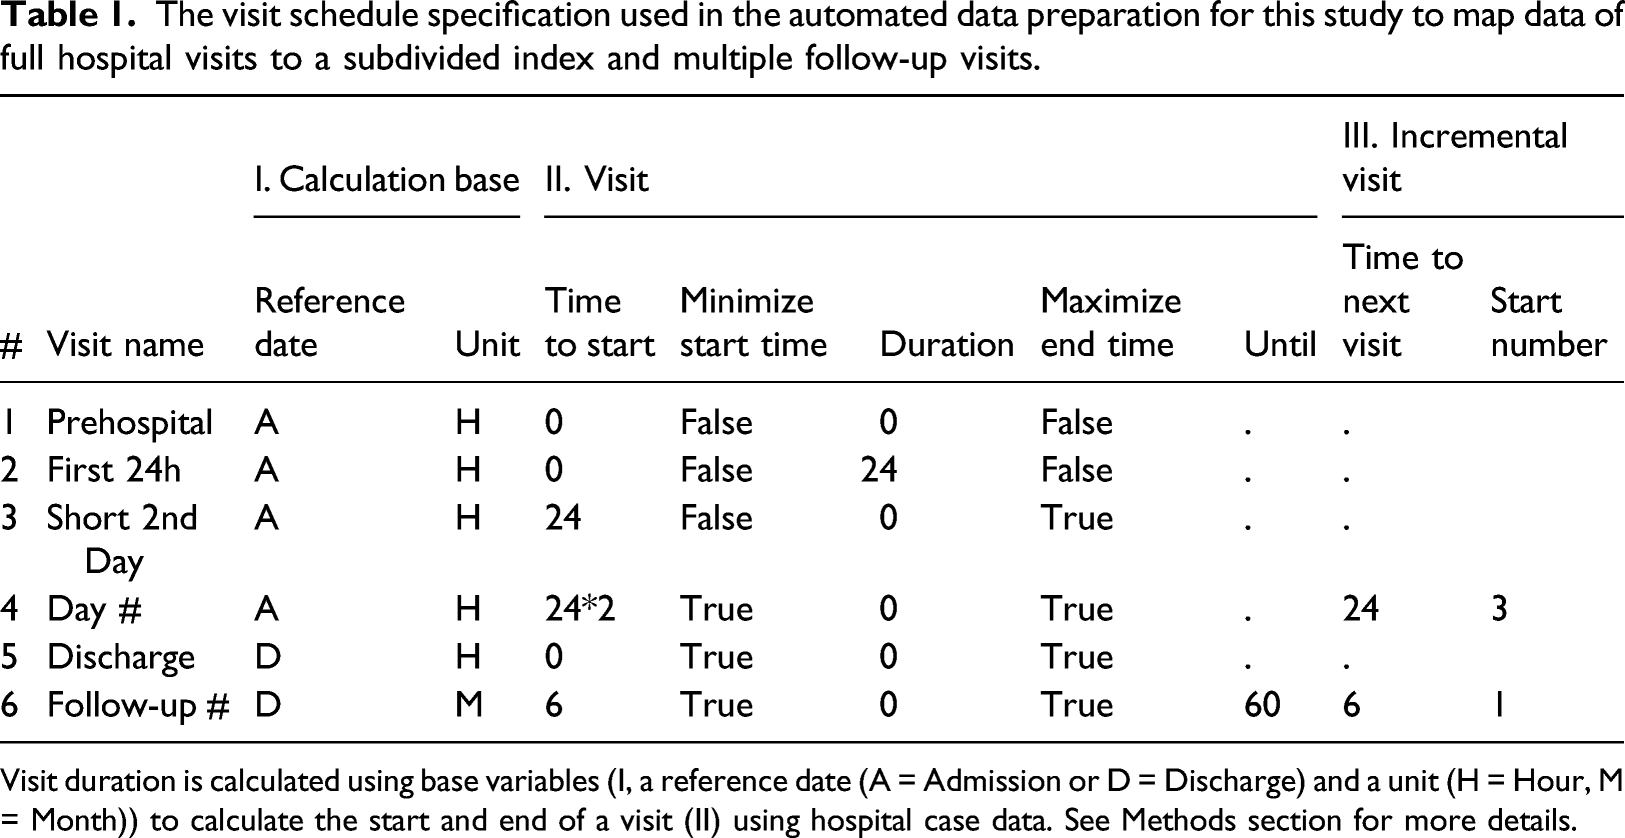
Visit duration is calculated using base variables (I, a reference date (A = Admission or D = Discharge) and a unit (H = Hour, M = Month)) to calculate the start and end of a visit (II) using hospital case data. See Methods section for more details.
Data selection (M3)
We wanted to automate the initialization of patients and their visits in the EDC system and to proceed with data entry over the course of the study. Since the manual entry was planned to complete automated data entry, we split the data preparation of the whole study population into subgroups. For this purpose, we added a specification to manually select patients and data ranges from the study data snapshot (containing all study patients; cf. Figure 1: D3) for a data preparation (cf. Figure 1: M3).
Manual data modification (M4)
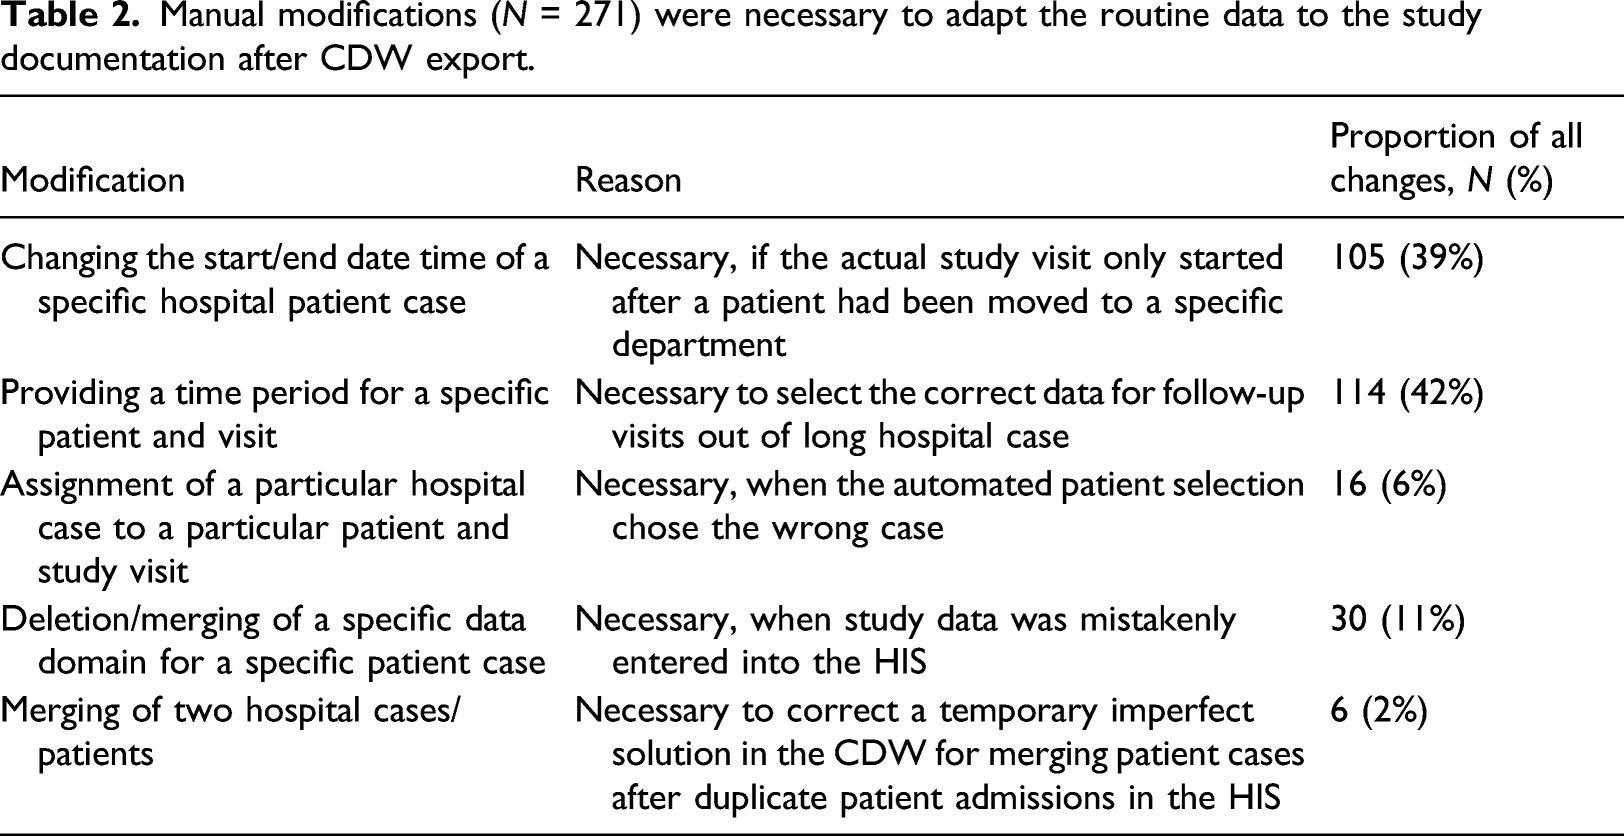
Manual modifications (N = 271) were necessary to adapt the routine data to the study documentation after CDW export.
Data verification (V1-6)
We verified the data flow in three stages: (1) An extensive primary verification was done for the entire process. (2) A secondary verification was done for any subsequent CRF data preparation, in which we examined predominantly only those parts of the pipeline expected to be susceptible to errors with the use of descriptive statistics. (3) An on-demand verification was performed after a major change in the pipeline had been introduced. We characterize the three stages in more detail in the online supplement.
With these verification stages, we checked the system for errors, but also checked and corrected prepared data. 32 This was primarily a check for completeness in the sense of correctly extracting all documented variables from the HIS, extended by a manual check of the completeness the data documented in the HIS. Descriptive statistics provided with the prepared data were used to check plausibility (e.g., values are within typical ranges) and completeness (e.g., percentage of documented examinations and values is expected). Checks regarding conformance (e.g., data values meet study data standards, an encounter links to a single patient) and atemporal plausibility (e.g., checking laboratory reference ranges, expected missing data) was done during the import into the EDC system.
Results
The clinical study recruited 2051 Patients. We prepared and imported all available data of these patients up to February 18, 2021.
Data mapping and transformation to study visits
The clinical study had defined six different types of patient visits. A visit schedule specification was defined accordingly and added to the process, as shown in Table 1. The “Pre-hospital” visit was not populated using the automated data preparation and was assigned with the time of admission (cf. #1). The "First 24h” visit started at the time of hospital admission and ended at the same time on the following second day (cf. #2). The remaining data of the second day was assigned to a “Short 2nd Day” visit (cf. #3). The “Discharge” visit contained the data of the last full day of the hospitalization (cf. #5). The other two visit specifications are incremental: The daily visits “Day #” started on day 3 after admission (cf. #4) with a length of 24 h until hospital discharge, resulting in visits for Day 3, Day 4, etc. The post-discharge “Follow-up #” visits were single-day outpatient visits beginning with a 6-month interval after discharge up to 60 months after discharge (cf. #6).
This study visit specification was used to prepare a study admission file and multiple CRF data files. In total, this resulted in the creation of 54,742 single visits in the EDC system, five non-incremental visits, a median (inter quartile range) of 9 (6–14) daily visits, and 10 follow-up visits per patient. Figure 2 shows an example of transforming and mapping data from the hospital’s laboratory system using the study visit schedule. It includes a mapping of data from the clinical to the study’s data model and a selection of value subsets using one of the operators first, last, minimum or maximum value. Further types of data transformations were required, for example, date calculation, summarizing times, searching narrative texts using regular expressions, categorizing values, transposing tables, aggregating drug ingredient dosages, and extracting information from echocardiography and electroencephalography reports. Example for the application of the visit schedule transformation from source data (A) to data prepared for import into a CRF within the EDC system. The source data is mapped to a study visit. For patient P-2, the blue highlighted rows are mapped to the visit "First 24h", the yellow highlighted data to the visit "Day 3". In case of multiple data entries, the first one is selected (i.e., "Leukocytes" in this example).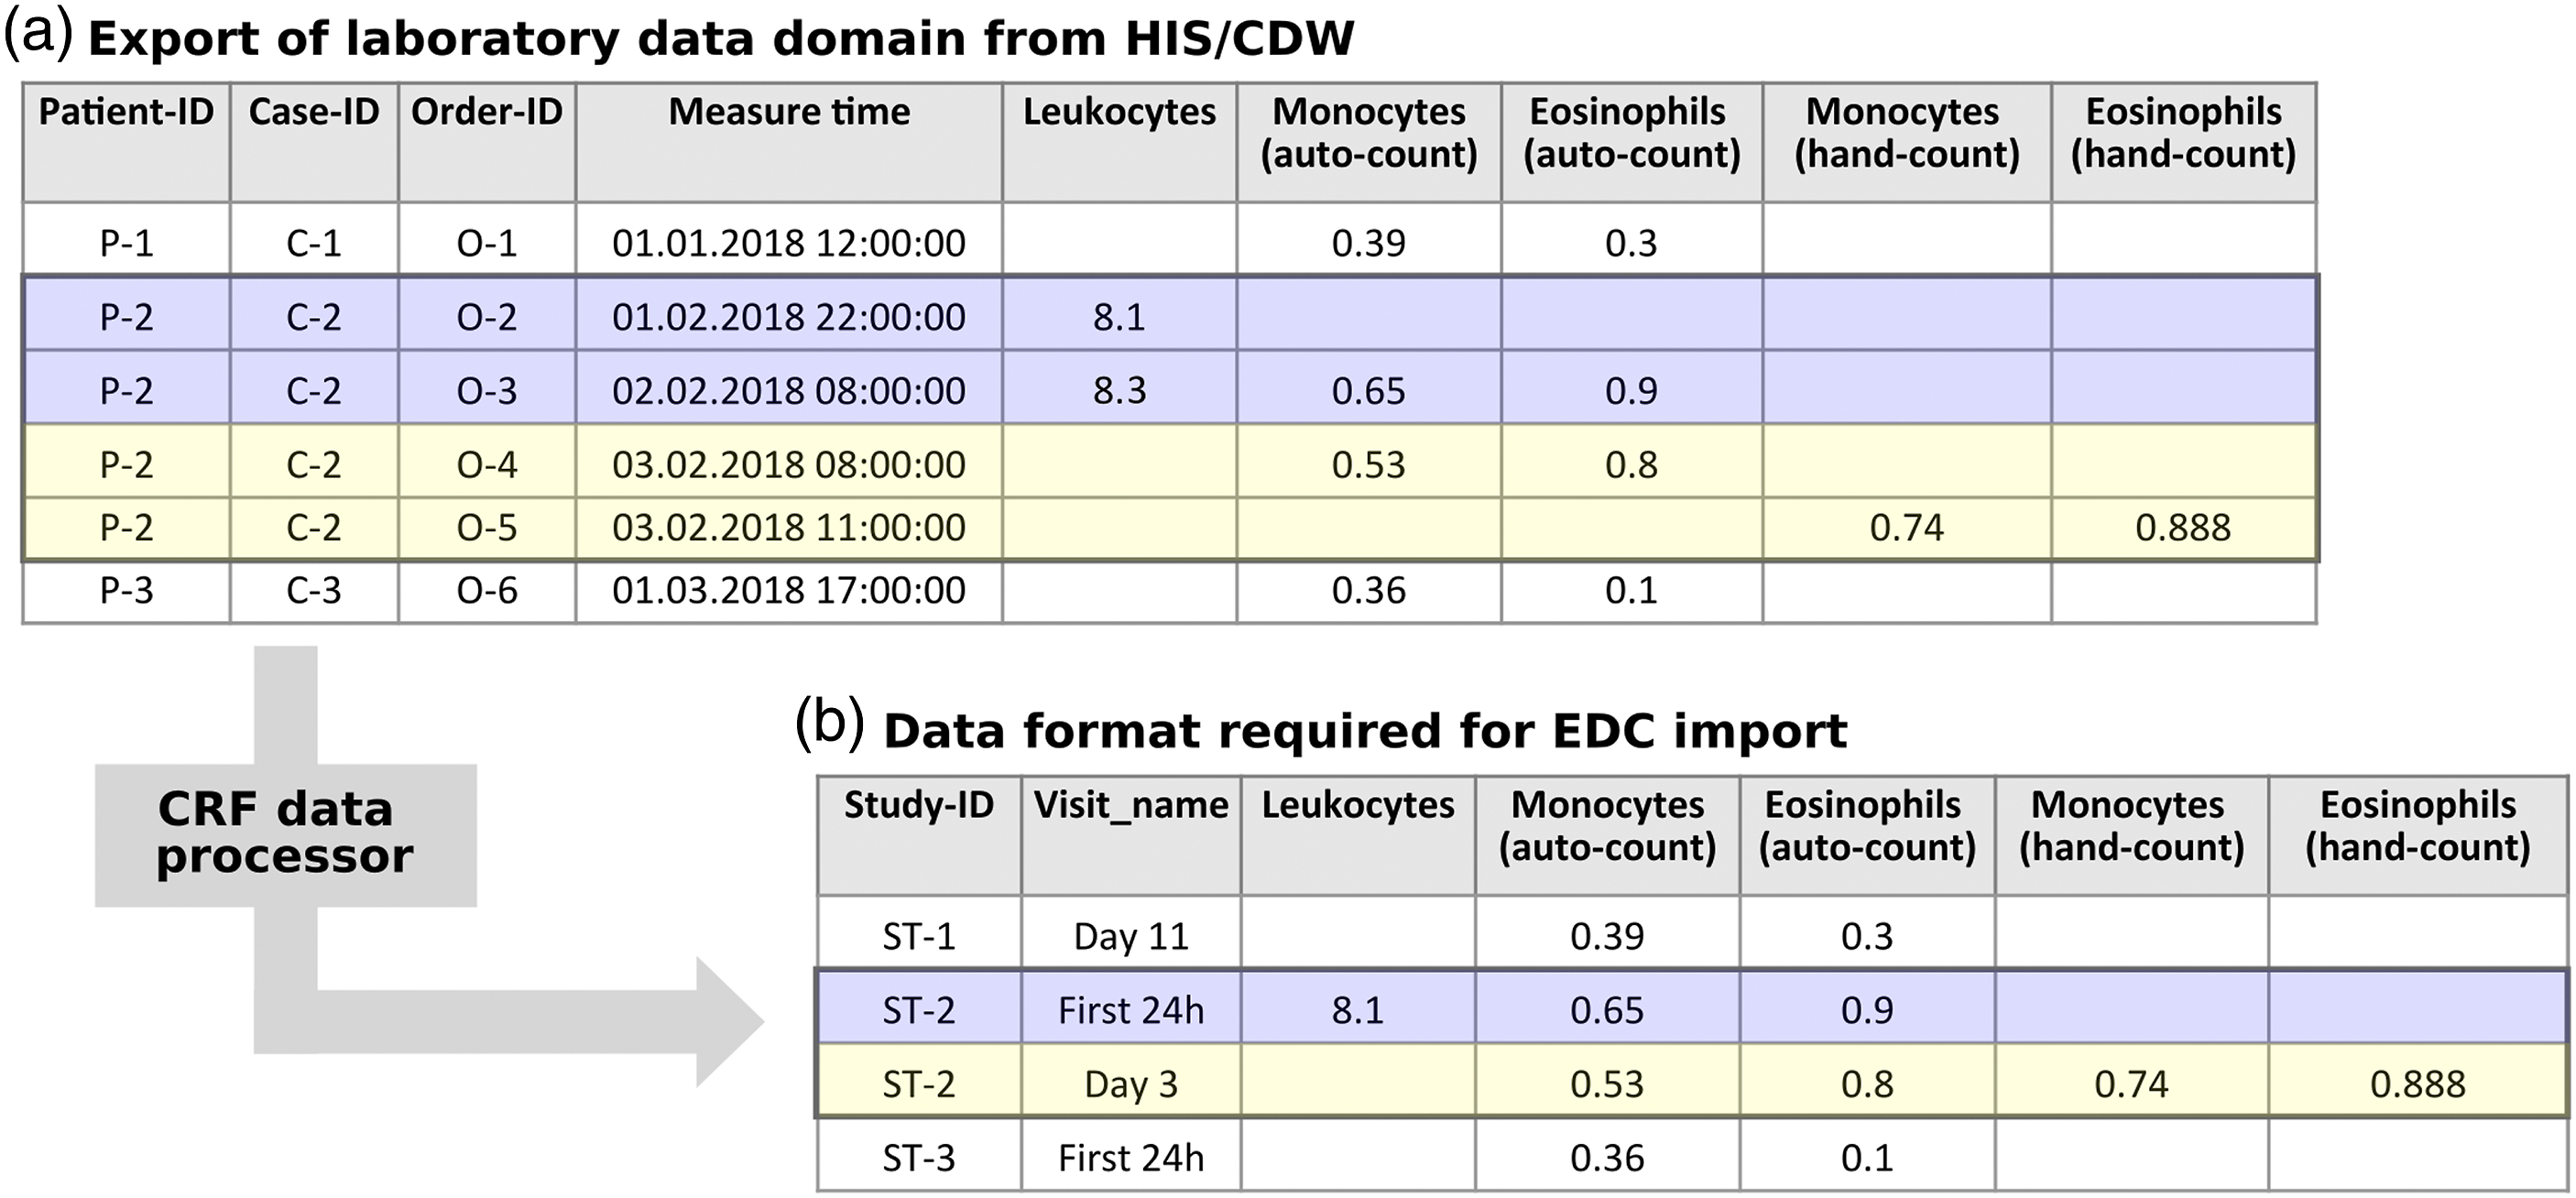
Automatable data acquisition
Data were imported in multiple packages into the study EDC system, beginning with patients enrolled in the follow-up group between 2014 and 2016 and continuing with separate, mostly annual, imports by study group and visit. Overall, 314 variables of 19 data domains were automated for import into the study EDC system, extended by a manual data entry into 793 variables.
271 manual modifications were made as described in Table 2. In most cases, a modification required only a quick data entry. For some cases, however, we had to manually debug the entire pipeline to find the problem, which could require 30 min and more.
Comparison of the proportion of data entered by the automated process versus data entered manually divided into.
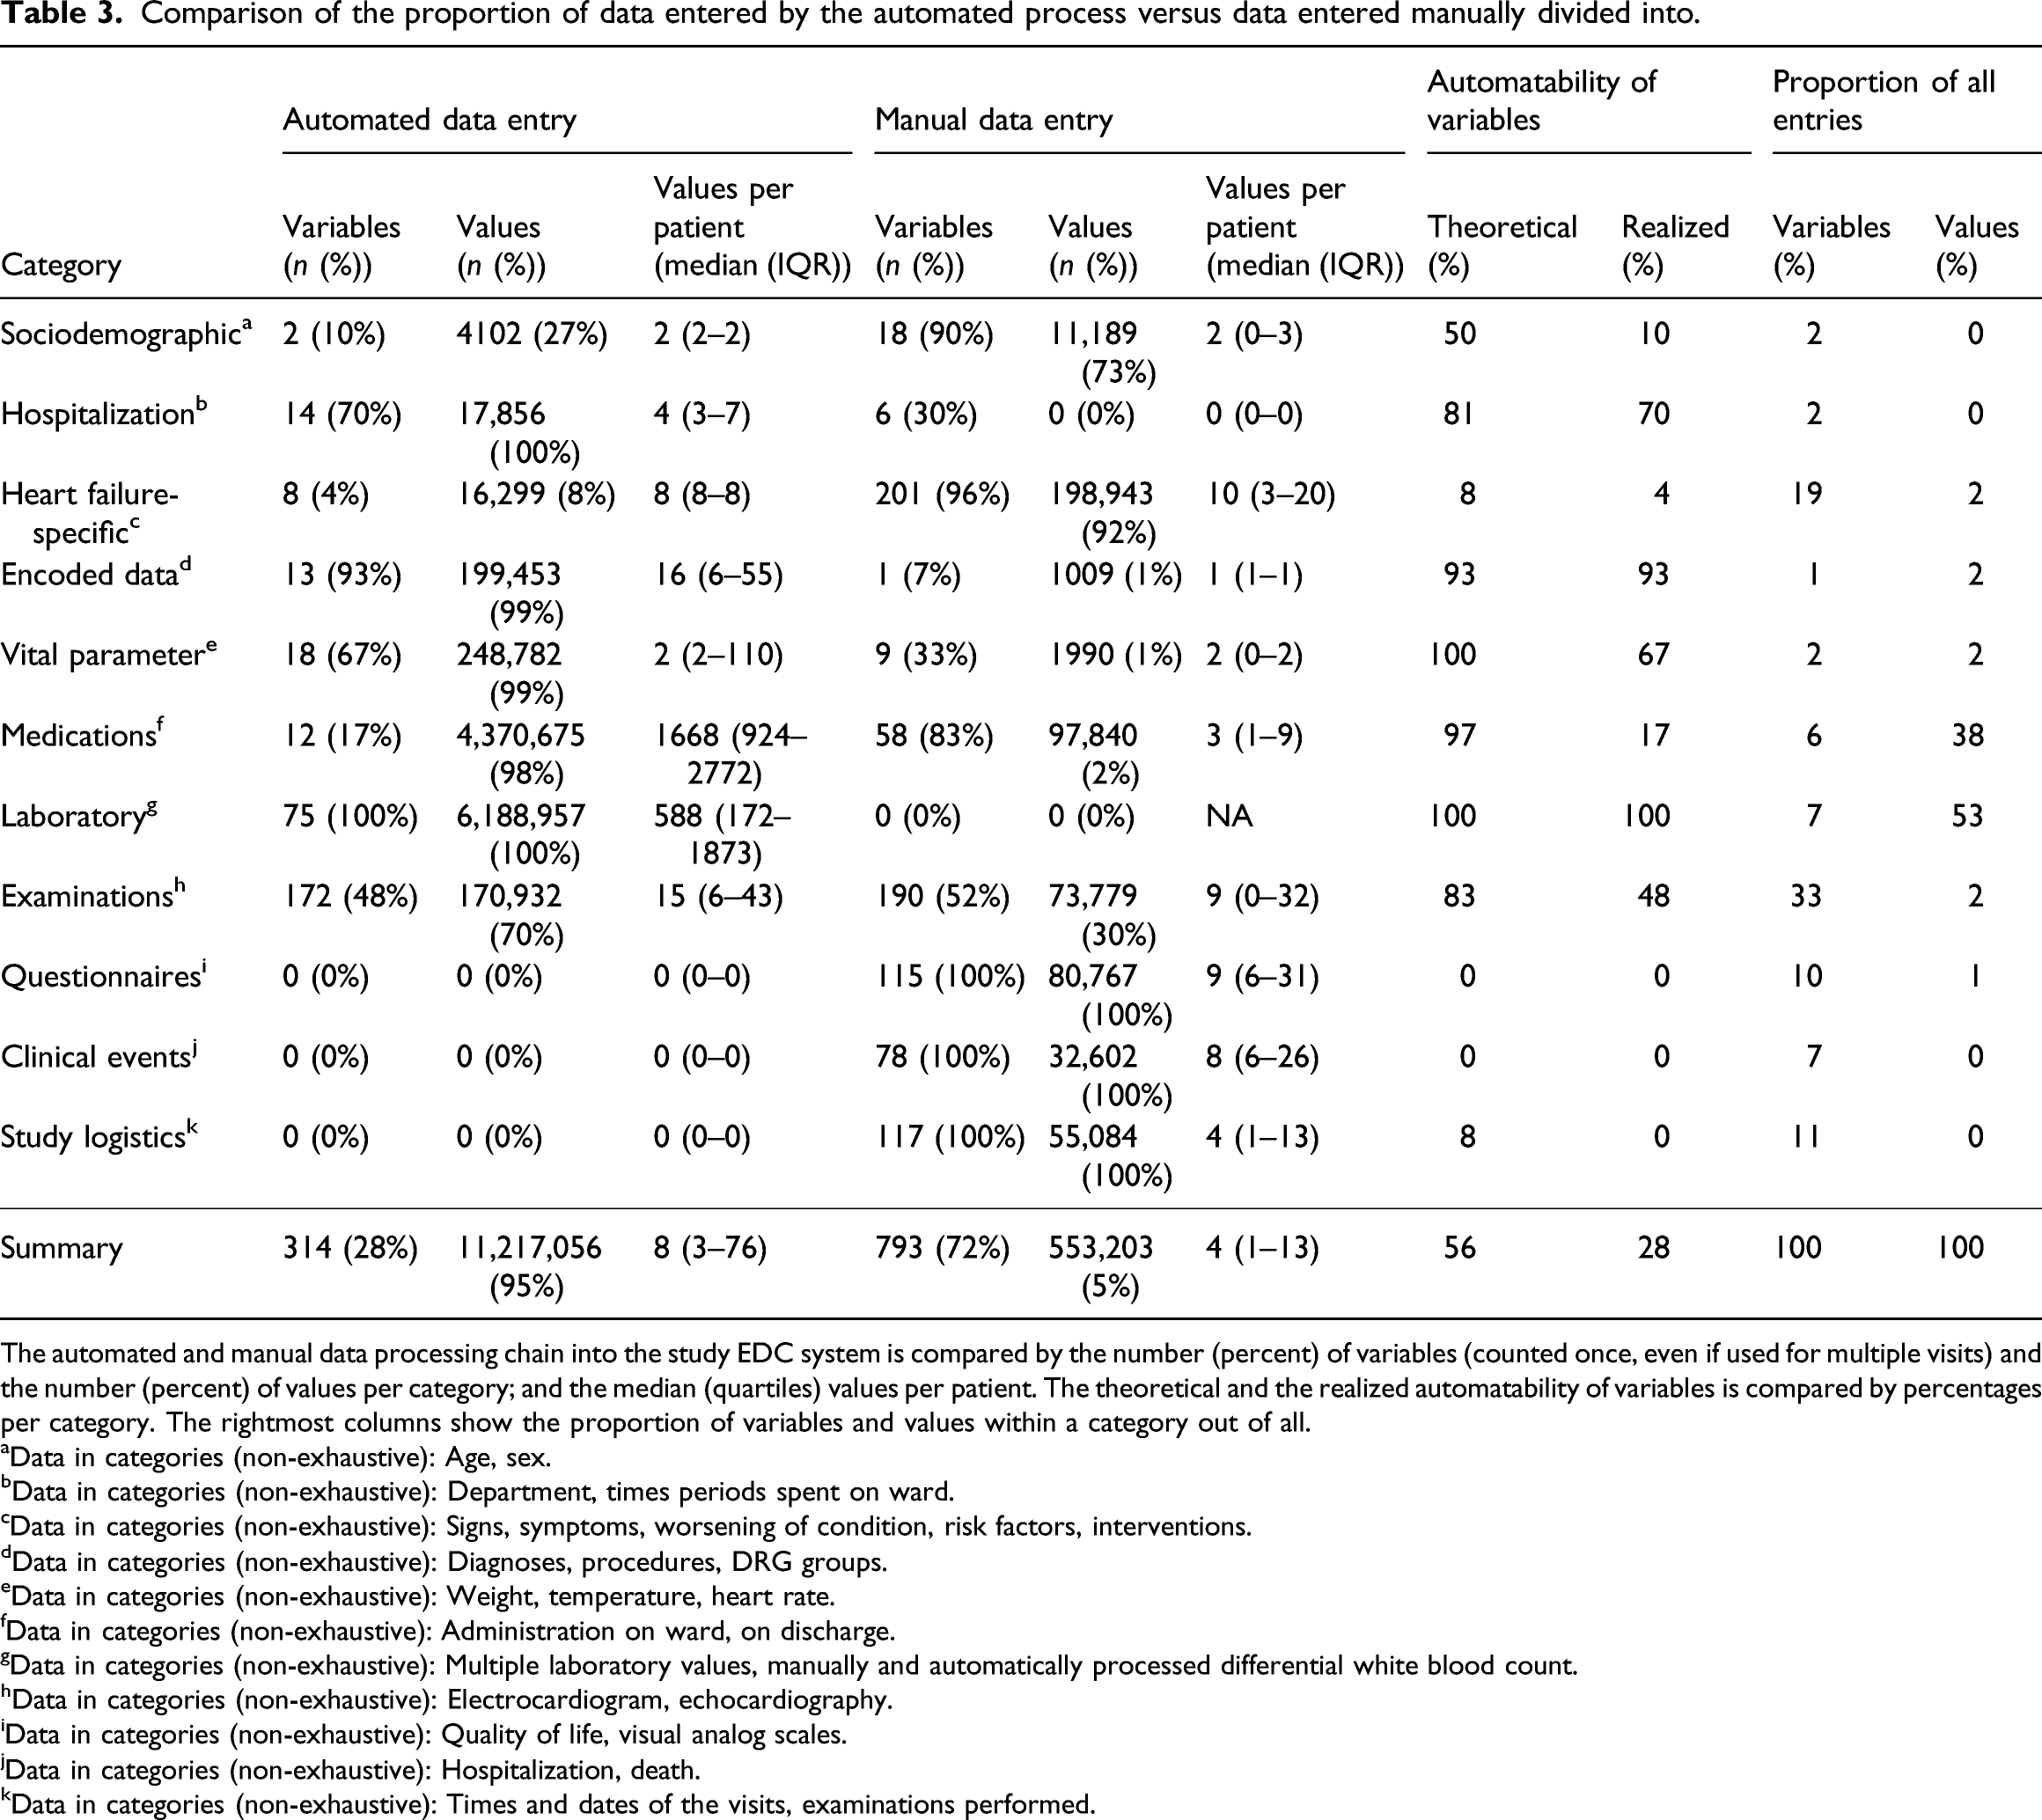
The automated and manual data processing chain into the study EDC system is compared by the number (percent) of variables (counted once, even if used for multiple visits) and the number (percent) of values per category; and the median (quartiles) values per patient. The theoretical and the realized automatability of variables is compared by percentages per category. The rightmost columns show the proportion of variables and values within a category out of all.
aData in categories (non-exhaustive): Age, sex.
bData in categories (non-exhaustive): Department, times periods spent on ward.
cData in categories (non-exhaustive): Signs, symptoms, worsening of condition, risk factors, interventions.
dData in categories (non-exhaustive): Diagnoses, procedures, DRG groups.
eData in categories (non-exhaustive): Weight, temperature, heart rate.
fData in categories (non-exhaustive): Administration on ward, on discharge.
gData in categories (non-exhaustive): Multiple laboratory values, manually and automatically processed differential white blood count.
hData in categories (non-exhaustive): Electrocardiogram, echocardiography.
iData in categories (non-exhaustive): Quality of life, visual analog scales.
jData in categories (non-exhaustive): Hospitalization, death.
kData in categories (non-exhaustive): Times and dates of the visits, examinations performed.
List and description of automated data domains with descriptive statistics, grouped into the same categories as in Table 3.
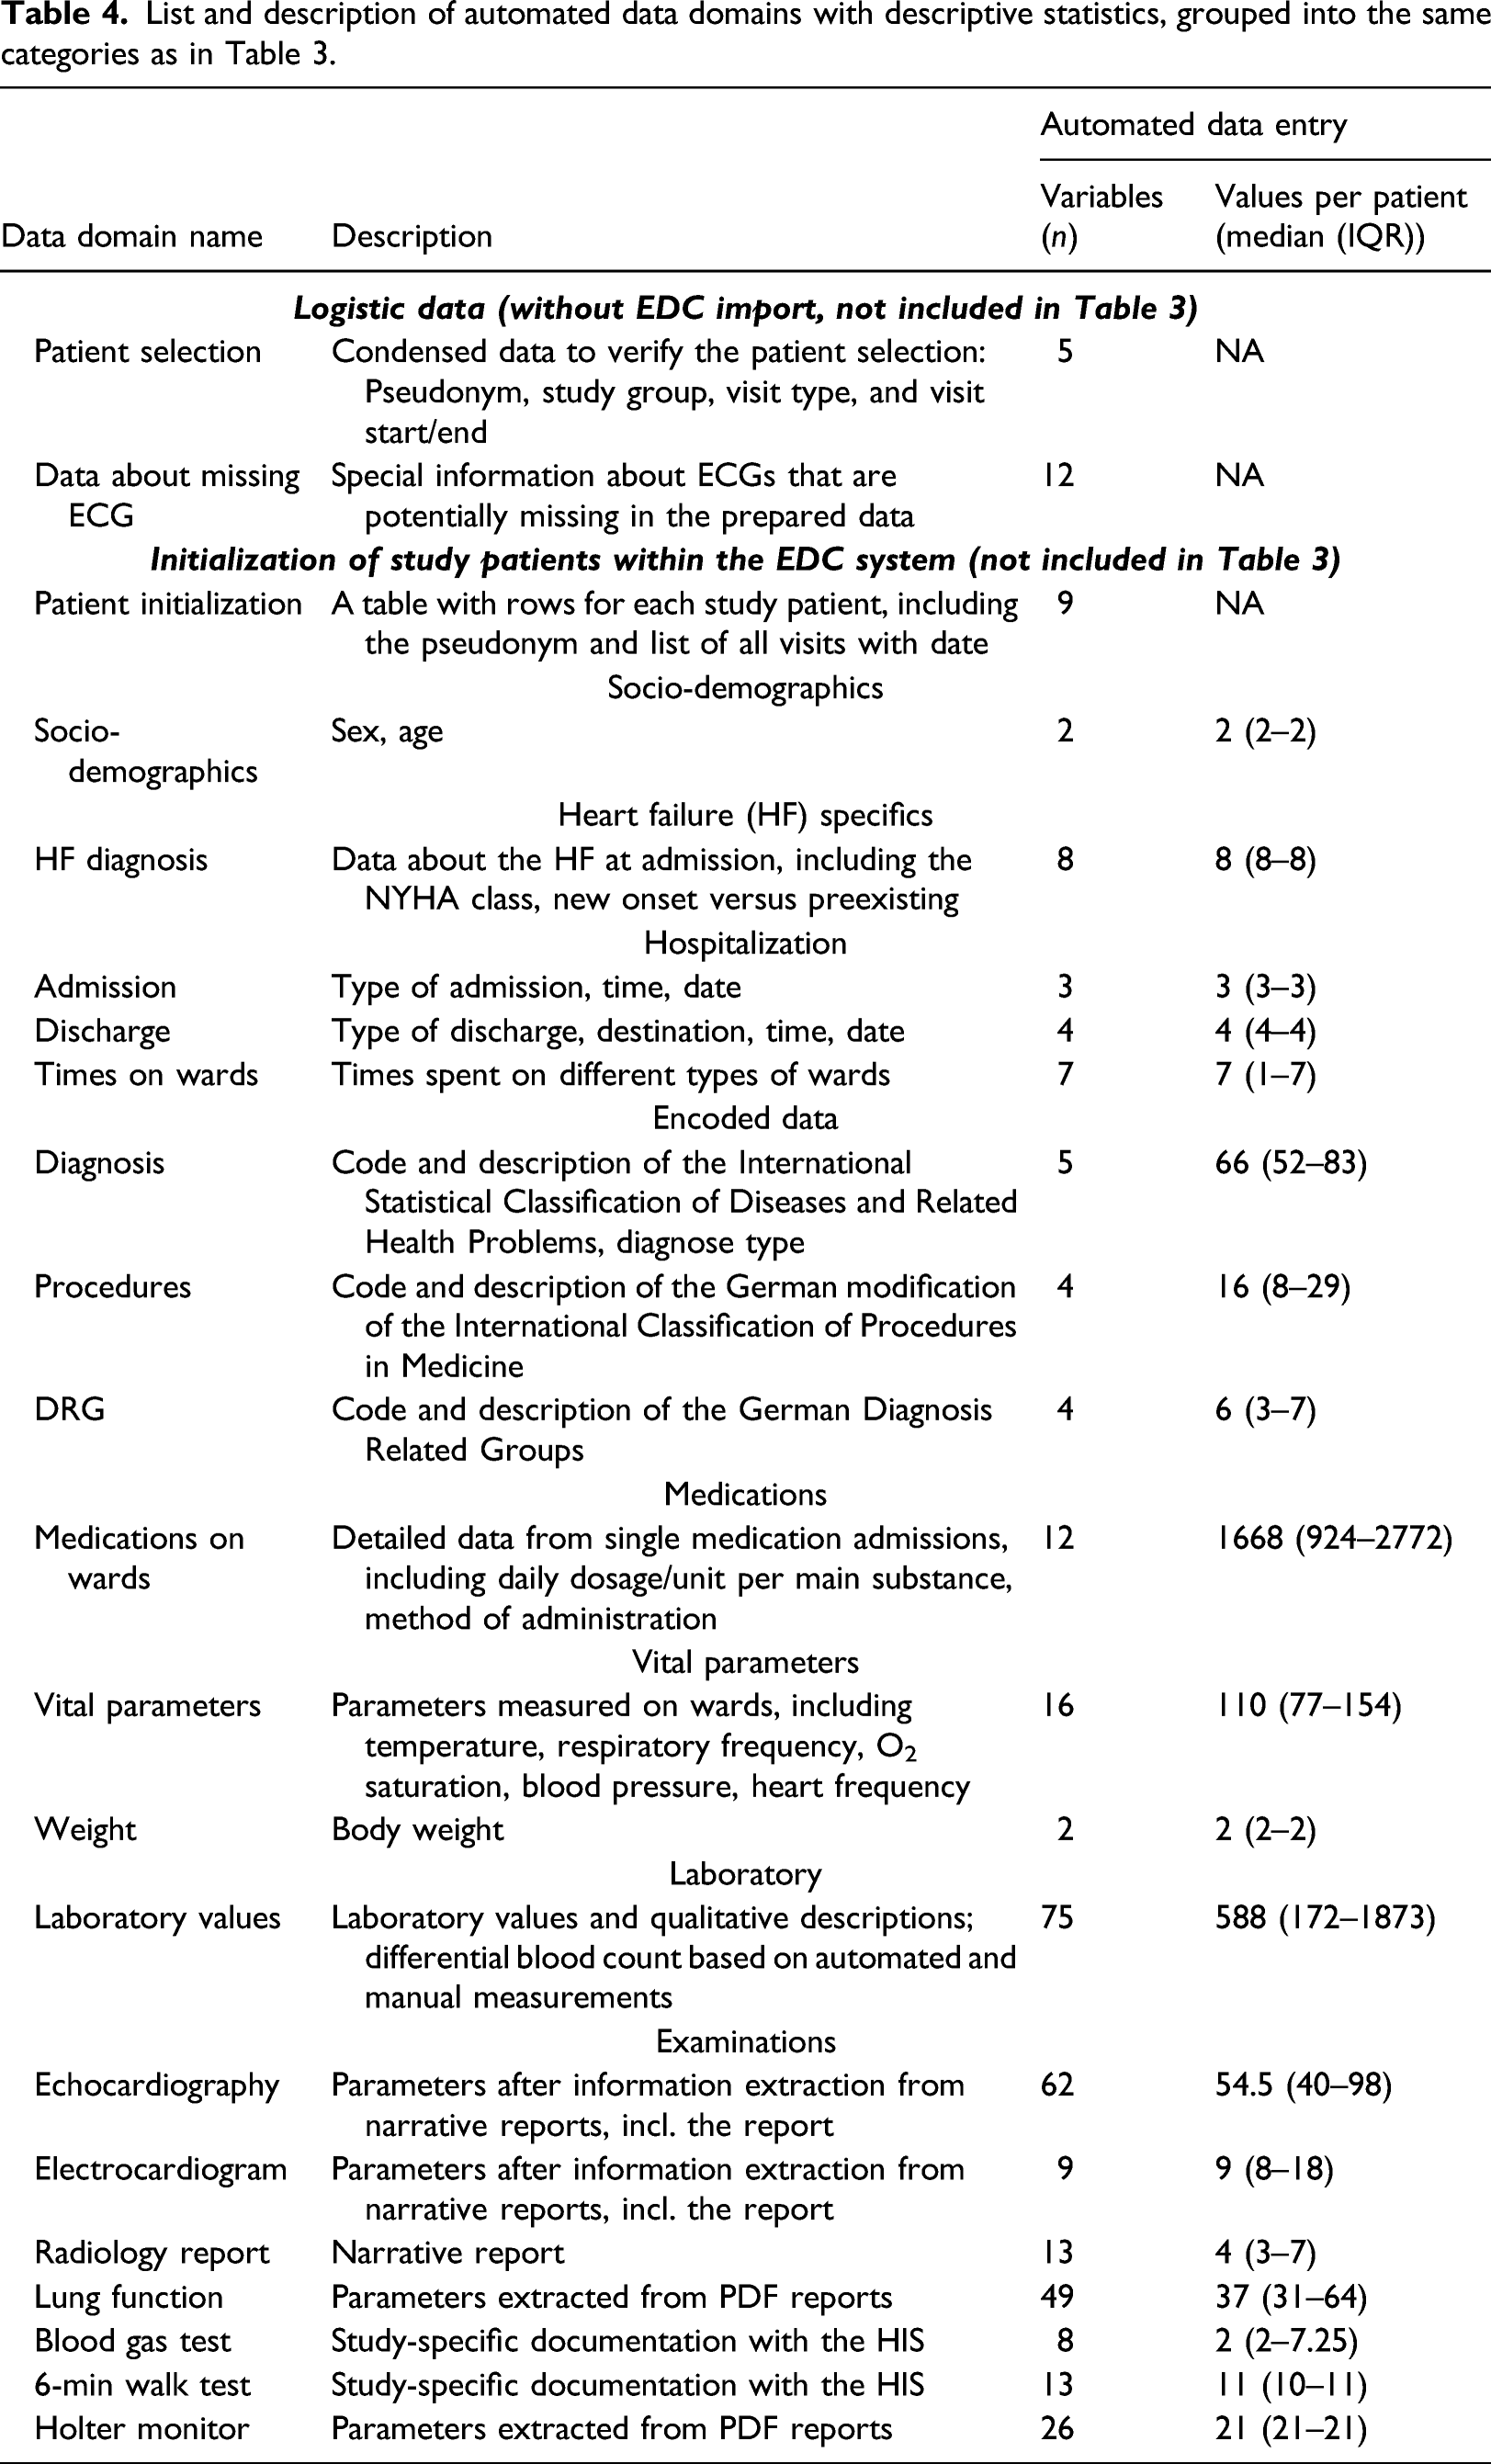
We grouped all variables into categories of their automatability. Variables were classified as automatable if they can be extracted from structured data or via an additional information extraction process from narrative texts or PDF documents. Variables were classified as non-automatable if they cannot be reliably collected without hospital-external data (e.g., data from other hospitals), unreliable from hospital-internal discharge letters, or if they are research-specific. Table 3 presents the resulting theoretical automatability of variables per category in comparison with the automation realized in this project. Overall, we were able to automate 65% of the automatable variables by this definition. The category “examinations” contained the majority of variables (n = 362 variables; 33%), of which we were only able to automate 48% (n = 172); we especially missed out data from the domains “radiology,” “sleep apnea,” and “blood gas test” (n = 181; 16%). Other variables we did not handle were only needed for individual visits, but still required extensive information extraction. Non-automatable variables were research-specific and unlikely to become in routine care measures in the near future (n = 310 variables; 28% of all) or were heart failure-specific and represented core information needed to answer the disease-specific research questions (n = 209 variables, 19%).
Discussion
We here report on the implementation, efficiency, and quality of a process for comprehensive automated routine data transfer of patient data from the HIS to a dedicated study database of a large clinical prospective cohort study using an R-based CDW interface. Furthermore, we describe the interplay with additional required manual documentation of non-routine but study-relevant data. With this process, we created a single database within an EDC system compliant with the principles of Good Clinical Practice 33 that contains all study data in a common study-specific structure with research-ready variables. To our knowledge, the selection, transformation and mapping of routine data to the data model and visit schedule of a prospective clinical study, along with the pitfalls encountered, has not been described previously in this granularity and extent. In particular, the association of individual variables to documents during transfer and the assignment of values to study visits via a visit schedule specification has not been considered before.
The main limitation of this work is that we collected data from only a single hospital. This is due to the fact that the study required a fairly high level of manual intervention and a comparatively large number of variables. In particular, multi-institutional and -national studies with routine data stand out with their quick construction and large patient numbers, 34 – 36 but lack a particularly high number of variables from special or disease-related technical examinations. Another accompanying limitation is the use of a self-developed CDW, which does not allow for easy transferability to other hospitals, but provided the foundation we needed for such a comprehensive process.
We provided a high proportion of single values by the automated process, which indicates that we were able to capture data with a high granularity, for example, for “medications,” which might not have been possible with a manual entry. The lower proportion of automated variables indicate that there is still potential for improvements. In particular, the automation of data from the categories “encoded data,” “examinations,” “vital signs,” and “medication” may be increased without major difficulties. By contrast, the integration of heterogeneous medical devices is particularly challenging.
In order to increase the automation of variables for this study, we already provided a process to extract information from narrative echocardiography reports and PDF reports for “pulmonary function testing,” “blood gas analysis,” and “Holter-ECG monitoring.” However, the PDF files needed to be added manually to the HIS during routine care, which was not performed with satisfactory reliability and therefore required manual completion. An improved access to far more subsystems using international data standards and their integration into a central HIS would be particularly helpful to improve data acquisition. But faster and better integrated information extraction processes might also improve data coverage.
Our goal was to automate as many data as needed for the study into research-ready variables at an early stage. This included a transformation from the clinical data models to the study’s data model, but also further aggregations and calculations. An alternative to this approach would have been to just extract and store the data in the format provided by the HIS/CDW. Then, the structure of this data would not be comparable to the structure of the manually documented study data (CRFs and visit structure). Thus, the data could not be stored easily in the EDC system itself and may require another database. This scenario would reduce efforts required at the time of the data acquisition, but would require the data to be iteratively merged during study analysis and, thus, would only shift the effort. Major problems might not have become apparent until a very late stage in the study process. In contrast, data that we have already transferred and verified in our implementation might not be necessary for analysis with the granularity initially envisioned and might have become less complex when done later.
The mapping of data from a CDW to an EDC system is already considered in the related work. Pittman and Miranpuri 28 described a linkage between a CDW (i2b2) and an EDC system (REDCap) that allowed to map and sync single variables from the CDW to single variables in the EDC system using a graphical user interface in i2b2. If multiple values existed within the CDW, a single one was selectable by operators (e.g., first and maximum). The synchronization between the two systems further required a mapping of patient identifiers between the two worlds using an external tabular file format. Campion et al. 29 and Gabetta et al. 30 described systems that allowed to import data from any source system using the REDCap Dynamic Data Pull (DDP) interface. DDP is a part of REDCap and allows to automate a pre-filling of eCRF values during manual data entry. It requires a permanent ability to connect to the source system, a permanent mapping between the two identifier worlds and usually an additional middle-ware. In case there are several values in the source system, DDP can be configured to map these values via the date to the study visit. Campion et al. provided a DDP middle-ware with a JSON-based specification of all linked variables including user-defined SQL statements in order create custom queries to various source systems. Multiple data entries were returned with the corresponding date. Gabetta et al. 30 further allowed for more transformations between variables using standard transformation routines (e.g., mapping of categorical variables) or custom aggregations of multiple variables using scripts.
Another alternative might be the usage of existing software that specializes in easing extract-transform-load (ETL) processes using generalized methods with graphical interfaces. Combining such systems with a CDW might enable all required transformations, but is not (yet) specialized for these transformations and could quickly become very complex again. Great potential might also reside in the use of general application programming interfaces (API) added to the HIS, which, if available, could strongly support such study data collections, but without the data homogenization aspects of a CDW.37,38
In contrast to the related work, our system was designed as an add-on to our CDW and can provide data for potentially any EDC system, by allowing to map a large amount of data to study visits and the specific variables prior to the import into the EDC system. Furthermore, we allow to transform granular data from the CDW, while connected on multiple levels (e.g., patient, case, and document) instead of multiple unconnected variables. The latter depends on the type of CDW used. A CDW may contain data from various subsystems for a coherent and simple query, but with a trade-off. A simple query capability benefits from data that is reduced and aggregated to single variables prior to its import into a CDW (early aggregation). In contrast, highly detailed data allows for more use cases, but may strongly increase the query complexity to select and transform combinations of variables (late aggregation).
A major advantage of using R as the implementation technology was the extensive functionality for data selections and transformations of the granular data the CDW provides. But the basic idea of using R originated from the reasoning that once the process is complete, simple adjustments can also be made by a statistician with knowledge of R. However, the manual adjustments to the study process quickly became complex and resulted in an application that rather failed to meet this goal. This was partly attributable to a lack of simple code refactoring methods for R. An aspect that was particularly time-consuming was the identification of issues with missing or incorrect data for individual patients. Better debugging methods covering the entire pipeline from HIS to EDC would markedly reduce this workload.
We needed to take the patient data of whole hospitalization cases, as selected by a study marker that had been manually added to the HIS at study start. Therefore, a close cooperation between the HIS and CDW is mandatory in order to select the correct data required for the study. However, many small issues in the routine hospital process contributed to missing data in the CDW, for example, data was added to a previous case, data was added after export to the correct case, or data was added to a parallel case created by another department for consult or actual patient movements. Furthermore, some data was not documented with a case, but only with the patient identifier by default. Thus, a selection of a patient case using a study marker in the HIS may have been more time-consuming in the end than if we had chosen a manual definition of the study visit times right from the beginning.
We began data extraction for this study several years after the start of the local CDW. Especially at the beginning of the CDW project, there was a lot of discussion about and changes to the understanding of the data, the data model, the way the data should be searchable and presented to the user, and ultimately the programming code (e.g., refactoring, new/removed modules). Subsequently, the process of extracting data from the HIS into the CDW, was changed several times, which was still evident at the beginning of this project when we encountered diverse errors within the prepared data that were not intuitively explainable or easily correctable. We therefore introduced the verification steps described in Data verification (V1-6) of the overall or partial process in order to maintain the data quality for the course of the study.
Manual adjustments of the data to the reality of the study were inevitable. However, we also received indications of potential errors during the time, when there was no error present. These often resulted from the fact that an exact specification of the process also ensured the exact assignment of data. Multiple times we observed that a manual selection of an examination led to a (false) assignment to another visit. Sometimes, data might have been selected manually that actually belonged to another, somewhat later case. Such errors may be of less importance regarding the (multiple) daily visits, but even more so for the (infrequent) follow-up visits.
We separated the task of exporting data from the CDW (CDW-Java-API) from the data preparation (R). However, it turned out that keeping all versions of source data used for the study data preparation is a very helpful and essential feature. This is especially true in a CDW environment that may be changing due to daily updates, but also due to advancements in the CDW system itself. On several occasions, it was helpful to debug the code and compare data from later preparations with verified imports.
Conclusion
Comprehensive and automated transfer of routine medical data from HIS to study research databases under consideration of study-specific data and visit structures is viable but challenging, even if only done in a single hospital. While large amounts of values can be automated at higher levels of detail for some data domains, there is great potential for further increases in automated variables, but a full automation may never be possible.
Footnotes
Author Contributions
MK and SS conceived the presented idea. MK, GF, MH, and FP implemented the system. MK analyzed the data and drafted the manuscript. ME and GF did substantial contribution to the data acquisition. All authors critically revised the manuscript.
Declaration of Conflicting Interests
The author(s) declared no potential conflicts of interest with respect to the research, authorship, and/or publication of this article.
Funding
The author(s) disclosed receipt of the following financial support for the research, authorship, and/or publication of this article: This work was supported by the Bundesministerium für Bildung und Forschung grant number 01EO1004 and 01EO1504. This publication was supported by the Open Access Publication Fund of the University of Wuerzburg.