
Abstract
Healthcare big data has raised expectations for secondary use in research and information-based management. This case study explores limitations of using electronic health record (EHR) data from a hospital data lake by deriving indicators on opioid prescribing. A multi-staged method to calculate indicators of rational opioid use was developed covering both inpatient orders and outpatient prescriptions. The process included data selection, editing, organization, and validation. Visual Basic was employed to calculate indicators and to semi-quantify data limitations. Data (2015–2019) covered 3.3 million patients with 179,853 opioid and 22,415 benzodiazepine orders. Data quality issues, including unstructured, irregular, and invalid entries, limited analysis to indicators on opioid use and contraindications. In conclusion, secondary use should be considered in EHR system development. Data should be recorded in structured and unambiguous format, and methods for data quality measurement should be developed to ensure high-quality data is readily available in data lakes.
Background
Deficiencies in rational use of medicines- defined as the effective, safe, high quality, cost-effective and equitable use of medicines 1 - such as unintentional polypharmacy, are a leading cause of injury and avoidable harm in health services systems.2,3 To improve rational use of medicines, particularly in terms of safety, health care organizations need to identify the risks associated with their medication use processes, evaluate the magnitude of the risks, and to implement systems-based safeguards to practice. For the risk identification, healthcare big data stored in the data lakes of healthcare organizations have been suggested to provide a rich source of information. 4 These types of data lakes, containing, for example, electronic health record (EHR) data, are under development and implementation phase in healthcare organizations internationally. 5 They are usually targeted for preventive healthcare and research, and enable the analysis of large datasets over time to create healthcare-related predictions and innovations. 6 In data lakes, the data are organized in a manner that enables data sources to be structured and linked with each other (e.g., genomic and imaging data) in real-time for varying purposes. For research, this means the possibility to focus on data analysis without individually gathering data on patients from different data systems. This type of clinical data application is referred to as secondary use of patient information. 7 It is regulated by national and European data legislation (e.g., Finlex 522/2019; EU 679/2016) and enables the utilization of healthcare big data in academic research, information-based management, and developing the operations of the organization gathering the data.
Despite high expectations for and pressure towards secondary use of healthcare big data, practice has shown that the data are usually difficult and complex to analyse. 8 Moreover, the international research exploring usability and potential limitations of data extracted from a lake data in identifying risks in safe and rational medication use is currently lacking. This represents an important area of research; healthcare organizations should be able to effectively utilize the existing information sources especially for discovering risks of high-risk medications that may cause fatal patient outcomes if used in error. 9 Such medications constitute for example, antineoplastic agents, antithrombotic agents, and opioids, of which opioid-related incidents are among the most frequently reported fatal ones.10,11 Opioids are also associated with a risk of intentional misuse, such as concurrent use of opioids and other sedatives such as benzodiazepines, and alcohol, which has been affected by increased opioid consumption in the Western population during the recent decades. 12 Consequently, the safe and rational use of opioids should be optimized across health services systems.
The present study used EHR data extracted from a data lake of a large, specialized care hospital to explore its usability for secondary use by semi-quantifying potential limitations. Opioids were selected as a case medication group. The study seeks to support health services systems in developing their EHR systems for better secondary use of clinical data in promotion of safe and rational medication use, as well as improving the quality of the healthcare big data.
Methods
Design and setting
The study was a retrospective register-based study using EHR data from a public specialized medical care hospital in Finland. In the 2010s, the hospital established a data lake combining data from different data systems, comprising repositories, such as EHR, biobank, imaging, and patient-reported outcomes, and administrative systems. In the data lake, rich patient information from different treatments can be combined as aggregates or at the patient-specific level using pseudonymized patient identifiers. The study process through which the potential limitations of the EHR data extracted from the lake data were explored, is presented in Figure 1. Exploring the usability of EHR data from a hospital lake data for research in safe and rational use of medicines. This was conducted by semi-quantifying potential limitations of the data when using opioids as case medications.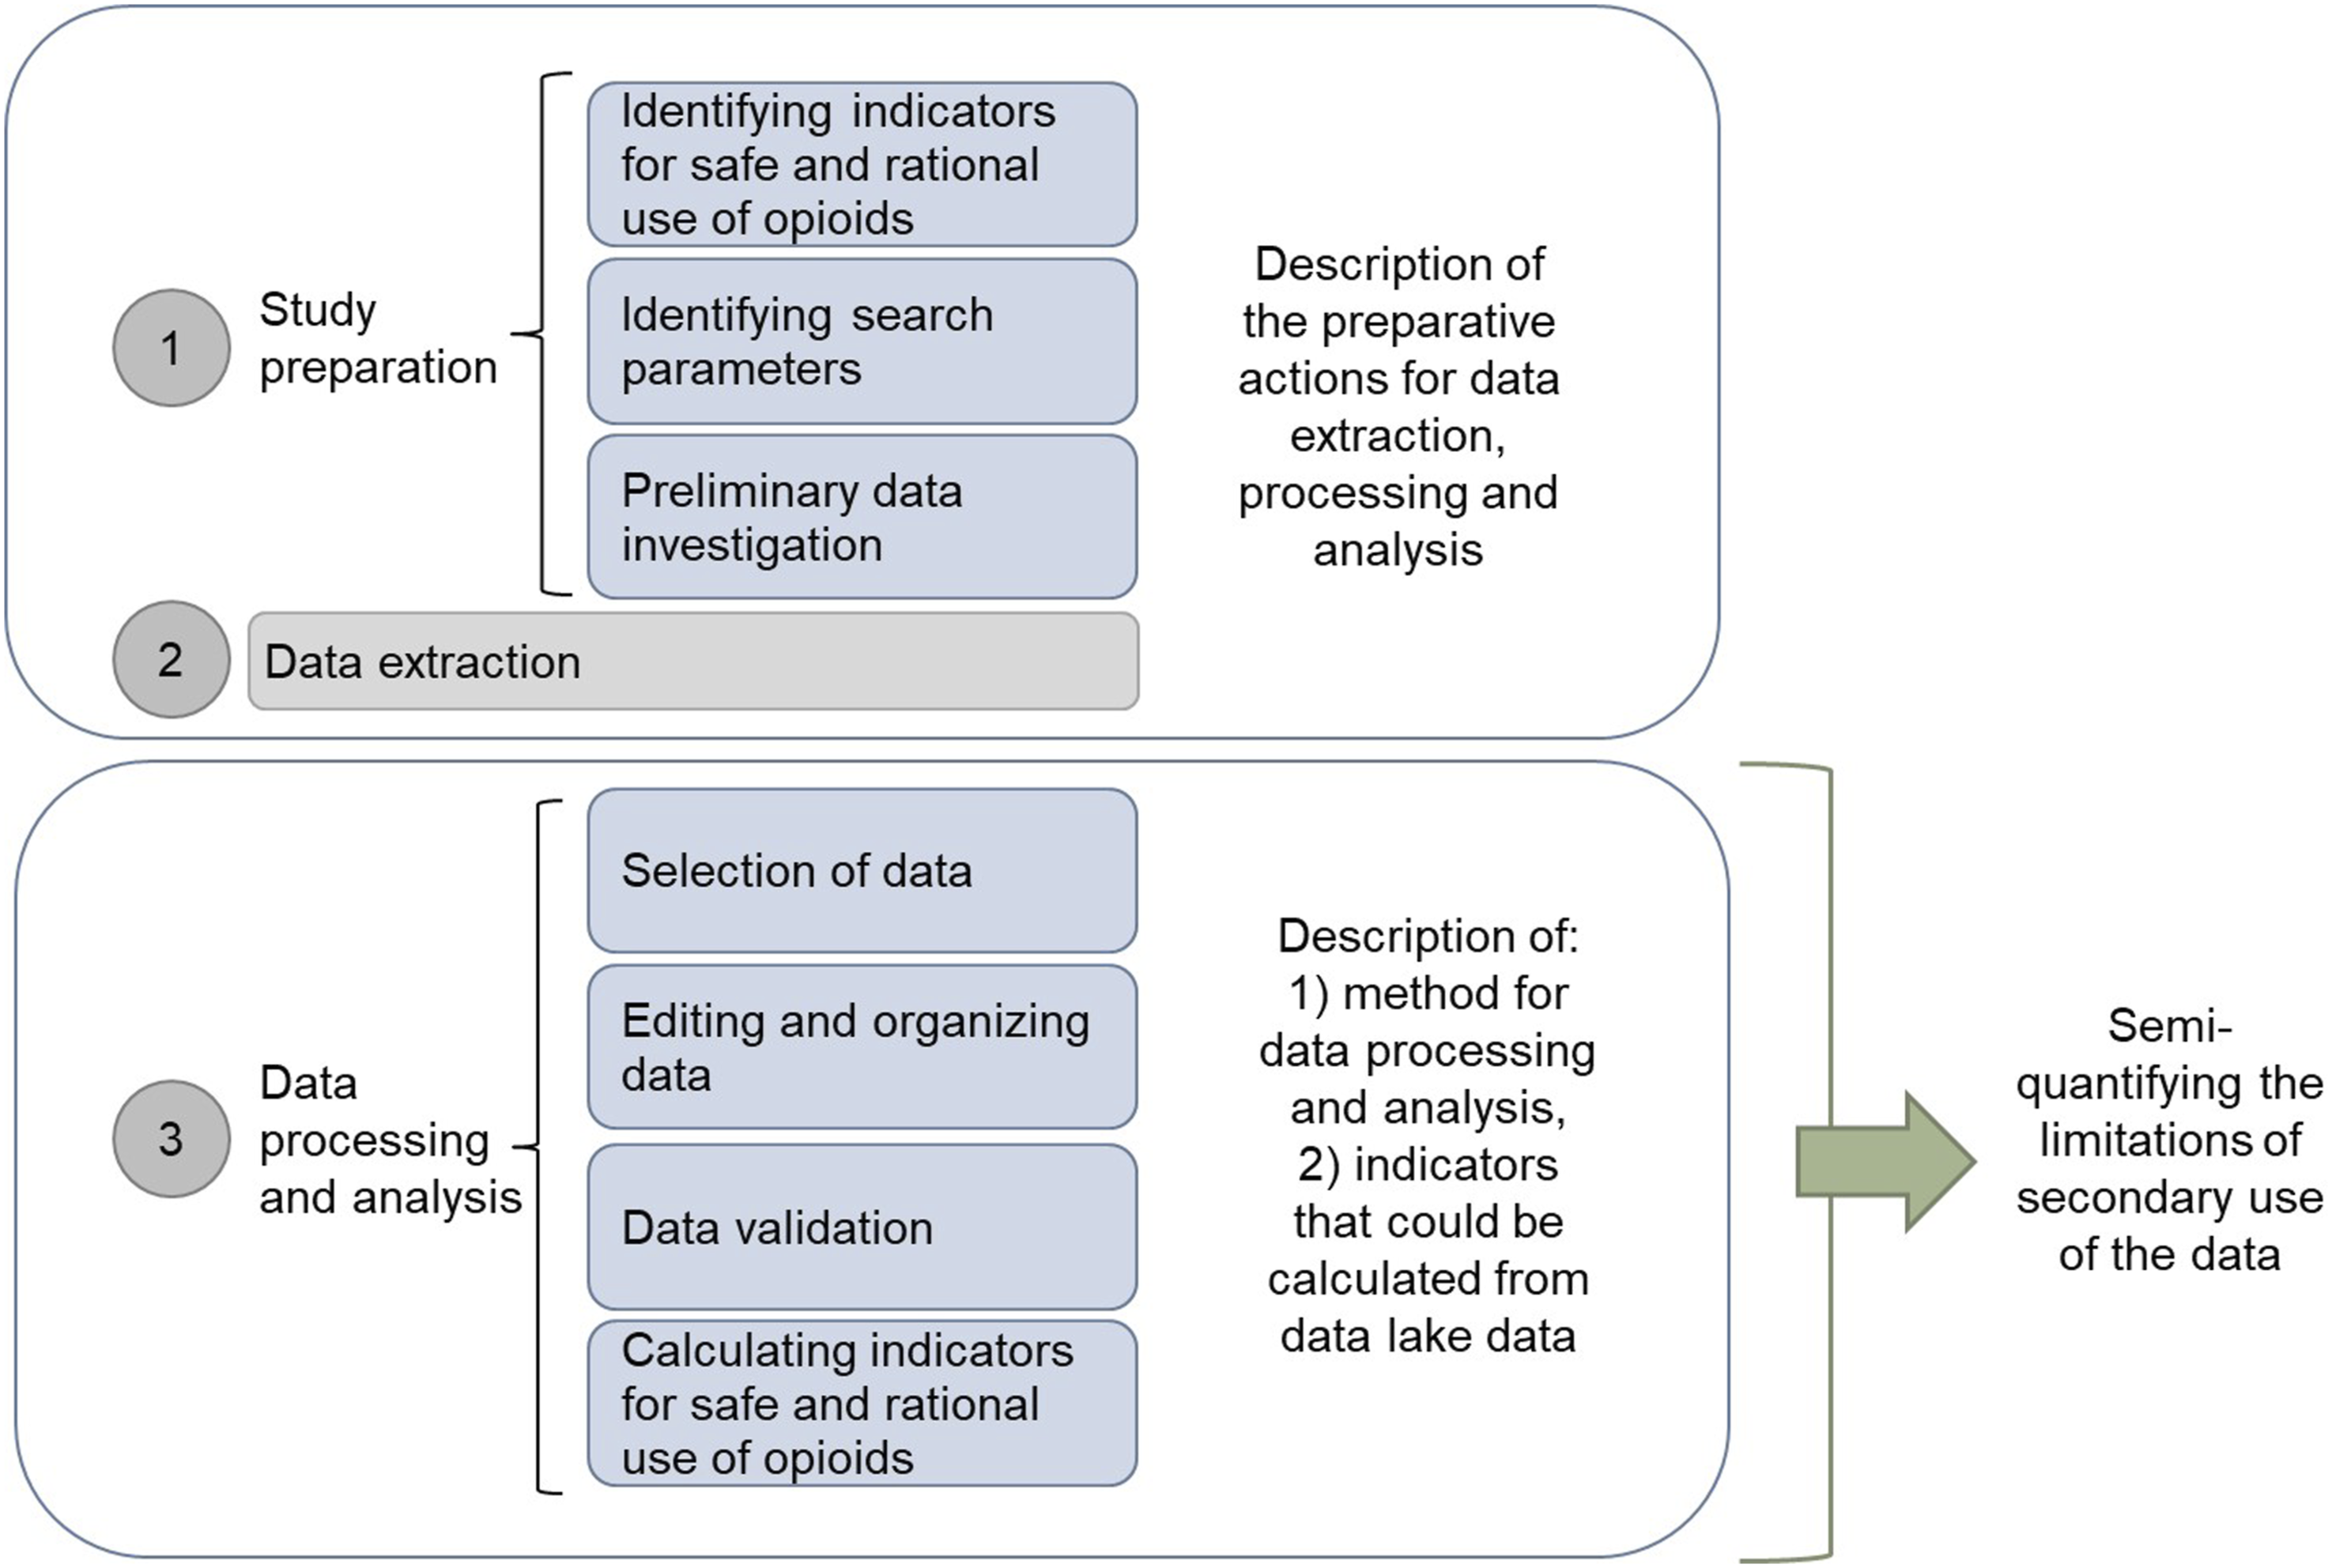
Study preparation
Identifying indicators and search parameters
The study was restricted to prescribing data (including inpatient medication orders and outpatient discharge prescriptions), which is the first phase of the medication use process, followed by dispensing, administration and monitoring. First, indicators for safe and rational opioid use were defined based on Centers for Disease Control and Prevention (CDC) recommendations and relevant literature (Figure 2).13–17 Based on the indicators, we identified the target objects (e.g., duration of continuous medication in days), along the necessary data and parameters required for their calculation. Two types of data were required: row-format prescribing data on patient-specific level, and aggregate data providing summary information on patient groups. The data also included a pseudonymized identifier to enable grouping and analysis per patient. In addition, the following data for validation and grouping purposes were obtained: medication administration route, additional dosing information (e.g., instructions for post-operation use), and reasons for discontinuing or changing the medication treatment. To enable feasible calculation of the indicators, only numerical data (e.g., dates, doses, strengths, reason codes), and textual data with predictable and limited options (e.g., dosage forms, active substances, and associated Anatomical Therapeutic Chemical (ATC) codes) were included. The defined indicators for the safe and rational use of opioids, the identified objects for their calculation, and the parameters for EHR data extraction from the hospital data lake.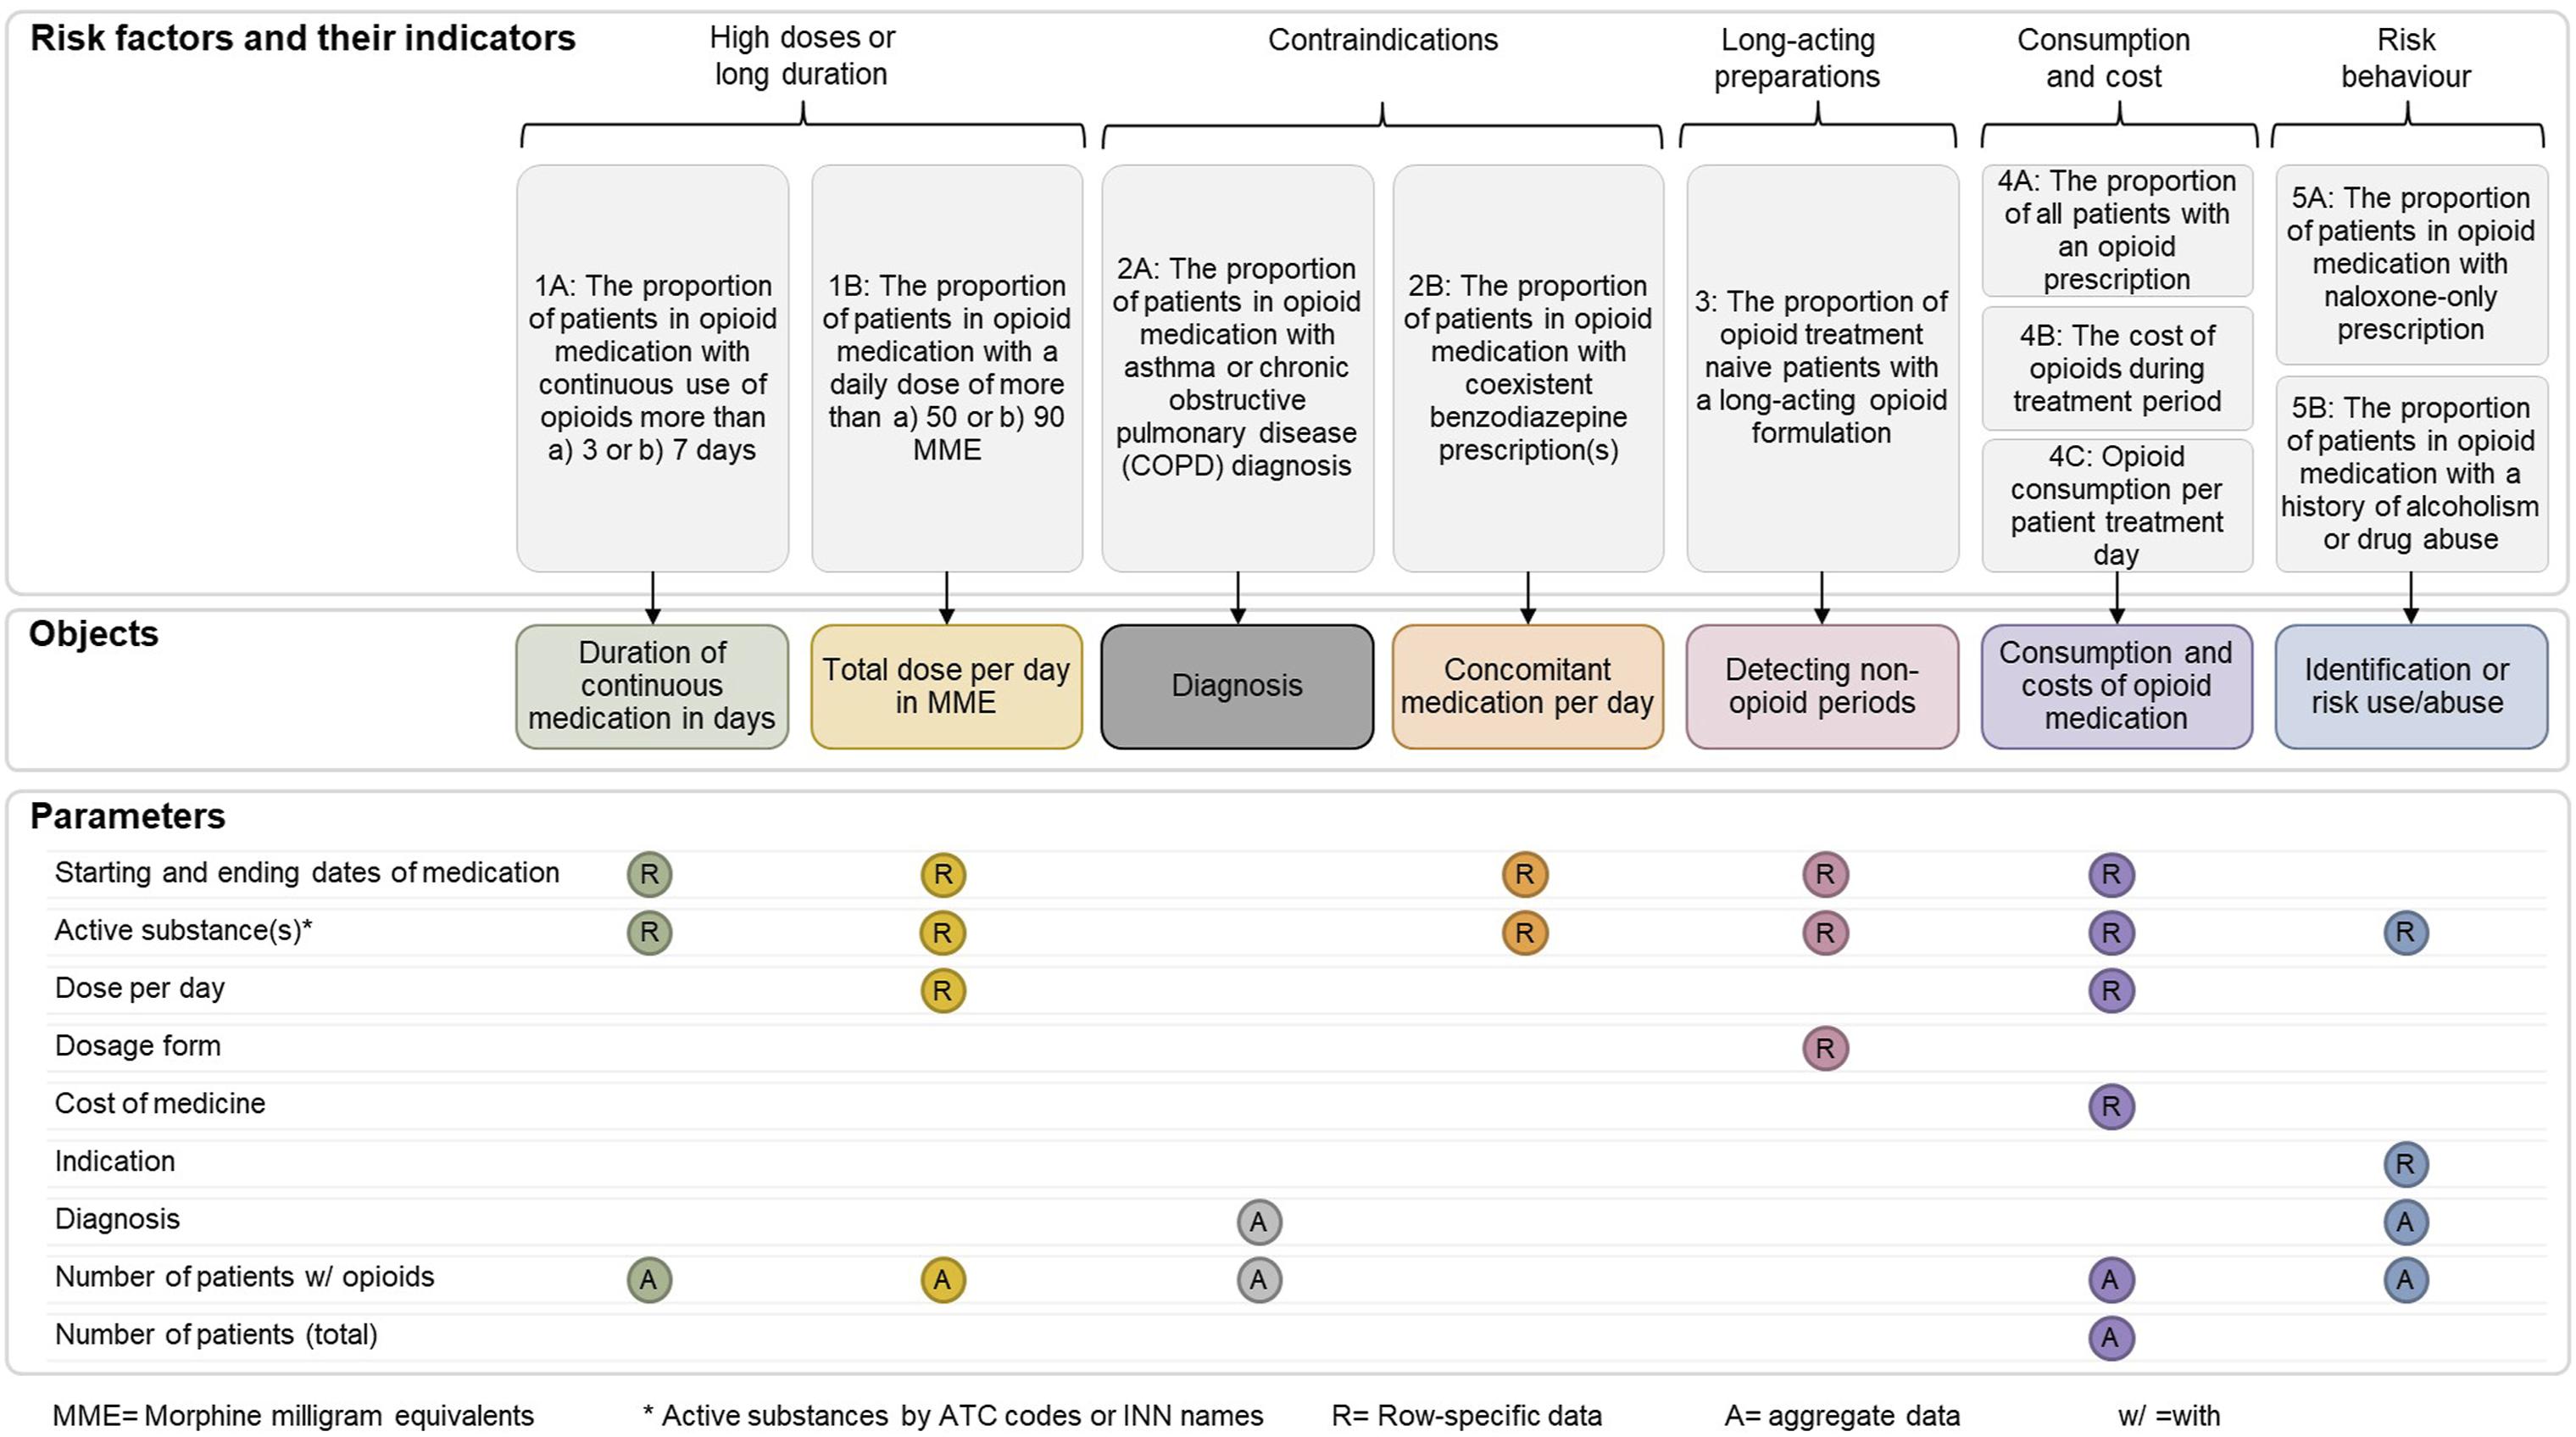
Preliminary data investigation
Before extracting the actual research data, a preliminary data investigation was conducted to gain an overview of the data availability (e.g., the number of rows, data structure, and parameters) (Figure 1). The investigation covered the period between January 2010 and March 2020, and the data was obtained from the former EHR (non-EPIC based) of the study hospital which was fully replaced by Epic-based EHR since the autumn of 2020. The number of prescriptions and patients treated per year was received and analysed in terms of annual changes in frequencies. During that period, about 38 million prescriptions were prescribed in the hospital and approximately 9% of them concerned opioids. Data from January 1, 2015, to December 31, 2019, were selected for the study due to observed consistency in annual prescription volumes. For this 5-year period, approximately 2.3 million rows of opioid prescription data were estimated to be available for around 290,000 patients. Duplicates were not assessed at this phase. Nevertheless, the volume of data was considered adequate for proceeding to the indicator analysis phase.
Data availability
The preliminary data investigation unveiled the parameters for which the data could not be obtained, and hence reflecting data limitations. The unavailable data included the cost of the patient’s medication, leading to exclusion of indicator 4B (Figure 2). It was also not possible to study the risk factors of opioid use, such as alcoholism or narcotics abuse, since the reason for hospital admission, diagnoses, and medical history were not available in structured form (indicators 2A, 5B; Figure 2). For the parameters for which the data was available, please see Supplemental File 1.
Data extraction
From January 2015 to December 2019, EHR data on approximately 3.3 million patients were collected from hospital data lake. A total of 1.73 million rows of opioid prescription raw data from 321,000 patients were received in comma separated values (csv) format in March 2020. Altogether 13,000 naloxone prescriptions were excluded from the opioid data and handled separately. An additional data set of 419,000 rows comprising benzodiazepine prescriptions were received (indicator 2B).
The extracted data comprised patients from all departments of the hospital, excluding the intensive care units which used a different EHR. All the patient-level raw data consisted of medication orders prescribed during the patient hospitalization and prescriptions prescribed at discharge. In addition to the patient-level data, aggregated data on the annual number of patients with chronic obstructive pulmonary disease (COPD) or severe asthma who were also prescribed an opioid, were obtained (indicator 2A).
Data processing and analysis
The data were processed and analysed with Microsoft Excel and Visual Basic programming language in four phases (Figure 1). First, data relevant to this study were selected from the opioid prescription raw data, followed by data editing and organizing. Before calculating the indicators, the validity of the data was assessed. The limitations for secondary use of the data were semi-quantified as an outcome of the data processing and analysis (Figure 1).
Data selection
Initial data extraction included 320,000 rows of outpatient opioid prescription data, which were excluded due to unstructured dosing instructions, rendering daily dose and treatment duration indeterminable (Figure 3). The final dataset comprised 1.41 million rows of inpatient opioid orders, which were further filtered for structured, numerical dosing data and textual data that could be processed as structured data (Table 1). Data availability and selection of opioid orders by data rows for further analysis. Extracted parameters, their planned purposes for data processing and analysis, descriptions, examples of, and usability. aG = grouping, I = indicator calculations, V = validation of the data. bAn imaginary pseudonymized patient ID. cParameters with established format (and location) or limited number of options enabled the feasible extraction of the required values from the text and handling the text data as numeric.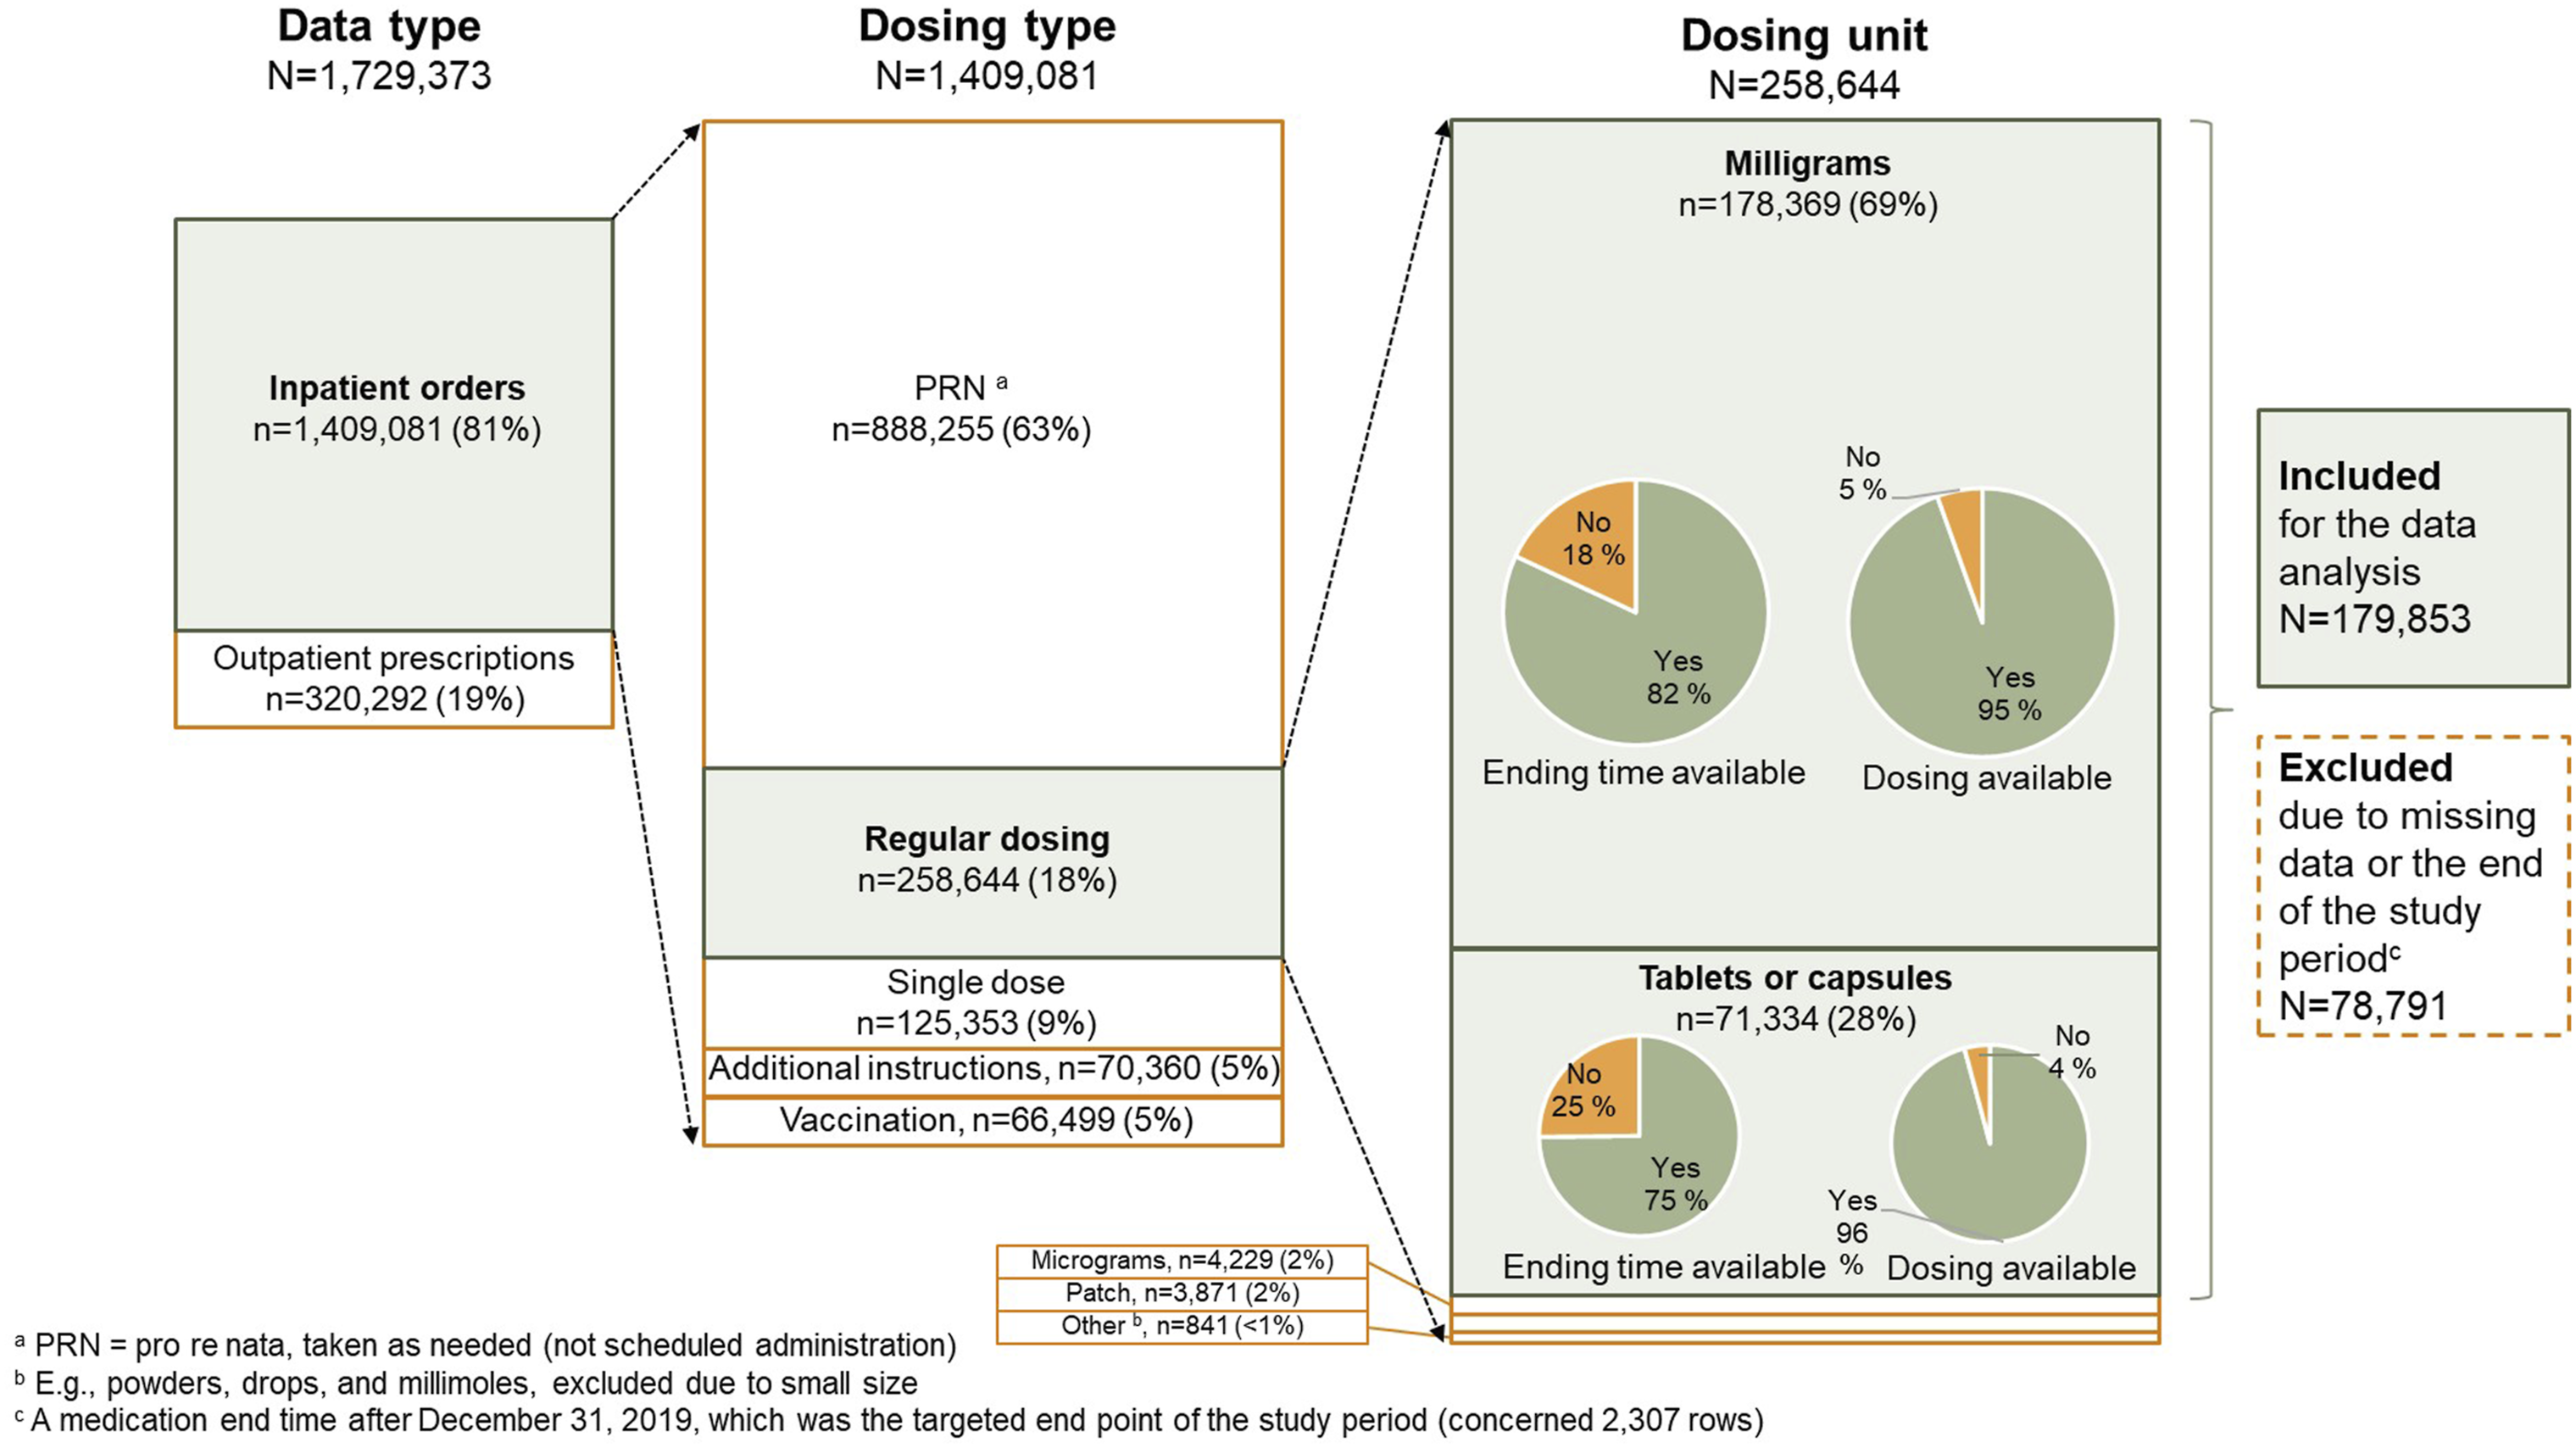

Inpatient ordering data were categorized by dosing types: PRN (pro re nata), regular dosing, single dose, and dosing per separate instructions. Vaccination data were excluded due to potential entry errors. PRN and additional instructions for dosing data, both consisting of free text, were also excluded, focusing the analysis on regularly dosed medications (n = 258,644 rows) (Figure 3). Due to free text format, naloxone usage data (indicator 5A) were excluded, as the specific indications for treating respiratory depression versus other side effects, such as constipation, could not be determined.
The most common dosing units were milligrams (69%) and tablets or capsules (28%) (Figure 3). The medication start time was given for each of these orders, but the ending time was missing in 18-25% of cases (Figure 3). In addition, 4-5% of the rows were missing dosing information. If either of the data was missing, the row was excluded. Thus, the dosing unit of tablet, capsule, or milligrams was selected for data analysis, containing a total of 179,853 rows of opioid data. A similar procedure was performed on the benzodiazepine data, resulting in 22,415 rows of benzodiazepine prescription data.
Data editing and organizing
The data contained irregularities which prevented calculating the objects (e.g., MME, daily dose) for the analysis of some indicators (1A, 1B and 2) (Figure 2). These irregularities were harmonized by using algorithms to edit and organize the data. e.g., a typical entering format for the strength of active substances in combination medicinal products were xx/yy, but was occasionally entered as xx + yy, where xx and yy represent the strengths of individual active substances. Consequently, the strengths were edited by separating them by a slash (e.g., 5/10 mg). For the analysis of patient-specific prescriptions, the regular opioid and benzodiazepine drug rows per patient were arranged in descending order by starting time.
A central step of the editing process was to extract numerical data from textual data, which was relevant to the start and end times of the treatment and the strength of the medicine (indicators 1A, 1B, 2B, 3, 4A, 4B, 4C). The start and end dates of the medication were in complex format in the data (e.g., 2019-01-06T00: 00: 00.000Z), and hence, were converted into the format of dd-mm-yyyy (e.g., 06-01-2019). For the strength of the drug, both the numbers of digits and units varied (e.g., 5 mg, 10 mg/ml, or 150 mg), but the information could be extracted from the text.
Data validation
The accuracy of the data was verified before the final calculation of the indicators (Figure 1). Validation was performed for the opioid dosing (i.e., Regular Daily Dose and Single Dose) and duration data. These were among the most critical items enabling indicator calculation and hence were selected for the data validity assessment.
Data related to dosing
The opioid dosing frequencies were typically 1–4 times a day (Supplemental file 2, Figure S2(a)), covering more than 98% of the data (n = 179,853). However, with the rest of the data, outliers were identified, the largest values being hundreds and even thousands. When the dosage type was a tablet or a capsule, fewer dosing times were observed than with milligrams. Consequently, the highest values most likely represented the dose of the drug in milligrams, not the number of doses per day, reflecting the irrational nature of the data. The numerical values that were most likely too large to describe the number of doses per day (e.g., >6), but too small to represent the number of milligrams per day (e.g., <20), were impossible to interpret.
A different validation approach was chosen for evaluating the opioid dosage in each administration event (Supplemental file 2, Figure S2(b)). The dosage in milligrams and the strength were converted to the number of tablets or capsules. The number of tablets or capsules was typically 0.5, 1, or 2 (Supplemental file 2, Figure S2(b)), accounting for 94.7% of the total number of tablets or capsules in single-dose administration. However, both irrationally big values and small values (e.g., less than 0.5) were present in the data, most likely due to incorrect entry of the original data. There were several examples in the data where the calculated number of tablets or capsules included an irrational decimal fraction for example, the number of tablets or capsules was 1.125, 1.66, or 2.66, also indicating a potential false data entry.
Data related to medication duration
The validity of the data on duration of inpatient opioid treatments was also evaluated. This was conducted by calculating the treatment days using the medication starting and ending dates per row (Supplemental file 2, Figure S2(c)). Typically, the duration of the opioid treatment was a few days, and the number of rows decreased rapidly as the duration of the treatment increased. However, the cumulative percentage of the number of rows did not increase over 80% within 15 days, suggesting that the data contained several opioid prescriptions with a duration of more than 15 days.
Ethics
The research approval was obtained from the study hospital. An Ethics Committee review was not required as the study did not involve patients directly nor was it categorized as a clinical study. Patient data were pseudonymized before being provided to investigators without the key code to pseudonymization. The data were processed in accordance with the General Data Protection Regulation (EU 2016/679). 18
Results
Limitations of secondary use of the data
Summary of risk factors, their indicators, and the limitations of the EHR data extracted from the lake data to calculate the indicators.

aMorphine milligram equivalents.
bNote: In Finland, the costs of inpatient medicines are included in the costs of the treatment days.
Calculation of indicators for safe and rational opioid use
Due to the uncertainty of dosing parameters and medication durations (Supplemental file 2), most indicators (1A, 1B, 2B and 3A; Figure 2) could not be calculated reliably (Table 2). For a more detailed demonstration of the deficiencies in data reliability, please see the (Supplemental file 2 (Figures S2(a)–S2(c)).
In addition, patient-specific medicines’ price data were not available to calculate indicator 4B. The lack of structured diagnosis data prevented the analysis of indicator 5A. Risk behaviour indicator 5B could not be analysed because data on alcoholism or drug abuse was unavailable. Therefore, only indicators 2A (proportion of patients on opioid medication with asthma or a chronic obstructive pulmonary disease) and 4A (proportion of all patients with an opioid prescription) could be calculated; indicator 2A used aggregate diagnosis-related data whereas indicator 4A used the patient-level data. For the results of calculated indicators 2A and 4A, please see Supplemental File 3.
Discussion
The present study demonstrated that the possibilities for secondary use of EHR big data acquired from a data lake of a large, specialized care hospital were limited. Due to extensive data limitations, it was not possible to form an overall representation of the safe and rational use of opioids as a high-risk medication case group. Also, the development of methodology for processing and analysing EHR data from a data lake was laborious and required special information technology and data analytics expertise. The challenge of the work was further increased by the fact that the current research literature hardly describes the stages of processing this kind of data in studying safe and rational pharmacotherapy.
The unstructured format of the data represented the key individual limiting factor for applying the data for feasible calculation of the indicators. Unstructured data appeared in different formats across the data, ranging from inpatient order and outpatient prescription data to medication administration data. The key challenges stemmed from uncertainties in dosing parameters and medication duration (Supplemental File 2; S2a and S2b), most likely due to the EHR permitting users to input varying dosage information within the same fields (e.g., “2 doses” implying either to 2 mg or tables). Although some of the unstructured, text formatted inpatient order data could be converted to numeric, this required massive manual data harmonization and creation of specific algorithms. Especially, administration-related data in orders contained random free text that would have required sophisticated analysis methodologies, such as artificial intelligence (AI) or machine learning (ML) based deep learning techniques in which neural networks can be used to identify relevant information from EHR data. 19 Similar findings have been made by Kim & Kim et al.; the data in electronic patient records tends to mainly consist of free text which is difficult to analyse in academic research. 20 Within this study, the unstructured data prevented data aggregation and investigating the overall opioid treatment of the patients, since the unstructured outpatient prescription data needed to be excluded. This is a key constraint also on other patient information systems; poor management of a patient’s overall medication has been identified as one of the greatest risk factors for safe and rational medication use, especially in relation to high-risk patient groups and high-risk medications, such as opioids.3,13,14
The study showed major deficiencies in the reliability of the data collected from non-structured EHR system which was replaced by Epic-based system in 2020. Ensuring the data reliability is pivotal as it represents a prerequisite for secondary utilization of healthcare big data in academic research. 15 According to a few internationally published studies, conclusions about the quality and reliability of data have been similar.16,17,21 In this study, for example, the values of administration-related parameters did not always correspond to the description of the parameter; a single value in the data could reflect either administration times per day or the dose in milligrams per one administration. Another example was irrationally long opioid treatments (an average of 94 days) when compared to the clinical guidelines and the average length of hospitalization being 6.4 days in Finland (2018). 22 In the context of the present study, these findings reflect non-standardized data recording that allow personal data entry styles to take place between different professionals in the clinical practice. Indeed, non-standardization does not support the secondary use of patient data in research, nor the knowledge-based management of healthcare organizations. It is also identified as a central patient safety risk factor. 23 Consequently, secondary use of patient data should be better considered when developing data regulation, health policies, as well as EHR systems and representative data lakes, as structured data entry also improves patient safety and EHR system availability, 24 and hence, is a therapeutic benefit.
Missing and invalid data represented other key limitations of the EHR data from a data lake in the present study. The most important parameters were related to the calculation of the daily dose and the timing of the prescribed opioids during hospitalization. However, the end time of the medication was missing in approximately 20% and the dosing information in 5% of the treatments. Invalid data was mostly related to administration recordings, which expressed unrealistic values. Indeed, missing and invalid data are one of the most typical weaknesses in patient data and applies to both paper and electronic prescriptions.20,25,26 In academic research, this limits the size of the patient population to be analysed and may cause bias in the data, and thus, invalidate the findings. 21 Correction algorithms for erroneous data have been presented in the literature. 27 In addition, statistical methods such as imputation may be used to estimate missing values, provided that the data quality issues are well understood and appropriately accounted for. 28 However, more important would be to understand why erroneous values emerge in patient data and to improve data recording processes of EHR systems.
Limitations and targets of development
The most central limitations of the study, such as the inability to calculate most of the indicators, were mainly due to deficiencies in the EHR data obtained from the data lake used in the present study, and the limited resources allocated for data picking, harmonization and validation. An example of such data deficiencies were the inability of calculating risk factors for opioid use because of the lack of information in the data lake. In addition, performance of the developed algorithms was not verified by another researcher, which may have impacted their reliability. If the data had enabled the calculation of the indicators, the division of patients into groups according to the diagnosis, i.e., cancer patients and patients with other diagnoses, would have facilitated the assessment of data validity. These aspects, and the availability of data lake analytic expertise should be covered in future studies for data curation.
Based on the findings of the present and the previous studies, a large sample size does not necessarily guarantee high quality research if key data are missing and data quality and reliability is poor.29,30 Despite the challenges, utilizing data collected in data lakes should be seen as an opportunity for systems-based medication risk management and a target of development. Reliable detection and removal of incorrect data represents a key area for methodological development, with involving AI/ML approaches. It should also be assessed what kind of data quality can be considered acceptable and how the quality of the healthcare big data should be measured.16,17 Moreover, limits should be set on how much inaccurate or unreliable data can be allowed.31,32 Also, combining data lake data with other sources of medication therapy information, such as national drug consumption or care registries (e.g., Kela or Hilmo in Finland), might provide a more comprehensive and reliable representation of medication treatments in future studies.
Conclusions
The present study indicates that the secondary use of healthcare big data should be considered when developing EHR systems and data lakes. Based on the studied EHR data collected in the data lake, the EHR data should be recorded in structured format for generating aggregate-level data describing a large number of patients. For a more comprehensive representation of patients’ overall medication treatment, combining data from different patient data registers is recommended. To enable this, the recording of patient data requires nationally, pre-agreed, consistent health policy-level procedures supporting the secondary use of the data. In addition, methods for data quality measurement for secondary use of patient data should be developed. This would ensure that the data used for academic research and information-based management is of high quality and readily available in data lakes.
Supplemental Material
Supplemental Material - Are electronic health record big data ready for secondary use in research? Exploring potential limitations with opioids as a case study
Supplemental Material for Are electronic health record big data ready for secondary use in research? Exploring potential limitations with opioids as a case study by Hanna M. Tolonen, Jouni Kaukovuori, Marja Airaksinen, and Anna-Riia Holmström in Health Informatics Journal
Footnotes
Acknowledgement
We would like to thank the following experts for their valuable contributions to the study: Outi Lapatto-Reiniluoto MD PhD, Head of the Clinical Pharmacology Department at HUS Helsinki University Hospital, for her valuable comments during the data processing and analysis; and Adjunct Professor Visa Honkanen MD, Development Director, HUS Helsinki University Hospital for his valuable comments during the finalizing stage of the study.
Consent to participate
This article does not contain any studies with human or animal participants. There are no human participants in this article and informed consent is not applicable.
Author contributions
Contributions of the authors are listed in the following. HMT and JK contributed all stages of the study, including study preparation and developing the study methodology, data processing and analysis, and being contributors to writing the manuscript. MA, as a senior researcher, was responsible for study initiation, and contributed to study planning and methodology development, data interpretation, and participated in writing the manuscript. ARH acted as a senior researcher of the study and has contributed to all stages of the study, including study preparation and developing the study methodology, data processing and analysis, and actively contributed to writing the manuscript. All authors have read and approved the final manuscript.
Funding
The authors received no financial support for the research, authorship, and/or publication of this article. This research received no specific grant from any funding agency in the public, commercial, or not-for-profit sectors.
Declaration of conflicting interests
The authors declared no potential conflicts of interest with respect to the research, authorship, and/or publication of this article. The authors declare that they have no conflicting interests.
Data Availability Statement
The data that support the findings of this study are available from Helsinki University Hospital but restrictions apply to the availability of these data, which were used under license for the current study, and so are not publicly available. Data are, however, available from the authors upon reasonable request and with permission of Helsinki University Hospital.
Supplemental Material
Supplemental material for this article is available online.
References
Supplementary Material
Please find the following supplemental material available below.
For Open Access articles published under a Creative Commons License, all supplemental material carries the same license as the article it is associated with.
For non-Open Access articles published, all supplemental material carries a non-exclusive license, and permission requests for re-use of supplemental material or any part of supplemental material shall be sent directly to the copyright owner as specified in the copyright notice associated with the article.