
Abstract
Vitamin D is among the vitamins necessary for both adults’ and children’s health. It plays a significant role in calcium absorption, the immune system, cell proliferation and differentiation, bone protection, skeletal health, rickets, muscle health, heart health, disease pathogenesis and severity, glucose metabolism, glucose intolerance, varying insulin secretion, and diabetes. Because the 25-hydroxyvitamin D (25OHD) test, which is used to measure vitamin D is expensive and may not be covered in healthcare benefits in many countries, this study aims to predict vitamin D deficiency in diabetic patients. The prediction method is based on data mining techniques combined with feature selection by using historical electronic health records. The results were compared with a filter-based feature selection algorithm, namely relief-F. Non-valuable features were eliminated effectively with the relief-F feature selection method without any performance loss in classification. The performances of the methods were evaluated using classification accuracy (ACC), sensitivity, specificity, F1-score, precision, kappa results, and receiver operating characteristic (ROC) curves. The analyses have been conducted on a vitamin D dataset of diabetic patients and the results show that the highest classification accuracy of 97.044% was obtained for the support vector machines (SVM) model using radial kernel that contains 18 features.
Introduction
Diabetes is a global public health problem affecting 387 million people, and by 2035 the number is estimated to increase to 592 million worldwide. Around 700 people in the world are diagnosed with diabetes daily, which is equivalent to one every 2 minutes. 1 Diabetic adults are likely to have hospitalization for myocardial infarction 1.8 times more and cerebral vascular accidents 1.5 times more. The reports of the International Diabetes Foundation state that more people die every year from diabetes and complications than those combined with HIV/AIDS, tuberculosis, and malaria. In addition, diabetes places a significant burden on health systems. Medical costs for the care of diabetic patients are 2.3 times higher.2–5 Poorly controlled diabetes may cause health complications that result in hospitalization, disability, and premature death. 6
In recent years, research show that there are factors that can be associated with diabetes risk. One of these factors is that the role of vitamin D has expanded to modulate the immune system, cell proliferation and differentiation, and glucose metabolism.7–11 It is mainly known for its importance in maintaining skeletal health, yet research have proven that vitamin D also plays a wide range of roles from reproduction to adult chronic diseases. Studies investigate the potential involvement of vitamin D with disease pathogenesis, severity, and perhaps treatment.12,13 In France, a study aimed at characterizing a weak population of adults over 65 years old found that almost everyone (>95% of participants) had clinical vitamin D deficiency. 14 Another study conducted in Iran investigated vitamin D deficiency prevalence with a sample size of 26,042 people, and the overall prevalence was reported as 0.56. 15 A great deal of evidence has shown that vitamin D plays a role in abnormal glucose metabolism, glucose intolerance, varying insulin secretion, and diabetes.16–20 Observational studies showed that the risk of diabetes was positively associated with decreased vitamin D concentrations. Another systematic review verified this evidence by increasing vitamin D intake above 500 international units (IU)/day reduced the risk of diabetes by 13% compared to less than 200 IU/day. People with a 25OHD status higher than 25 ng/mL had a 43% lower risk of developing diabetes compared to those with a 25OHD status lower than 14 ng/mL.21,22
Vitamin D is a secosteroid hormone synthesized through a chemical reaction in the skin during sun exposure. 23 It is naturally found only in a few foods and supplementation can raise vitamin D status. The positive effect of vitamin D supplementation to reduce the risk of rickets has been accepted for almost 100 years.24,25
Because the 25OHD test which is used to measure vitamin D is expensive and may not be covered in healthcare benefits in many countries, this study aims to predict vitamin D deficiency in diabetic patients by using historical electronic health records. To do that data mining techniques were used. Data mining is the process of finding unknown patterns in a dataset. By using these patterns, it builds predictive models. This study implements the analysis of various data mining techniques which can be helpful for medical staff for accurate diagnosis of vitamin D deficiency in diabetic patients. These techniques are relief-F, SVM, random forest (RF), and logistic regression (LR). By using these techniques, we aimed to achieve the best possible performance of prediction accuracy of vitamin D deficiency in diabetic patients. With the aid of this study, it will be straightforward to decide on patients’ medical status.
Related studies
We found that other authors and other publications reported interesting findings related to vitamin D deficiency. However, studies on predictive models for vitamin D deficiency cannot be easily compared, due to the heterogeneity of their aims and the recruited population. As such, Guo et al. (2013) used the data of 494 Caucasian adults for vitamin D status prediction. The study was modeled using multiple linear regression and radial basis function support vector regression (RBF-SVR) to develop a 25OHD prediction score. The RBF-SVR model provided 74% accuracy. 26 Gonoodi et al. (2019) recruited the data from 988 adolescent girls (12–18 years old) for the assessment of the risk factors for vitamin D deficiency and used a decision tree (DT) model. The model performed sensitivity, specificity, and accuracy of 79.3%, 64%, and 77.8% respectively. 27 Sambasivam et al. (2020) used k-nearest neighbor, DT, RF, adaboost, bagging classifier, extra trees, stochastic gradient descent, gradient boosting, SVM, and multi-layer perceptron for analysis of vitamin D deficiency severity on the data from a total of 3044 college students (18–21 years old). RF performed the best and achieved sensitivity (96%), negative predictive value (96%), and classification accuracy (96%). 28 Carretero et al. (2021) used the data from 1002 hypertensive patients to predict vitamin D deficiency. They applied LR, SVM, RF, naive bayes, and extreme gradient boost. The SVM-based model using radial kernel outperformed other algorithms in terms of sensitivity (98%) negative predictive value (71%) and classification accuracy (73%). 29 Amiri et al. (2021) used LR and RF on the data from the survey of ultraviolet intake by nutritional approach study. They achieved an accuracy rate of 93% using RF to determine the factors affecting the response of vitamin D supplementation. 30 Padmajaa et al. (2021) used machine learning algorithms including RF, multi-layer perceptron, k-nearest neighbor, SVM, decision tree, gradient boosting, stochastic gradient descent, adaboost classifier, extra trees classifier algorithm, and LR. In their study in which the prognosis of vitamin D deficiency severity was estimated and extra trees classifier algorithm achieved an accuracy rate of 73.3%. 31 As such, no studies with diabetic patients have been performed to date.
Materials and methods
Data collection
Features of the dataset.
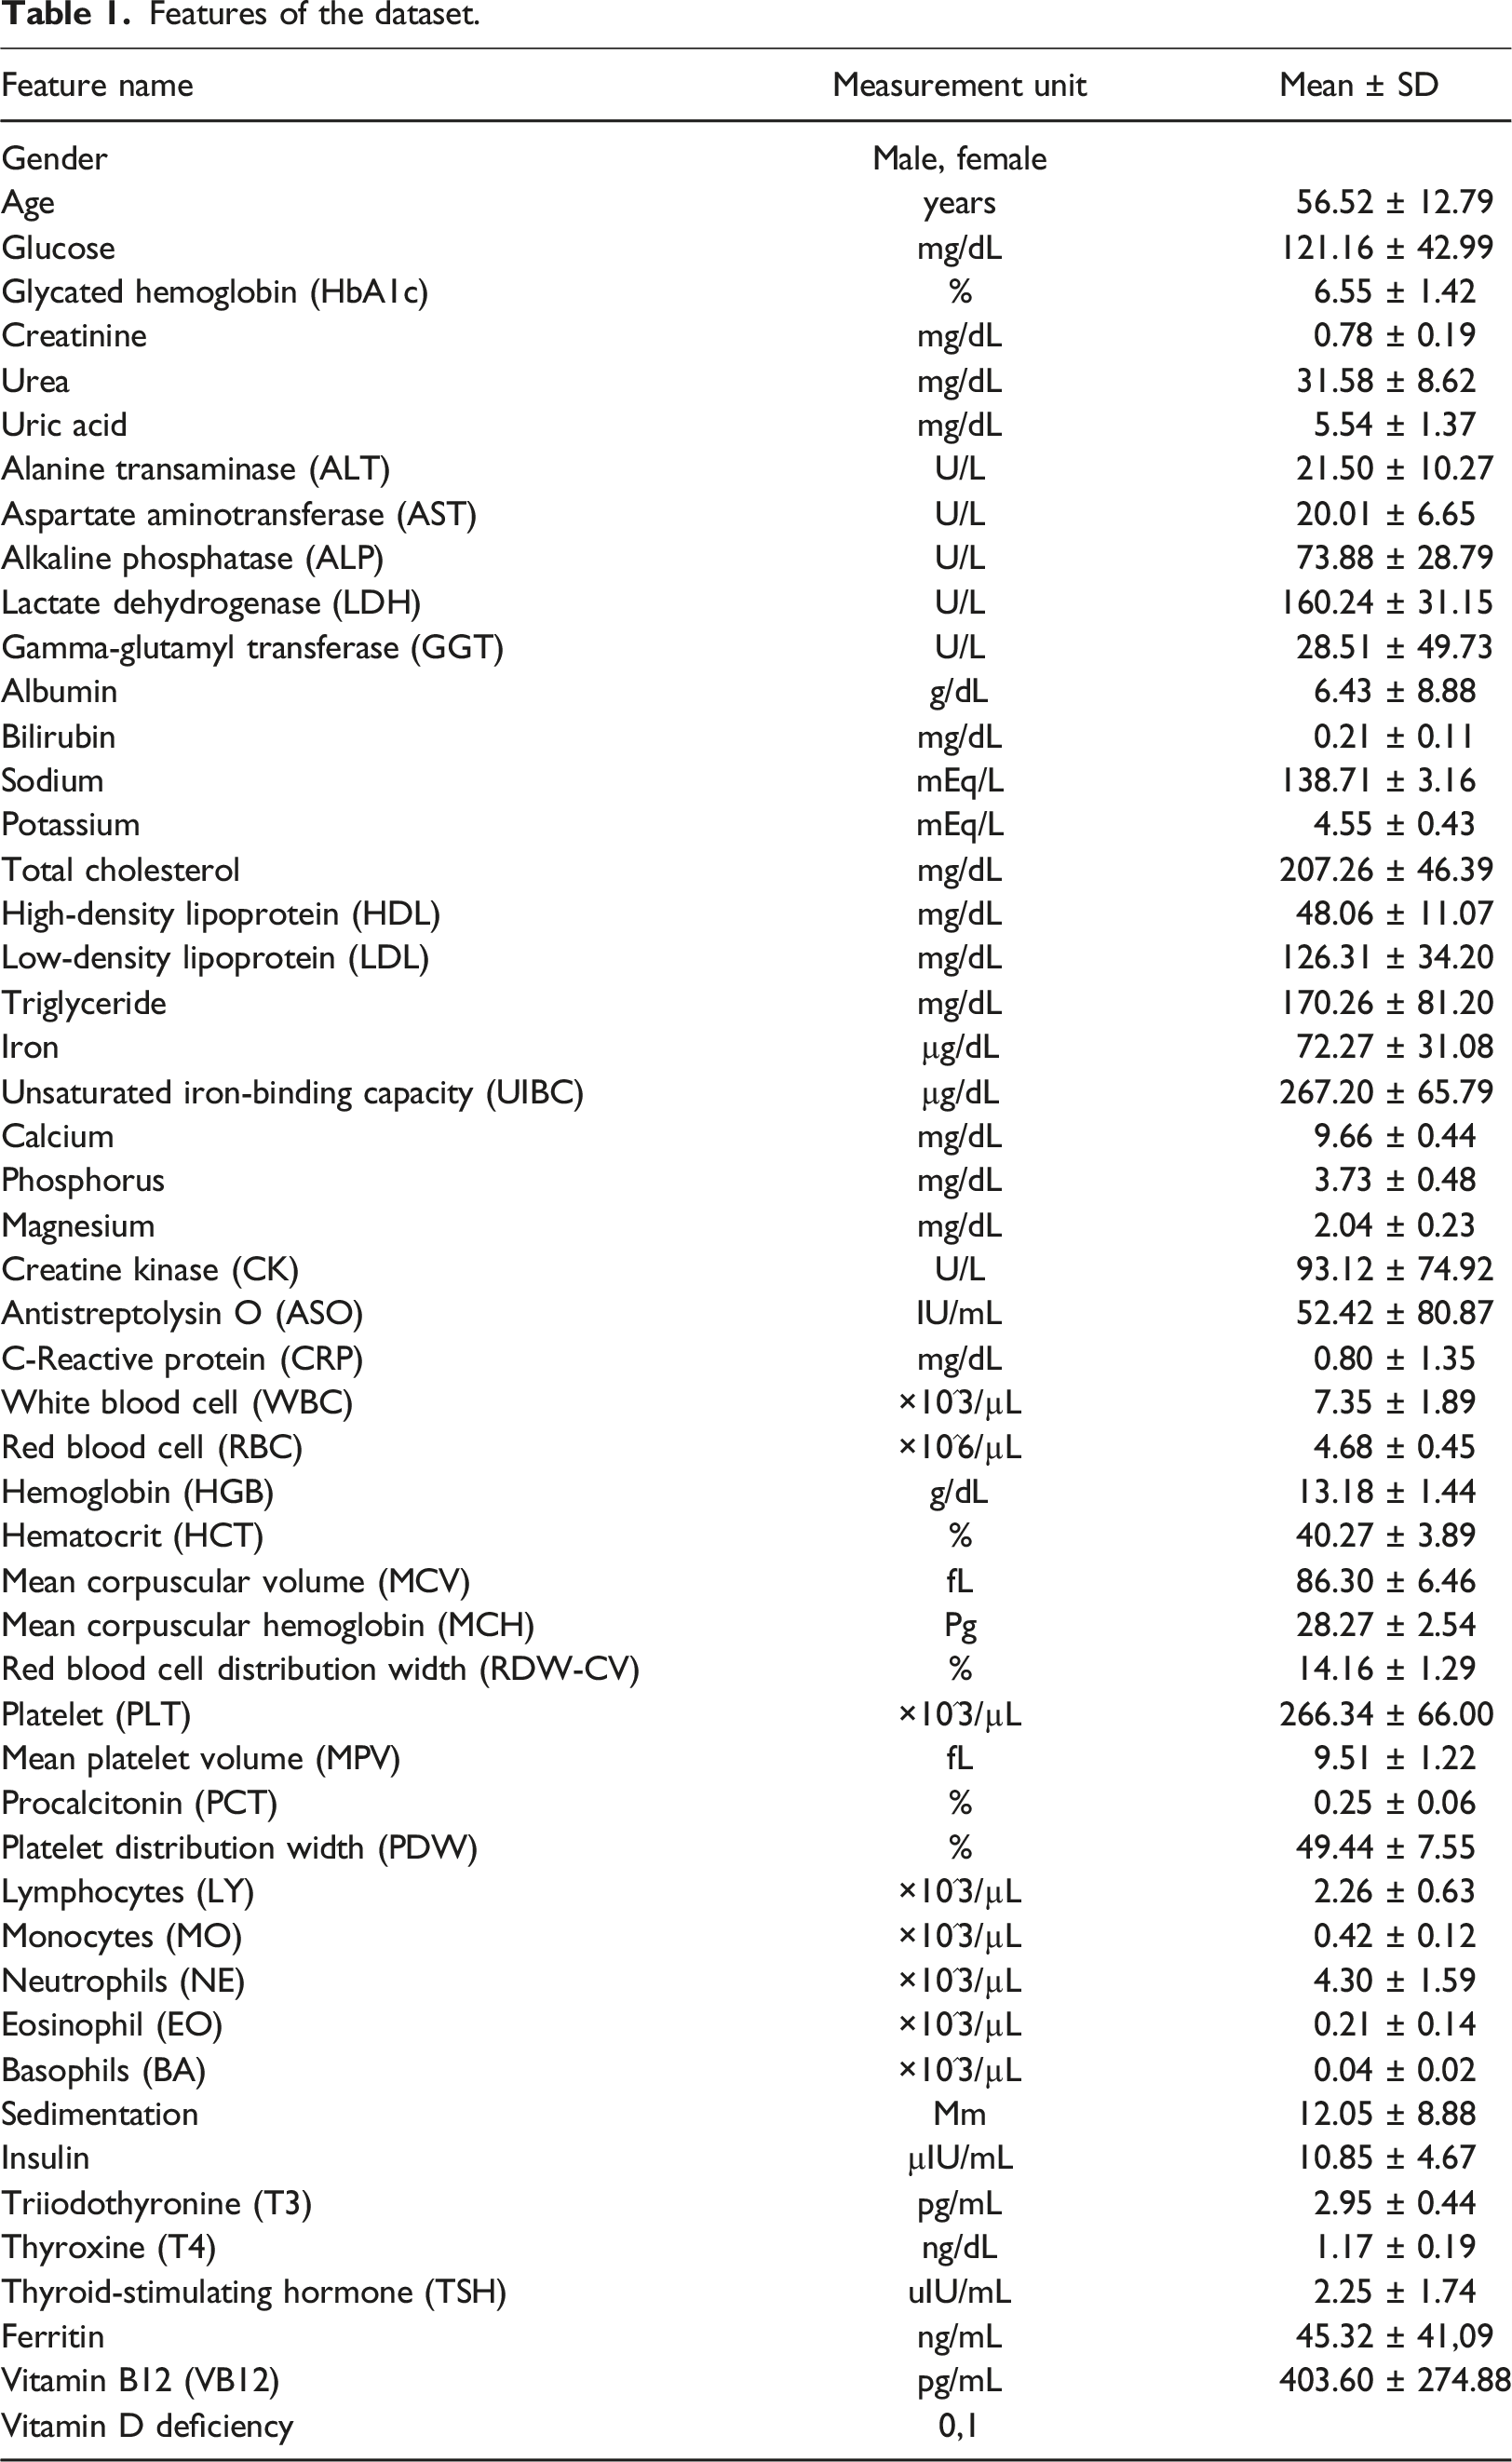
The dataset consists of 115 male and 291 female patients. The class label was vitamin D deficiency (1, “sufficient” label, or 0, “deficient” label). The ratio of deficient class to sufficient class was 2.7:1 (298, “sufficient”; 108, “deficient”). Since the deficient class is the majority class and also studies in class imbalance concentrated on imbalance ratios ranging from 1:4 up to 1:100, a class imbalance is of negligible importance in this study. 32 Also the data which is used to form the dataset was collected manually and the redundant data was removed before the formation of the dataset.
Figure 1 shows the overall flow of our model using relief-F, SVM, RF, and LR to search for the best model to predict vitamin D deficiency in diabetic patients. Firstly, pre-processing was applied to the raw data and the features necessary for our study were recorded. Diabetic patients and vitamin D deficiency were identified manually. After pre-processing, the dataset was formed, and 406 observations of blood test results were listed which can be used for later analyses. Then, relief-F scores of every feature in the training set were computed and sorted descendingly. Later, a subset of the training was generated including the features with the best relief-F scores and it was validated by using the testing set. During these two steps 10-fold cross-validation, the most commonly used evaluation technique, was carried out to find the optimized values and avoid overfitting. The dataset was initially partitioned into 10 folds, where nine folds were used to train, and the remaining fold was used to test the prediction model. Then the folds were rotated, and all folds were used to train and test the dataset. The final performance metrics were averaged using the 10 estimates from each test fold assuring that 10 independent sets were used to test the dataset.
33
The overall flow of our model.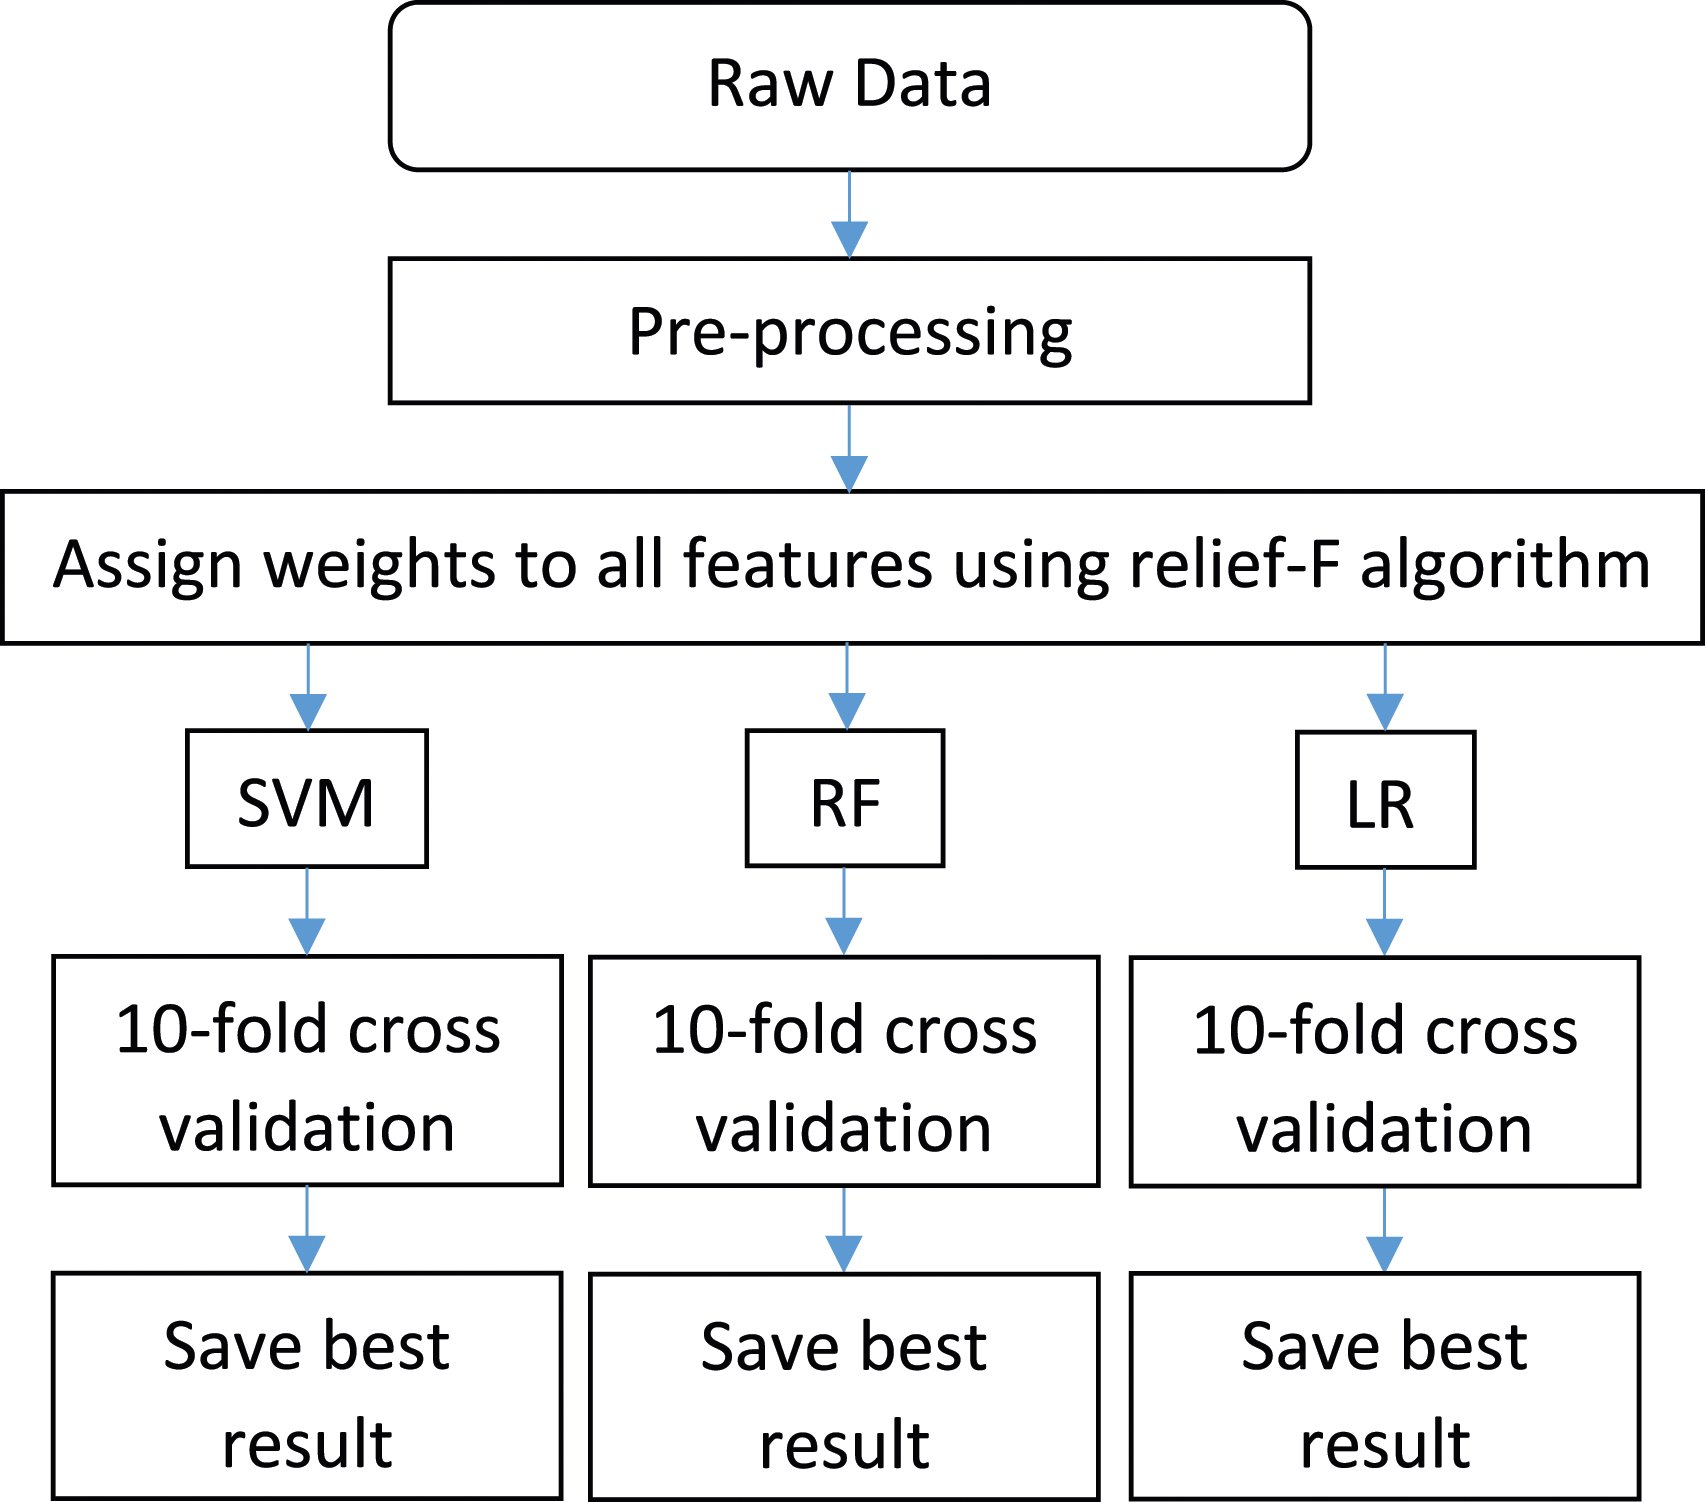
Machine learning methods
In the clinical diagnosis area, a small feature subset means lowering test expenses. The advantage of limiting the number of input features is having a decent, predictive, and less intensive model. In this study, the relief-F algorithm was used for feature selection.
The purpose of machine learning is to recognize complex patterns in a given dataset automatically and allow for prediction in a new dataset. Many developers recognize that it can be easier to train a system by showing examples of desired responses than programming manually by anticipating desired responses for all possible inputs. The most widely used methods in machine learning are supervised learning methods. Each case in a supervised learning method is characterized by a label which is used to generate a function that maps the dataset by minimizing the classification error. Supervised learning methods used in this study are SVM, RF, and LR.36,37
Relief-F algorithm
Relief-F is the best-known variant of relief-based algorithms which is proposed by Kononenko. For each target instance, relief-F relies on a user parameter k specifying the use of k nearest hits and k nearest misses in the scoring update. In multi-class problems, relief-F finds k nearest misses from each class, and based on the prior probability of each class, relief-F averages the weight update. Encouraging the algorithm to estimate the ability of features to separate all pairs of classes regardless of which two classes are closest to one another. Since it is expected that as the parameter approaches the total number of instances, the quality of the weight estimates will become more reliable. Kononenko proposed the simplifying assumption that every instance in the dataset gets to be the target instance one time. 38
Support vector machines
SVM are very powerful supervised learning algorithm proposed as a statistical learning method for prediction by Vapnik in 1995. SVM use support vectors to identify the decision boundaries between various classes based on a linear machine in a high-dimensional feature space. SVM have enabled the improvement of fast training techniques with a large number of input variables. SVM algorithm creates a model that recognizes patterns in the training data, each belonging to one of two different classes, and then estimates new instances of the data. Simply put, SVM are discriminatory classifiers, and SVM algorithm classifies new samples by the most appropriate separation decision boundary considered as the hyperplane of SVM.
If the training dataset is linearly separable, linear SVM can be used by choosing two boundaries that separate the samples. Consider the problem of separating the set of training vectors that belongs to two linearly separable classes, 


In canonical form, a separating hyperplane must satisfy the following constraints
The hyperplane optimally separates the data is the one that minimizes
The optimal function is given by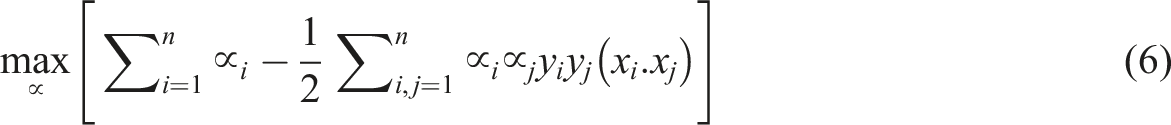
SVM provide separability to non-linear regions by using kernel functions avoiding the local minimum issues by implementing quadratic optimization. If the training dataset is not linearly separable, SVM maps the input vector into a high-dimensional feature space. SVM build an optimal separating hyperplane in this higher dimensional space by defining a non-linear mapping usually defined as
The optimal function becomes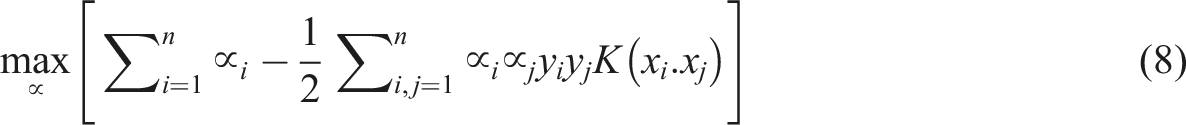

Random forest
RF is the collection of DTs. Rather than seeking the most important feature, RF seeks the best feature among a random subset of features. RF uses multiple DTs and each DT in RF is formed by randomly chosen training data. The prediction of every DT may be low, but as the predictions are combined, the accuracy of RF increases. Since RF has randomness, overfitting is not a problem. By reducing generalization errors, RF is not affected by noise and outliers and has high accuracy.
RF can be built using bagging in tandem with random attribute selection. Consider a training set, D, of d tuples, is given. For each iteration, a training set Di is sampled using replacement from D. Let F be the number of attributes to be used to determine the split at each node. The trees are grown to maximum size and are not pruned.43,46–49
Logistic regression
LR is a form of regression that examines the relationship between a dependent binary outcome (such as present or absent) and independent variables of any type (such as historical electronic health records). Prediction studies using LR are widely used in healthcare and analysis has been used frequently in biology, medicine, economics, agriculture, veterinary and transportation fields. The outcome variables can be both continuous and categorical. The following equation describes the relationship between the predictor variables and disease presence:
Performance metrics
Confusion matrix representation.
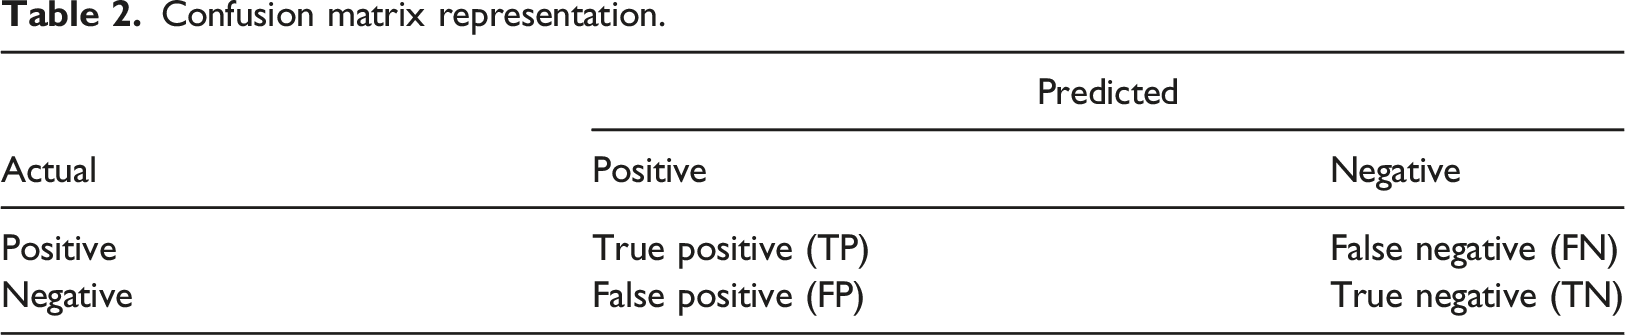
Performance metrics can be calculated by using the following equations:


Results and discussion
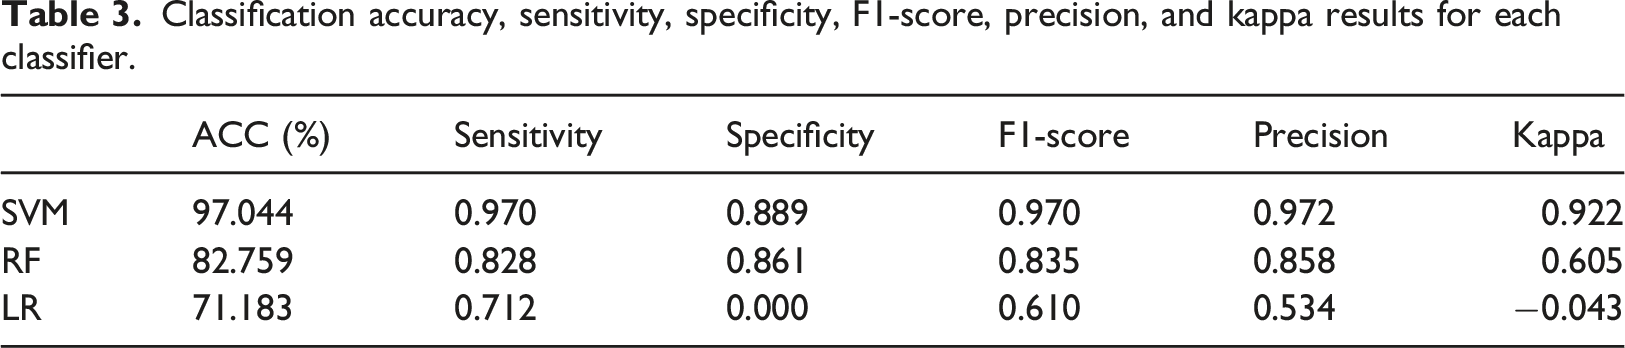
Classification accuracy, sensitivity, specificity, F1-score, precision, and kappa results for each classifier.
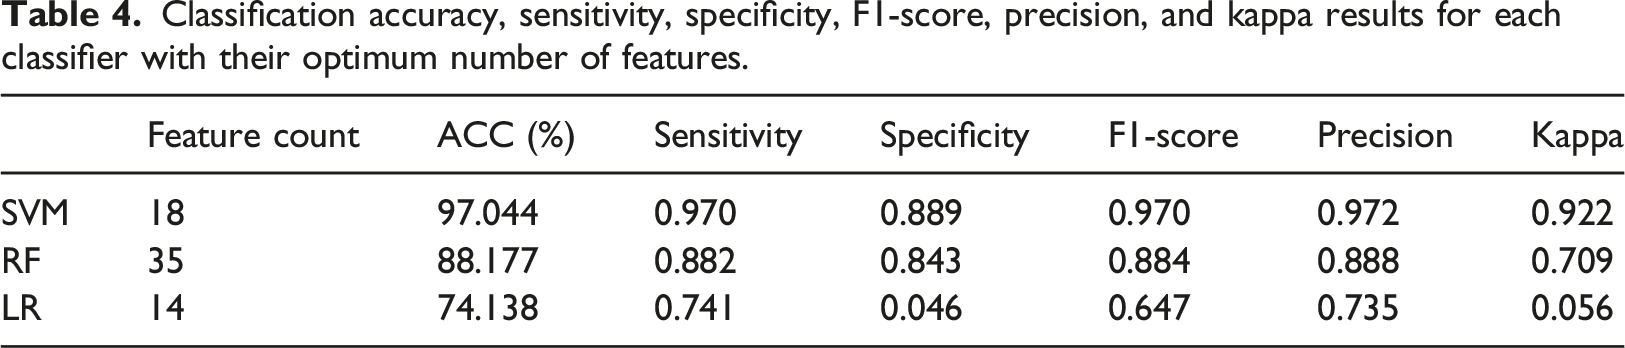
Classification accuracy, sensitivity, specificity, F1-score, precision, and kappa results for each classifier with their optimum number of features.
The dataset we worked on is a two-class problem and it is free of noise and balanced as mentioned before in Section 3.1. It is proven that SVM perform very well with medical datasets. The radial kernel algorithm provides better accuracy than other SVM kernels while studying on a non-linearly separable data. 29 Since our dataset has similar characteristics, the maximum margin hyperplane was determined by the SVM model using radial kernel.
The most important parameter while using an RF is the number of DTs. More stable models require a large number of trees but exhaust computational resources. 55 Empirically in this study, using 100 trees to compute RF results was deemed appropriate.
LR is mostly used for multivariate analysis in medical literature but in this study, LR performed worse because of probable nonlinear relation between variables. 56
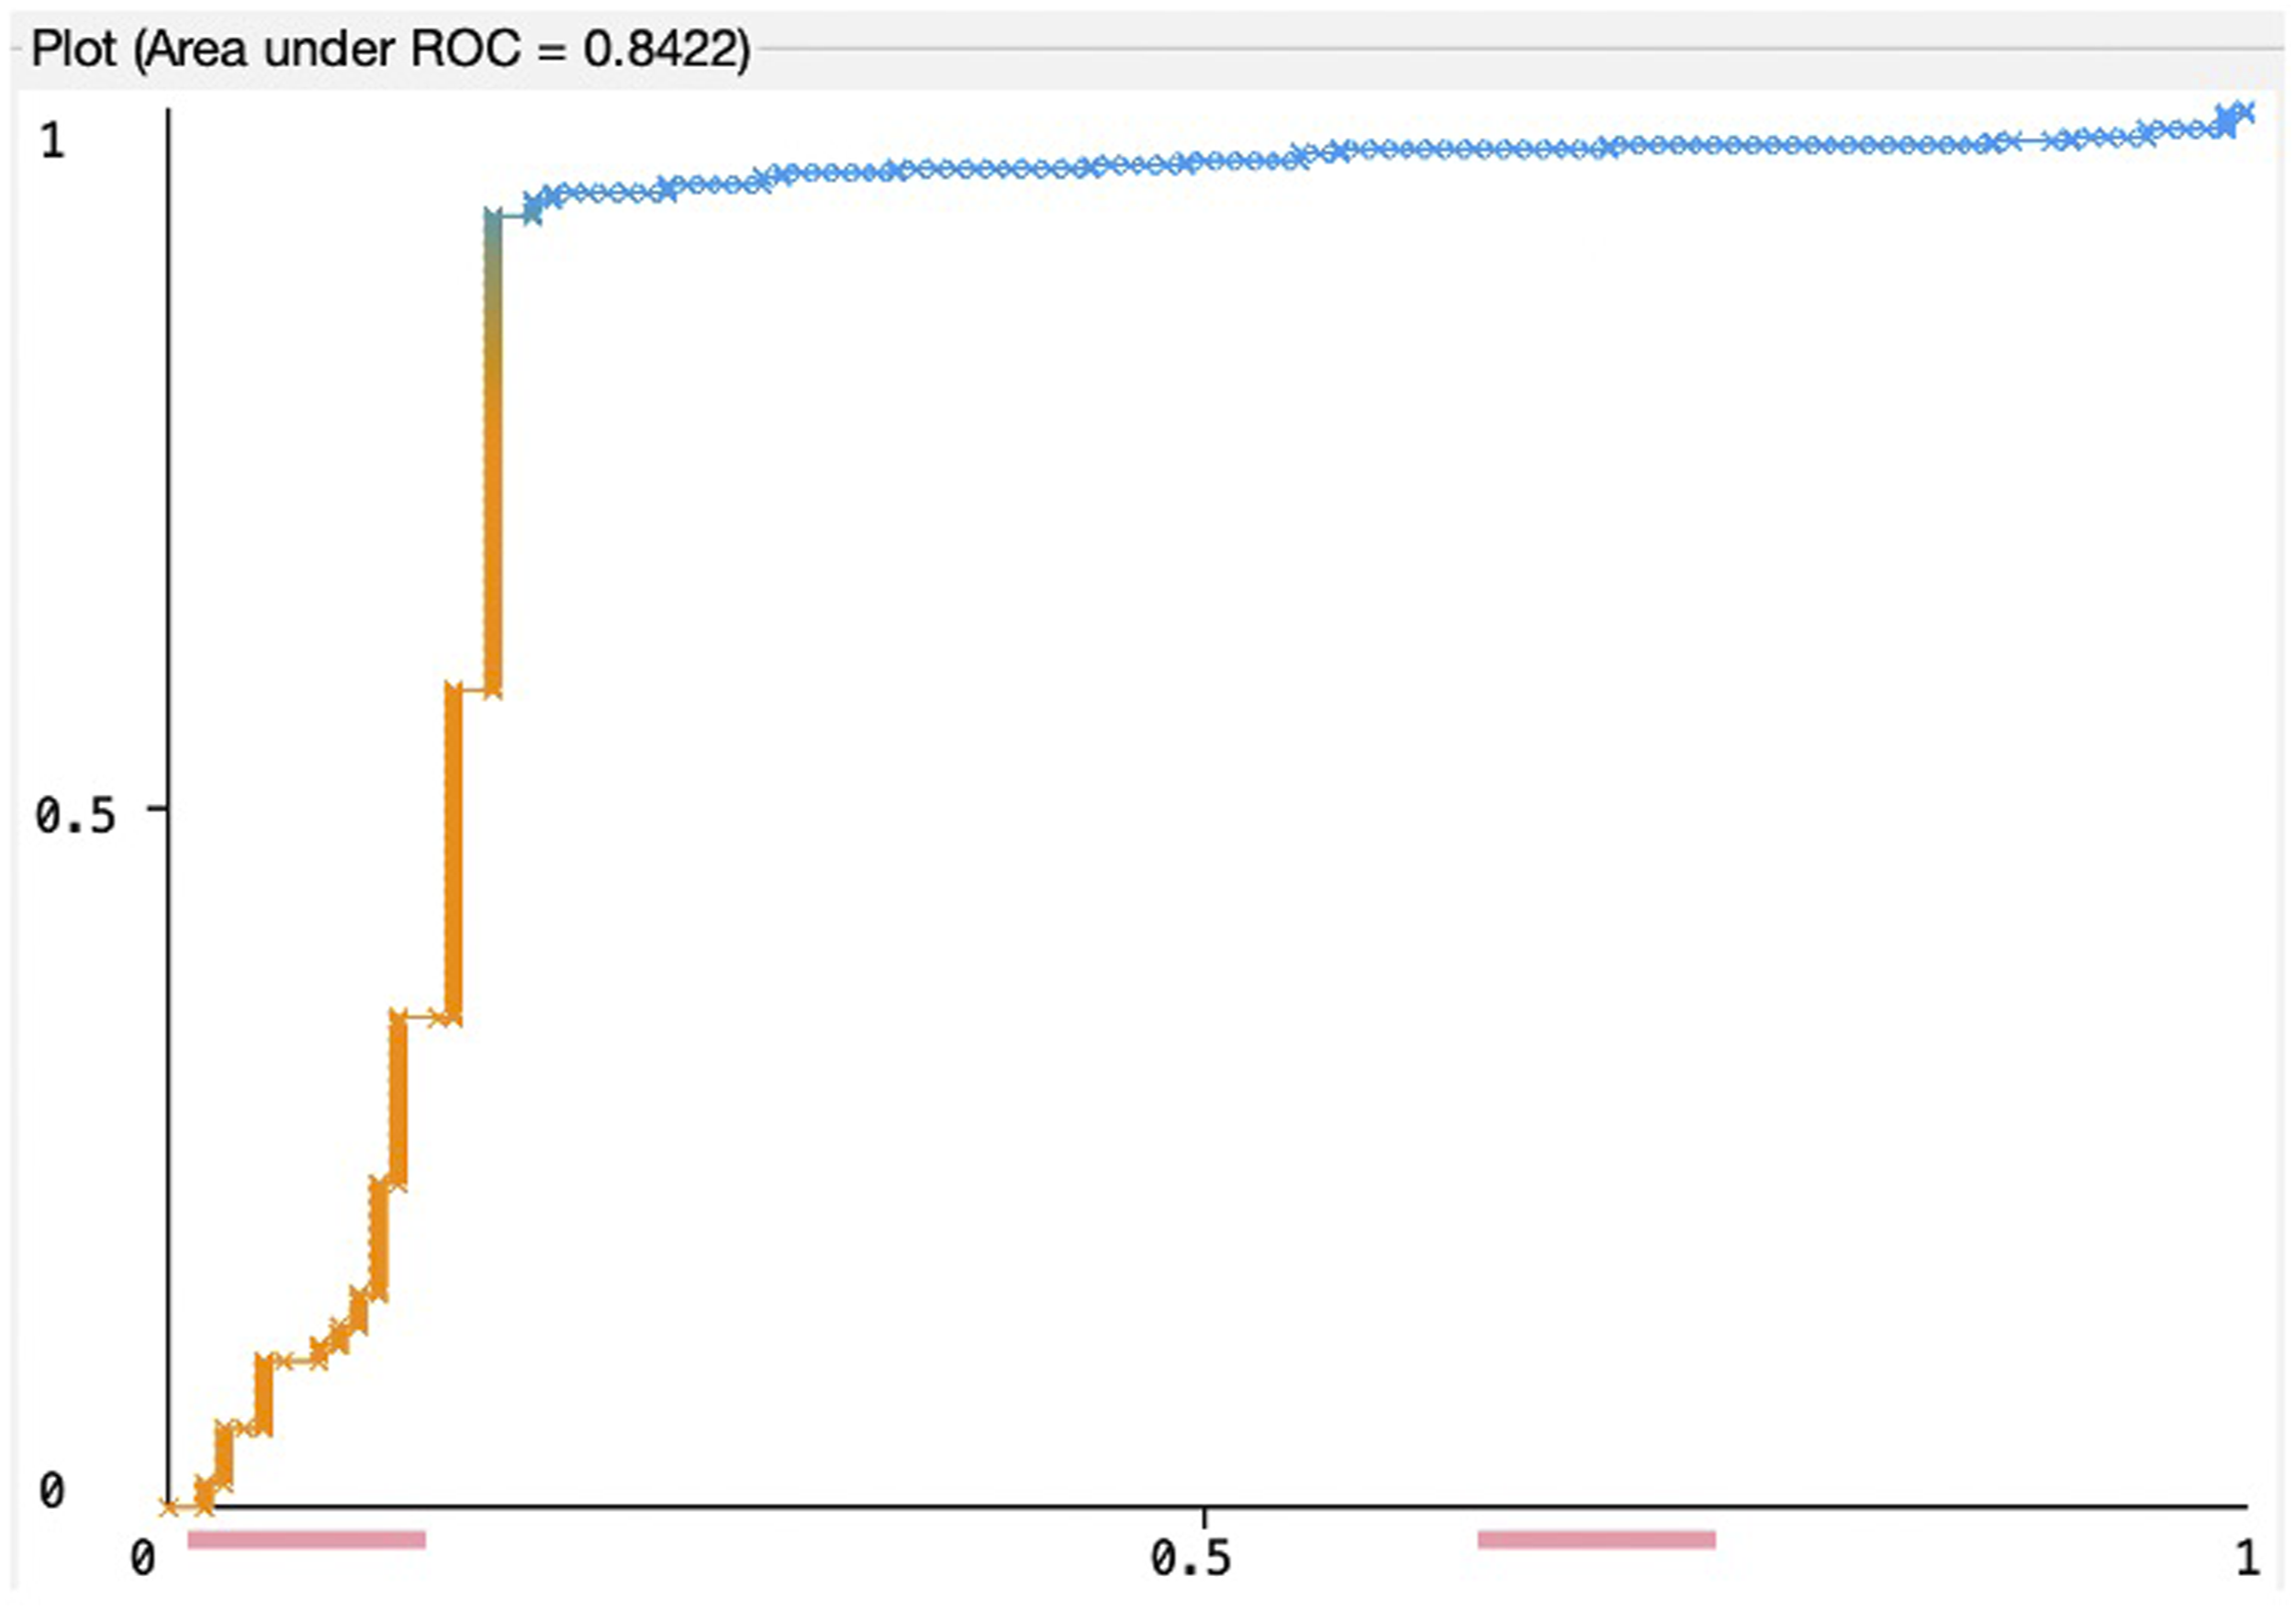
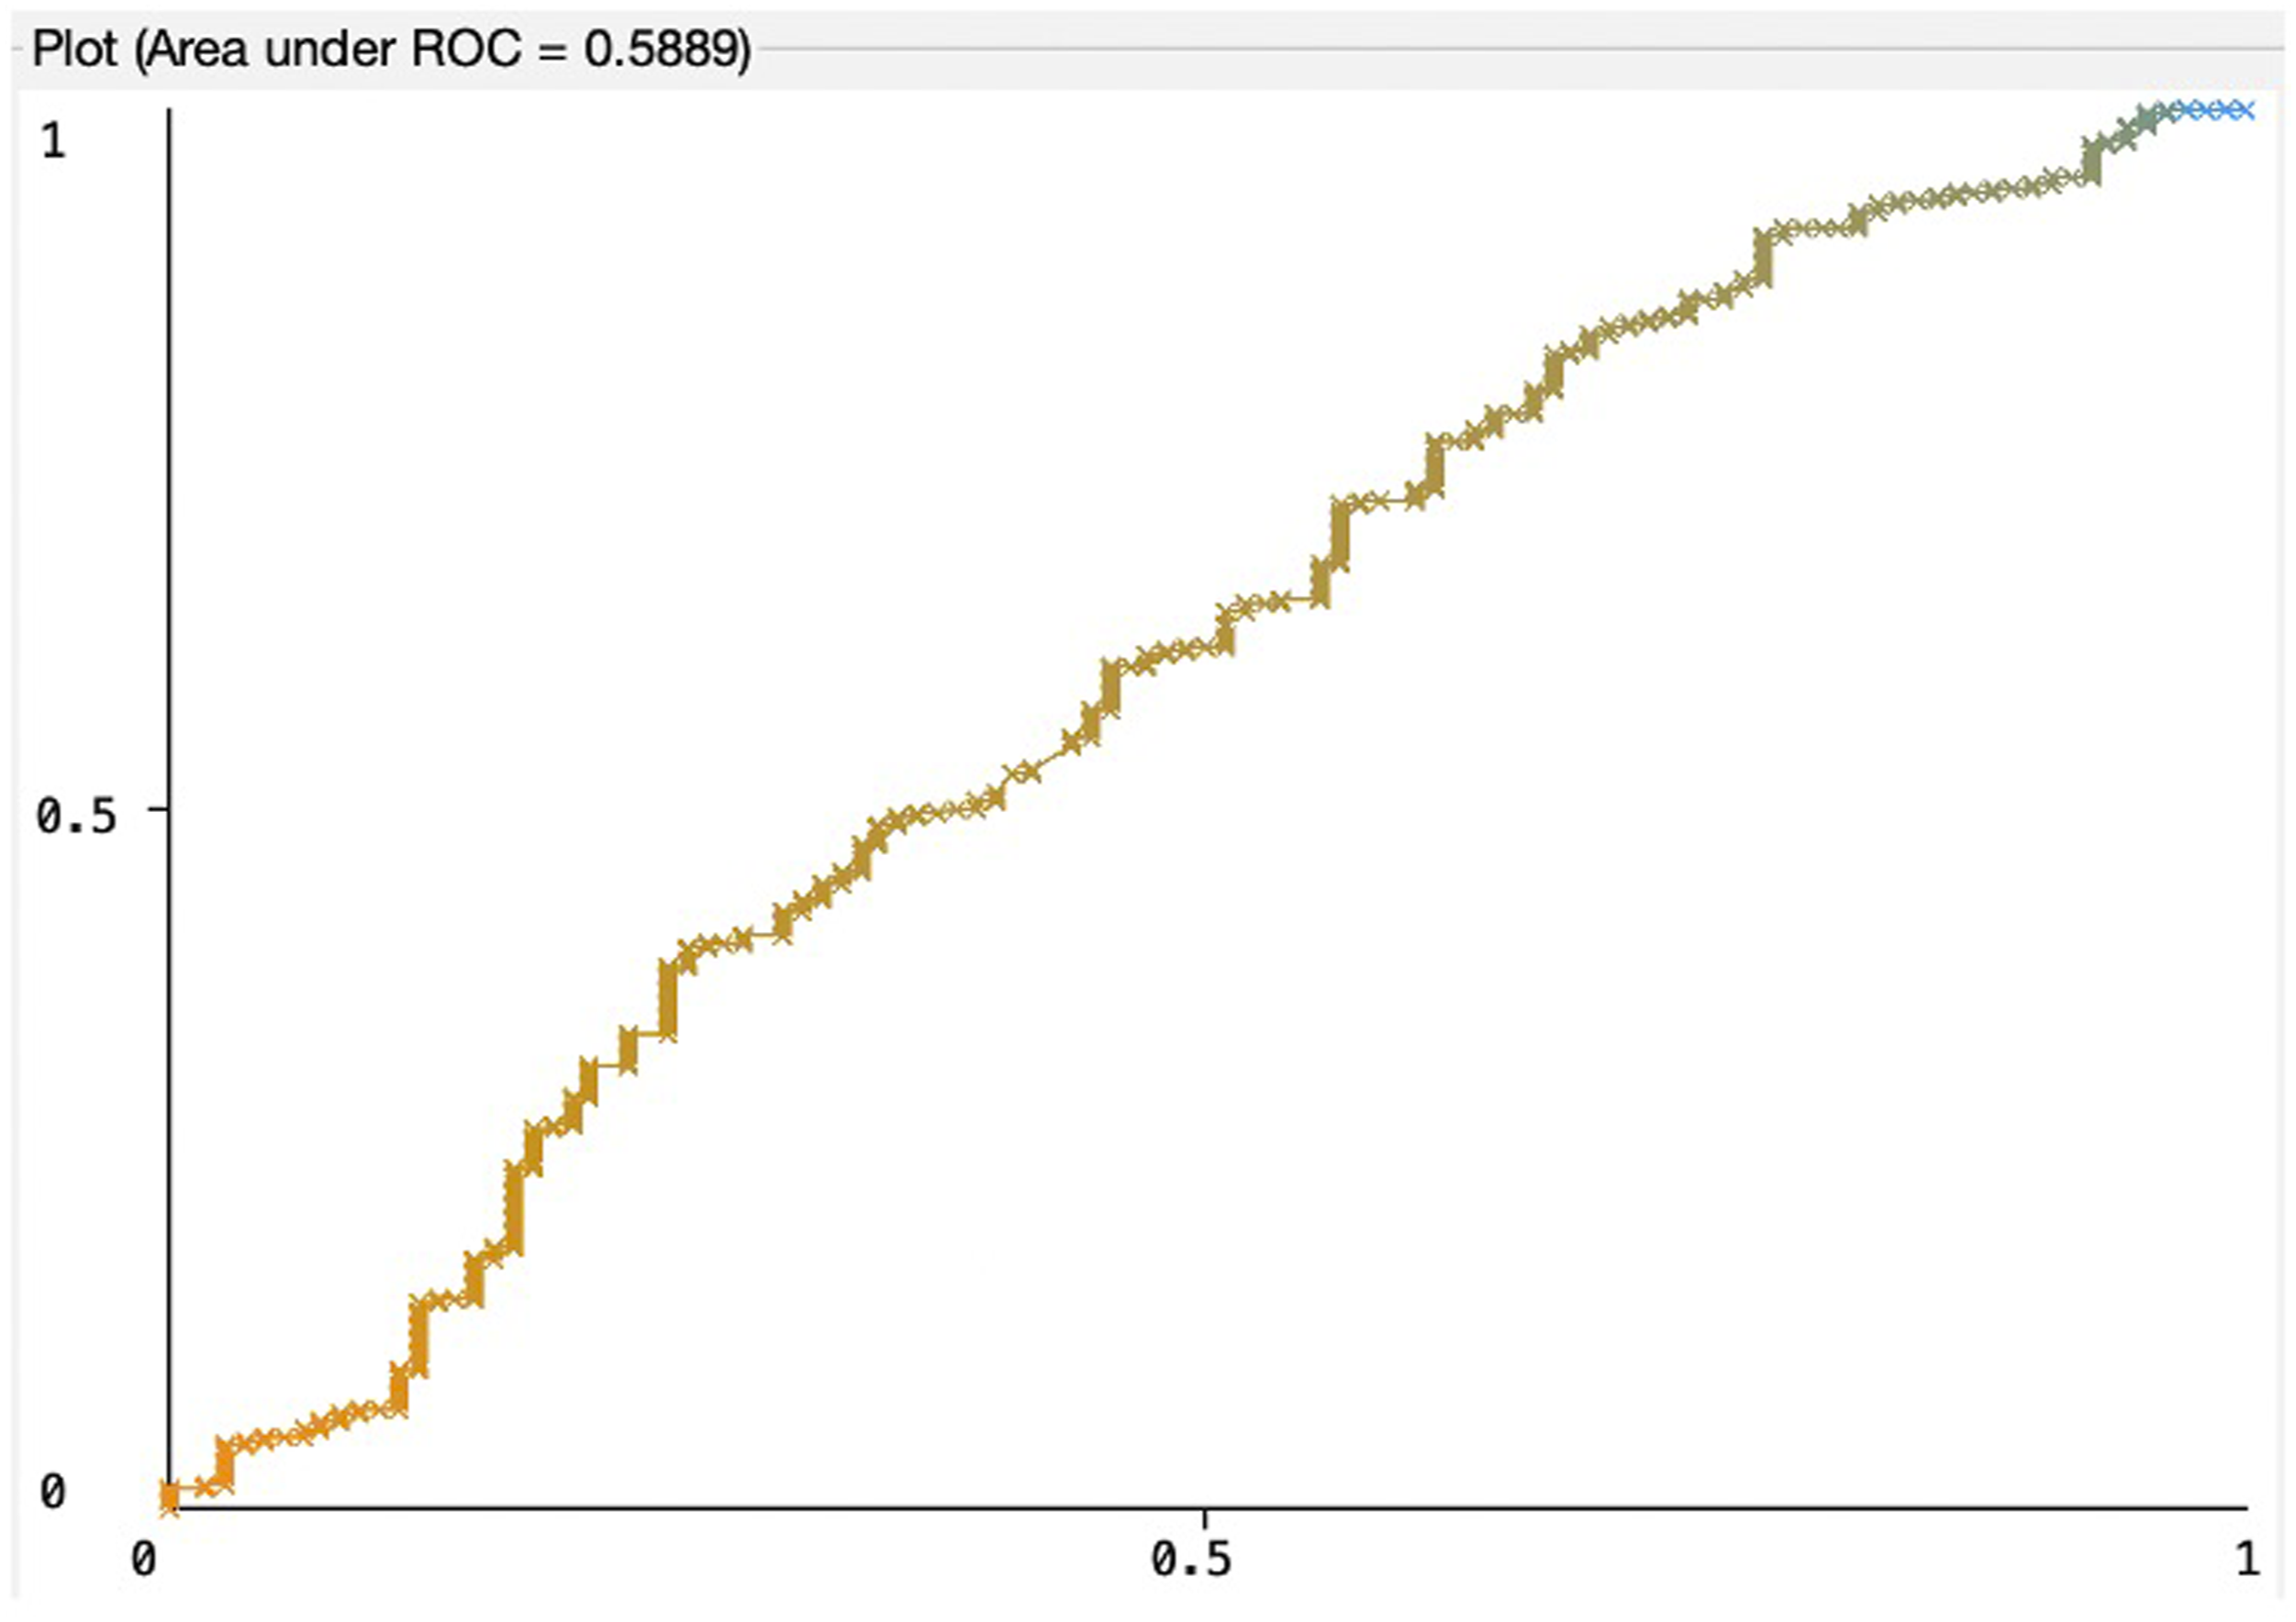
The ROC curves that show the tradeoff between sensitivity and specificity; and the area under the ROC curves (AUC) for the SVM, RF, and LR models are presented in Figures 2–4. While observing a ROC curve the bigger area means better classifier performance. SVM model. RF model. LR model.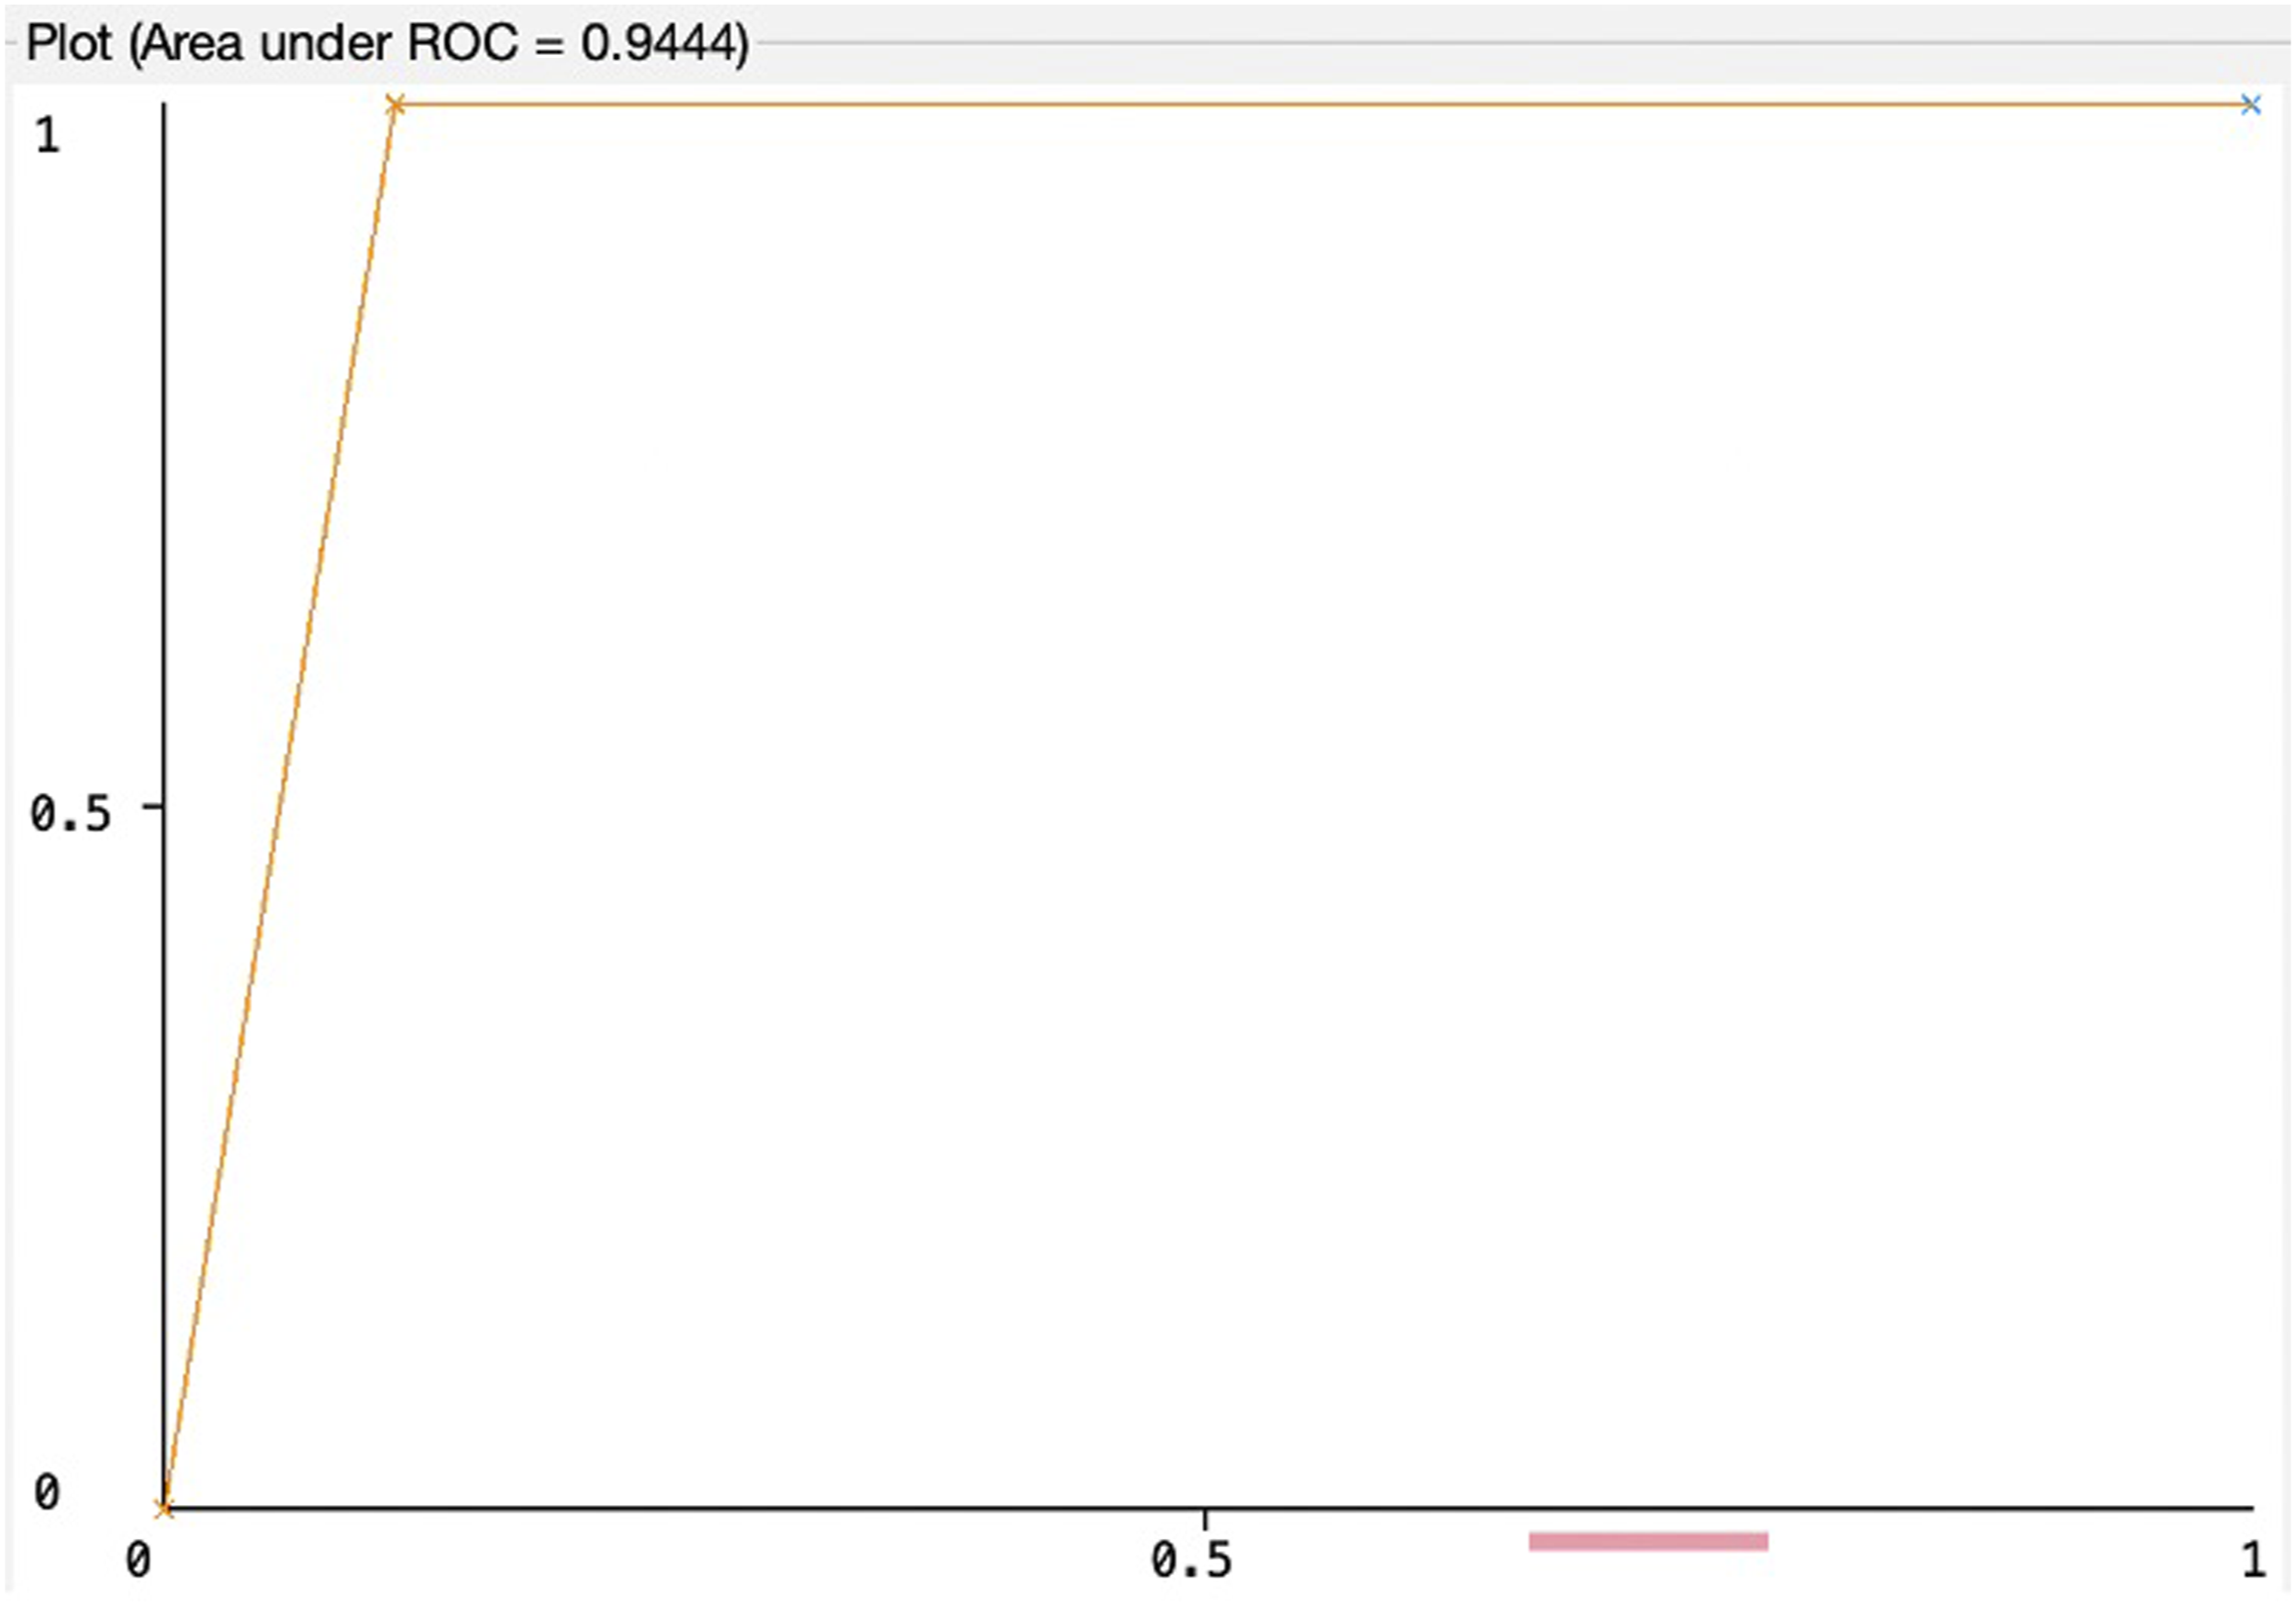
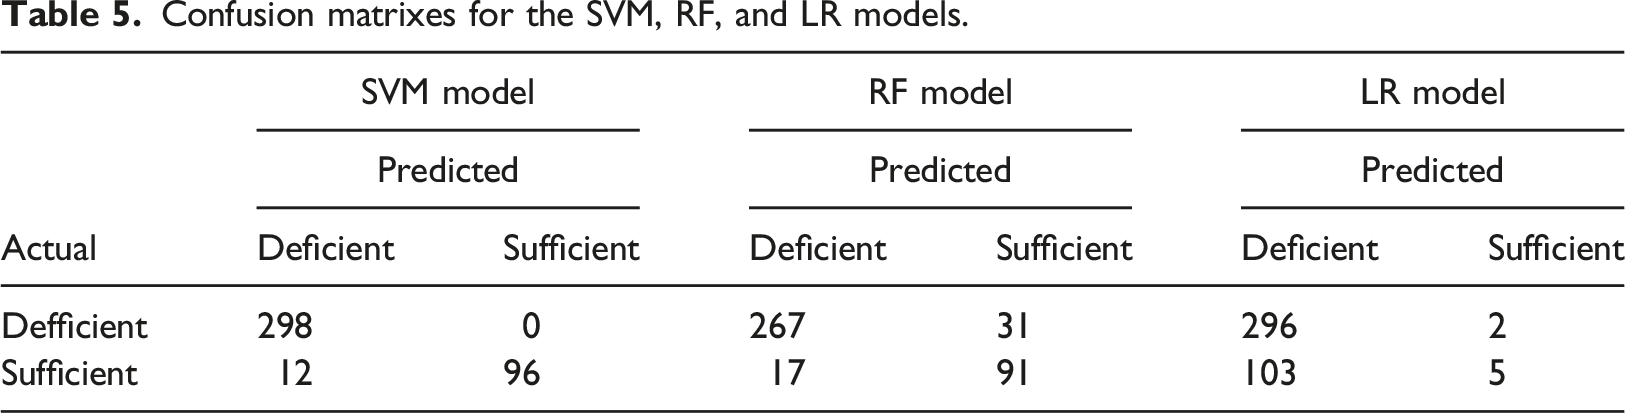
Confusion matrixes for the SVM, RF, and LR models.
Ranking of relative importance with relief-F for the best input variables.
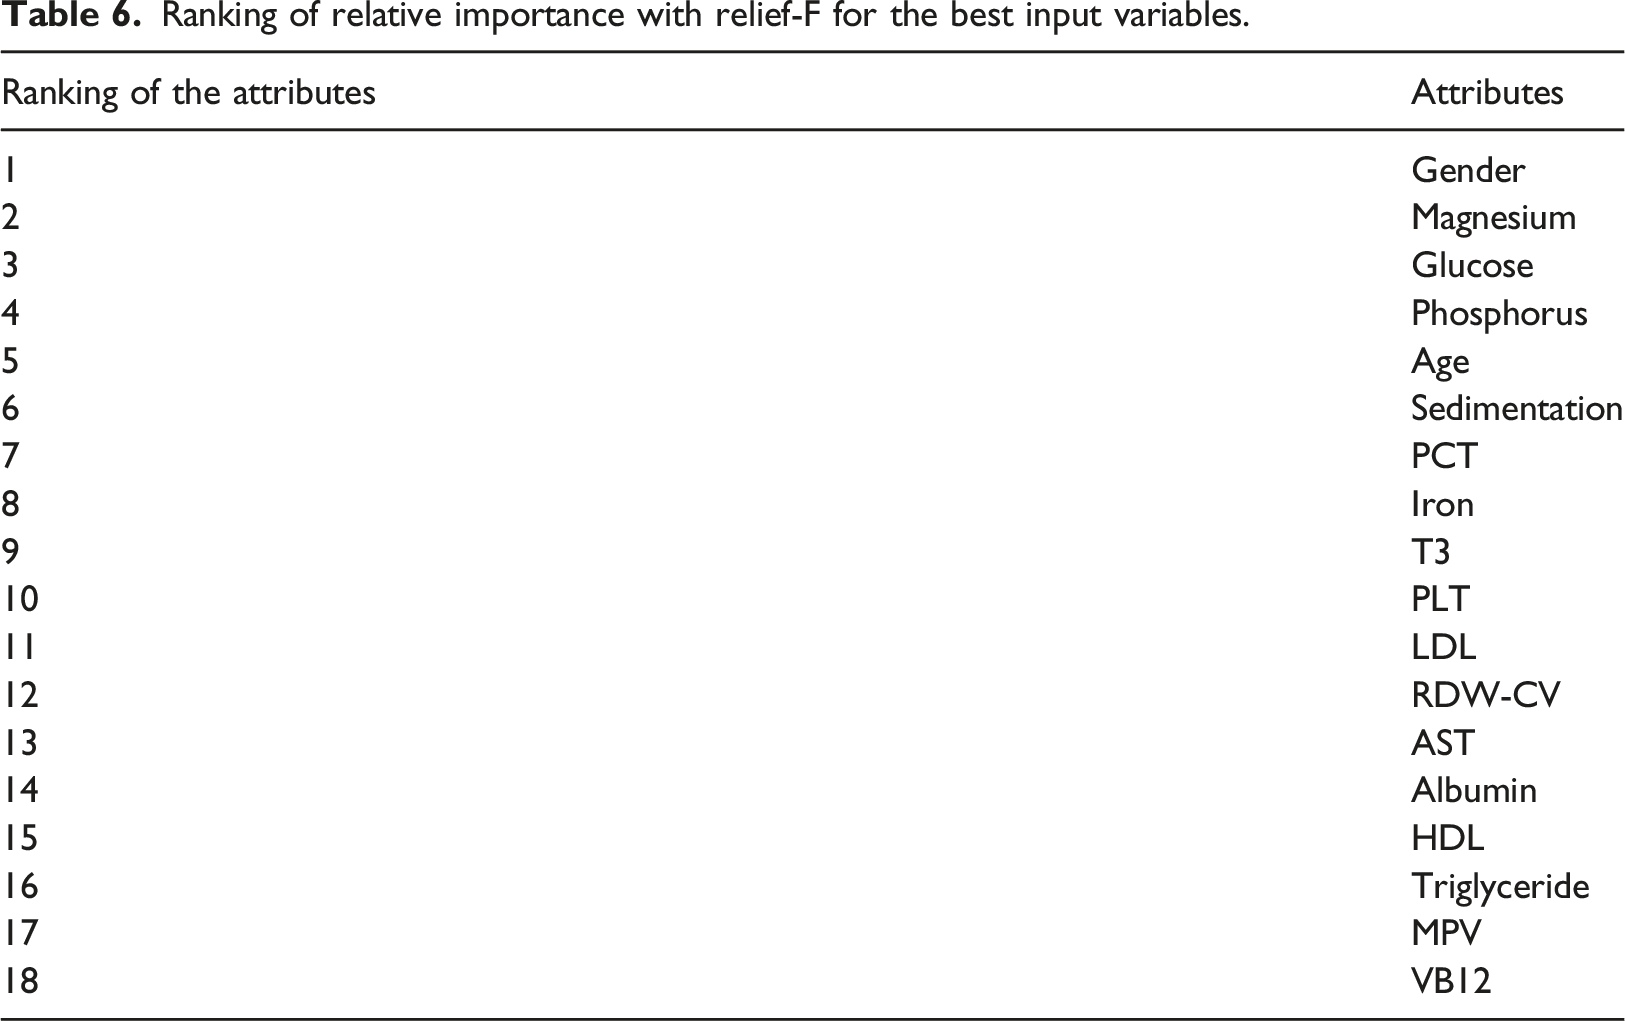
Considering these attribute rankings, we conducted our new literature review. According to this review gender significantly affects vitamin D status; recommended amount of magnesium consumption is essential to obtain the optimal benefits of vitamin D; abnormality of glucose metabolism is linked to vitamin D deficiency; the utilization of vitamin D in the body raises calcium and phosphorus levels; abnormally low levels of plasma 25OHD are more common in the elderly; erythrocyte sedimentation rate is higher in patients with vitamin D deficiency; vitamin D supplementation may interfere with the ability to use PCT; a positive relationship exists between iron status and vitamin D; rats receiving vitamin D restricted diet were made thyrotoxic by subcutaneous injection of T3; vitamin D deficiency may increase PLT and MPV; vitamin D supplementation significantly decreases LDL, elevated RDW-CV levels may be attributed to the adverse effects of risk factors such as vitamin D; vitamin D treated rats had significantly lower serum levels of AST; albumin belongs to a family of proteins that includes vitamin D binding protein (VDP); low vitamin D has been associated with low levels of HDL; low serum vitamin D levels in children is associated with high levels of triglyceride; significant negative correlation exists between vitamin D and B12. In this way, we confirmed our attribute selection with the literature.58–74
Conclusions
In this study, a medical decision-making system made use of SVM, RF, and LR classifiers combined with feature selection using relief-F has been applied to diagnose vitamin D deficiency in diabetic patients. The analyses were conducted on a novel vitamin D dataset of diabetic patients. According to these analyses, the proposed model yielded the highest classification accuracy of 97.044 for a subset containing 18 features: gender, magnesium, glucose, phosphorus, age, sedimentation, PCT, iron, T3, PLT, LDL, RDW-CV, AST, albumin, HDL, triglyceride, MPV, VB12. The proposed model reduced the time required to classify the test dataset by reducing the feature space without any accuracy loss in classification. Further performance measures such as sensitivity, specificity, F1-score, precision, kappa results, and ROC curves are also represented for the proposed model. In consideration of these results, our SVM model using radial kernel combined with feature selection gave very auspicious results in predicting vitamin D deficiency in diabetic patients. Extracting knowledge from medical databases offers assistance unavailable before the mining process. Data mining for medical purposes will find its place in the years to come. Keeping the systems compliant with technical standards will probably provide the pivotal point for the deeper use of the different datasets in the decision-making process.75,76 We consider that our model can be very helpful as an information platform for assisting physicians to make better clinical decisions at an earlier stage through adapting existing healthcare systems. Furthermore, the dataset we created will be useful for researchers who will work in this field.
Footnotes
Declaration of conflicting interests
The author(s) declared no potential conflicts of interest with respect to the research, authorship, and/or publication of this article.
Funding
The author(s) received no financial support for the research, authorship, and/or publication of this article.