
Abstract
Introduction
Childhood anaemia remains a major public health problem in Ghana, with marked regional and socioeconomic disparities. Conventional regression may not fully capture complex, non-linear relationships among biological, maternal, and household factors. We used supervised machine learning to predict anaemia among children aged 6–59 months using nationally representative survey data.
Methods
We analysed the 2022 Ghana Demographic and Health Survey, including de facto children aged 6–59 months with valid haemoglobin and complete covariates (weighted N = 3,382). Anaemia was defined as altitude-adjusted haemoglobin <11.0 g/dL. Twenty-one predictors were included. Data were split into training (80%) and testing (20%) sets using stratified sampling. Six models (logistic regression, decision tree, random forest, gradient boosting, support vector machine, and artificial neural network) were tuned via grid search with 10-fold cross-validation.
Results
The weighted prevalence of childhood anaemia was 48.95% (n = 1,655). Gradient boosting showed the best overall discrimination (AUC = 0.72; F1 = 68.99%; accuracy = 66.27%). Support vector machine and logistic regression achieved the highest sensitivity (recall = 72.73% and 71.74%). Random forest showed overfitting (100% training accuracy; test accuracy = 65.23%). Decision tree and neural network performed poorly (AUC = 0.57 and 0.63). Key predictors across models and SHAP were child age, malaria status, maternal anaemia, region, and household wealth (with feature rankings varying by algorithm).
Conclusion
Machine learning models achieved moderate predictive performance for childhood anaemia in Ghana. Gradient boosting provided the strongest discrimination, while support vector machine and logistic regression offered higher sensitivity for screening. However, these sensitivities imply that approximately 28–30% of anaemic children may be missed, which should be considered when applying these models in public health screening. Identified determinants support targeted, malaria-integrated nutrition and maternal–child interventions in high-risk groups.
Keywords
1. Introduction
Childhood anaemia remains a major global public health challenge, affecting an estimated 269 million children under five years of age, with the highest burden in low- and middle-income countries. 1 Anaemia in early childhood undermines cognitive, physical, and immune development, thereby limiting long-term human capital development.2,3 Its persistence also threatens global commitments such as Sustainable Development Goal (SDG) 2 on ending malnutrition and SDG 3 on achieving health for all. 4 Sub-Saharan Africa continues to record the highest prevalence globally, reaching up to 64.1%, with West African countries among the most heavily affected. 5 Despite years of nutritional and infectious disease control interventions, the pace of reduction has been slow. These trends highlight a widening gap in surveillance and risk identification, underscoring the need for analytical approaches that capture the complex drivers of childhood anaemia. Machine learning (ML), which excels in handling multidimensional data and non-linear relationships, offers such potential.
In Ghana, anaemia remains a persistent public health concern among children under five. Recent findings from the 2022 Ghana Demographic and Health Survey (GDHS) indicate that 49.0% of children are anaemic, a figure that reflects stagnating progress. 6 Compounding this is the co-occurrence of malaria and anaemia, affecting approximately 6.4% of children, which significantly heightens the risk of severe illness and mortality.6,7 National prevalence estimates also mask stark regional disparities. Northern and transitional ecological zones, areas with prolonged malaria transmission and chronic food insecurity, report far higher burdens than southern zones, including Greater Accra. 6 Such heterogeneity suggests that broad national interventions overlook localized vulnerabilities. The continued high prevalence despite ongoing programmes signals a need for more precise identification of high-risk groups and tailored intervention strategies.
The risk of childhood anaemia is shaped by multiple, interrelated determinants operating at distal, intermediate, and proximal levels. Distal factors such as household wealth, maternal education, and place of residence influence access to essential resources and health services. 8 Intermediate factors include conditions within the household environment, such as water, sanitation, and hygiene (WASH) infrastructure, and maternal exposure to health information through mass media, both of which affect health behaviours. 9 Proximal biological factors, including the child’s age, recent fever episodes, nutritional status (stunting and wasting), and birth order, directly influence physiological vulnerability. 10 These determinants often interact in complex ways. For instance, the benefits of maternal education may be weakened in communities with persistent infectious disease exposure, while wealth may not offer protection in settings with poor WASH infrastructure. 11 Classical regression models commonly used in anaemia research in Ghana.6,12,13 may fail to capture these non-linear and high-order interactions due to their reliance on strict parametric assumptions.
Machine learning presents a valuable alternative by identifying patterns directly from data without requiring pre-specified model structures. Algorithms such as Random Forests, Support Vector Machines, and Gradient Boosting (GB) have shown strong performance in predicting anaemia in settings such as Ethiopia, Nigeria, and Bangladesh.10,14,15 These methods can model complex interactions and improve risk classification, thereby supporting precision public health strategies. Although ML approaches are sometimes criticized for limited interpretability, tools such as SHapley Additive exPlanations (SHAP) help clarify feature contributions and enhance policy relevance. Therefore, the main hypothesis guiding this study is that supervised machine learning algorithms can achieve superior predictive performance for identifying childhood anaemia risk compared with traditional regression approaches. We further hypothesize that ML methods can better represent complex, non-linear relationships among child, maternal, and household factors, supporting more precise targeting of interventions. 15 This study applies supervised ML algorithms to the 2022 GDHS to predict childhood anaemia and compares their performance with traditional logistic regression. By identifying the most influential determinants and producing a high-accuracy predictive model, this work aims to advance evidence-based targeting of interventions and improve child health outcomes in Ghana.
2. Methods
2.1. Study objective and research question
This study aims to evaluate the comparative utility of various machine learning algorithms in predicting childhood anemia in Ghana using the most recent national survey data. We specifically sought to answer whether advanced machine learning models could provide better predictive accuracy and sensitivity than traditional logistic regression. We hypothesized that ensemble-based models would better capture the non-linear interactions between biological, maternal, and environmental factors, thereby improving the identification of high-risk children.
2.2. Data source and study sample
This study utilized data from the 2022 GDHS, a nationally representative, cross-sectional survey. The survey employed a two-stage stratified cluster sampling design. The population of interest consisted of children aged 6–59 months. The selection process followed a rigorous flow to ensure data quality: from the initial pool of children recorded in the 2022 GDHS, we excluded those outside the 6–59-month age range. We further excluded cases with missing or invalid hemoglobin measurements, children with missing anthropometric data (stunting, wasting, or underweight status), and those with incomplete maternal sociodemographic records. This systematic exclusion was necessary to prevent bias from missing data. After applying standardized sampling weights, the final sample for analysis comprised a weighted total of 3,382 children (Figure 1). Flow diagram of the study sample selection.
2.3. Study variables and measurements
2.3.1. Outcome variable
The primary outcome variable was childhood anemia status, determined via altitude-adjusted hemoglobin (Hb) concentrations. Consistent with World Health Organization guidelines, anemia was operationalized as a binary variable: children with Hb concentrations < 11.0 g/dL were classified as “Anaemic” (coded as 1), and those with Hb ≥ 11.0 g/dL were classified as “Non-anaemic” (coded as 0). 16
2.3.2. Predictor variables
Twenty-one predictor variables were identified based on a comprehensive review of existing literature.17–22 These were categorized into three domains:
2.3.2.1. Child characteristics
Variables included the child’s age (6-11, 12-23, 24-35, 36-47, 48-59 months), gender (male, female), birth order (1st, 2nd, 3rd, 4th, 5th, 6th+), and malaria blood smear result (positive, negative). Nutritional status was assessed using standard anthropometric indices: stunting (not stunted, stunted), wasting (not wasted, wasted), and underweight (normal weight, underweight). Fever occurrence in the two weeks preceding the survey (yes, no) was included as a proxy for acute infection.
2.3.2.2. Maternal Characteristics
Maternal predictors included age group (15-19, 20-24, 25-29, 30-34, 35-39, 40-44, 45-49 years), highest educational attainment (no education, primary, secondary, higher), marital status (not married, married/cohabiting), and employment status (not working, working). Maternal health and demographic indicators included maternal anemia status (not anaemic, mild, moderate, severe), ethnicity (Akan, Ewe, Mole-Dagbani, Others), religion (Catholic/Christian, Muslim, Traditionalist/No religion), and parity (one child, 2-3 children, 4-5 children, 6+ children).
2.3.2.3. Household characteristics
Household-level predictors comprised the wealth index (poorest, poorer, middle, richer, richest), region of residence (Western, Central, Greater Accra, Volta, Eastern, Ashanti, Western North, Ahafo, Bono, Bono East, Oti, Northern, Savannah, North East, Upper East, Upper West), and type of residence (urban, rural). Additional factors included the sex of the household head (male, female), household size (2-3, 4-6, 7-9, 10+ members), number of children under 5 (1, 2, 3+), and usage of treated mosquito nets (sleeping under treated net/not).
2.4. Statistical analysis
Data preprocessing and statistical modeling were conducted using Python (Version 3.9) and the Scikit-learn library. To prepare the data for modeling, categorical variables were transformed: nominal features (e.g., region, religion) were processed using One-Hot Encoding, while ordinal features (e.g., education level) were processed using Label Encoding. Continuous variables were standardized using the StandardScaler to ensure that features with different scales did not disproportionately influence models like SVM and ANN. To assess relationships between variables, we utilized a correlation matrix; for categorical-to-categorical and categorical-to-binary relationships, we employed appropriate non-linear association measures to ensure statistical rigor. Six supervised machine learning algorithms were employed: Logistic Regression (LR), Decision Tree (DT), Random Forest (RF), GB, Support Vector Machine (SVM), and Artificial Neural Network (ANN).
The dataset was partitioned into training (80%) and testing (20%) sets using stratified sampling. Given that the prevalence of anemia in the sample was 48.95%, the dataset was naturally balanced, and therefore, specific resampling techniques (such as SMOTE) were not required. Hyperparameter tuning was conducted via grid search using 10-fold cross-validation (CV) to optimize model architecture. The search space included: for RF and GB, the number of estimators (50–300) and maximum depth (3–10); for SVM, the kernel type (linear, RBF) and C parameter (0.1–10); and for ANN, the hidden layer sizes and activation functions. Model performance was assessed using accuracy, precision, recall (sensitivity), F1-score, and the Area Under the Receiver Operating Characteristic Curve (AUC-ROC). Given the public health implications of failing to identify anemic children, emphasis was placed on recall and AUC metrics. To ensure transparency, feature importance was analyzed using SHapley Additive exPlanations (SHAP).
3. Results
3.1. Descriptive statistics and anemia prevalence
Weighted descriptive statistics of study variables (N=3,382).

Nutritional status indicators were concerning: 17.47% of children were stunted, and 12.80% were underweight. The age distribution showed that the highest proportion of children (25.62%) were aged 12–23 months, a period globally recognized as one of heightened vulnerability to iron deficiency and infectious diseases. Maternal factors were critical determinants of child anemia. Overall, 39.82% of mothers were anaemic, comprising 22.84% mild, 16.55% moderate, and 0.42% severe cases—suggesting a strong maternal-child nutritional link. Socioeconomically, 23.02% of children belonged to the poorest wealth quintile. Geographically, the Ashanti region was the most represented (18.10%), indicating potential regional disparities in anemia risk. Additional household characteristics included household size, number of children under five, and parental demographics. For instance, 69.21% of households were male-headed, and 50.93% of the children lived in rural areas.
3.2. Correlation analysis
The correlation heatmap (Figure 2) illustrated the initial relationships between the predictors and child anemia status. Categorical variables were appropriately encoded to allow for relationship assessment Correlation heatmap of the variables.
The inverse relationships were equally informative: Anemia showed negative correlations with household wealth index (r = -0.18) and mother’s education (r = -0.16), confirming that socioeconomic disadvantage and lower maternal educational attainment are independently associated with an increased risk of anemia, a finding consistent with broader public health evidence.
3.3. Predictive performance of machine learning models
Predictive performance of machine learning models.

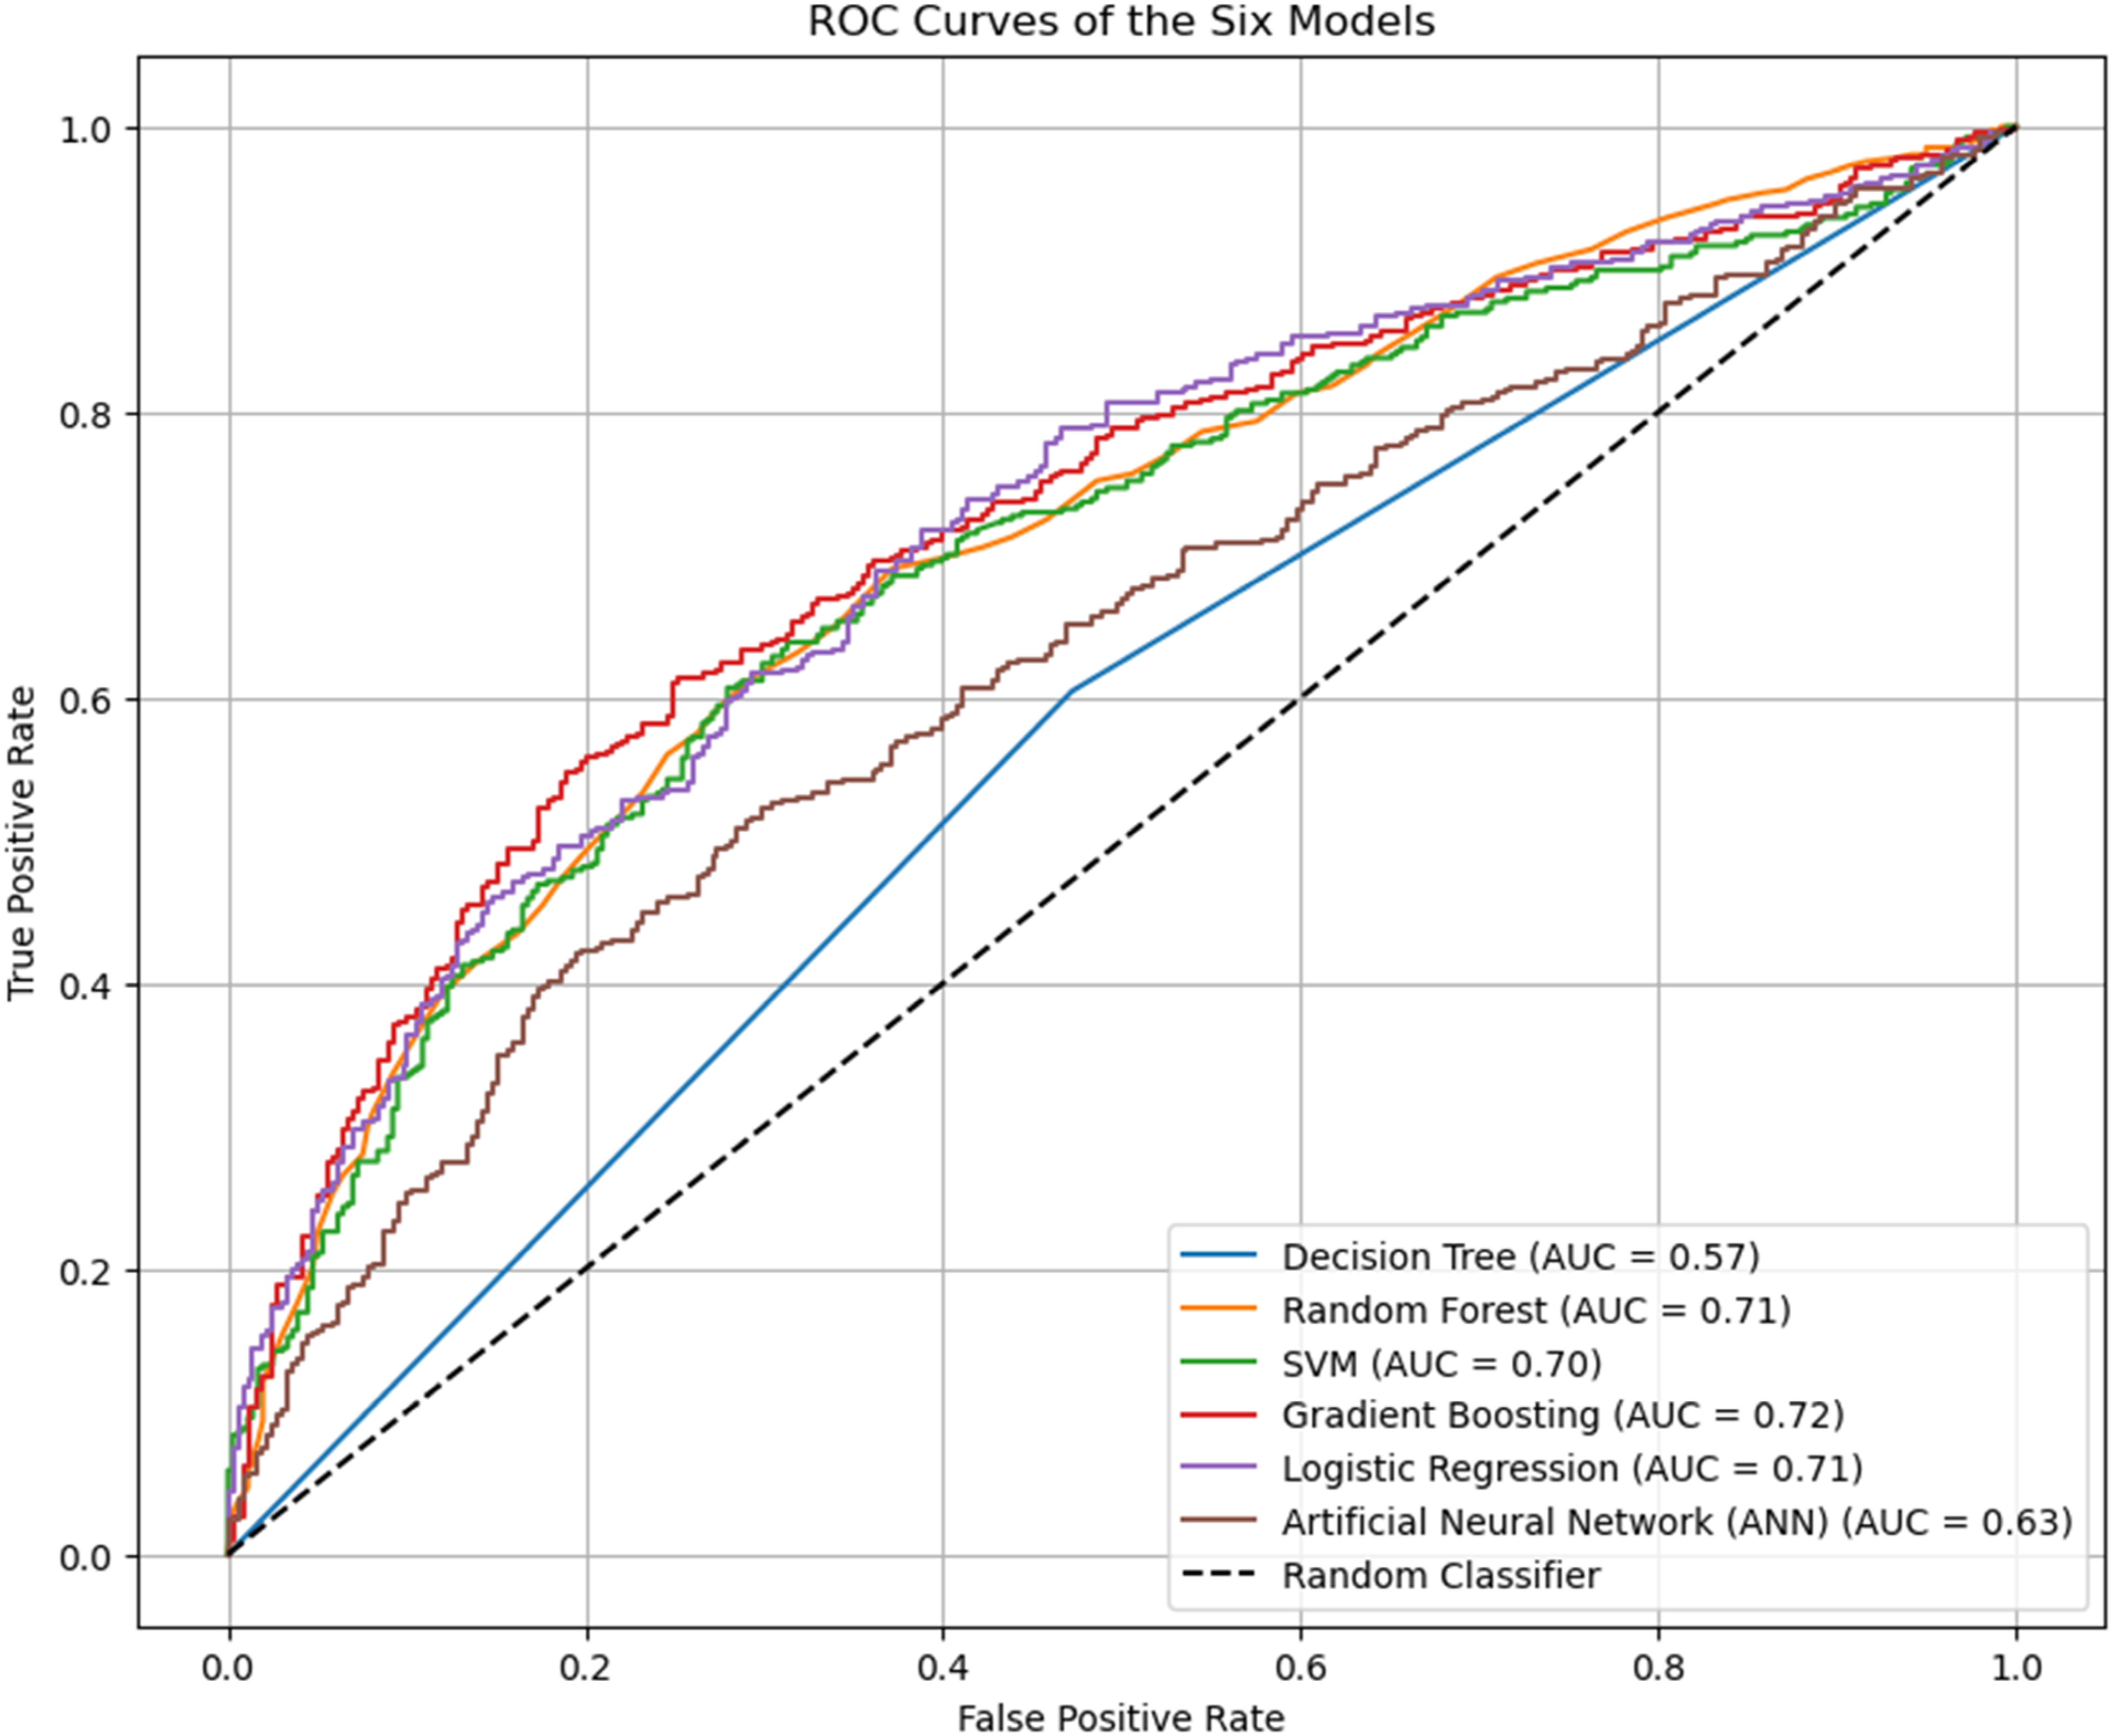
ROC curves comparing discriminatory power: Plots show true positive rate vs. false positive rate; curves closer to top-left indicate better prediction. Gradient boosting achieves the highest AUC (0.72).
Critically, analysis of the Confusion Matrices (Figure 4) and Classification Reports revealed a key public health insight. The top performers (SVM, LR, and GB) exhibited higher Recall for the anaemic class (Class 1) than for the non-anaemic class (Class 0). For example, LR identified 72% of actual anaemic cases but correctly identified only 61% of non-anaemic cases. The simpler Decision Tree (DT) and the complex Artificial Neural Network (ANN) models performed poorly, with near-random or marginally better-than-random AUCs (0.57 and 0.63, respectively), suggesting they failed to capture the underlying structure of the data effectively. Confusion matrices of model performance: (a) Gradient boosting, (b) logistic regression, (c) random forest, (d) decision tree (e) SVM, (f) ANN. Class ‘0’: Non-anemic, Class ‘1’: anemic. Top models (a–d) show higher recall for anemic children.
3.4. Feature importance analysis
3.4.1. Model-agnostic feature importance
The feature importance analysis (Figure 5) showed varying behavior across the diverse modeling approaches. While The set of features most critical for prediction, region, child age, and wealth, were consistently ranked among the top contributors across the ensemble and kernel methods, there were notable discrepancies in the ranking of biological versus distal factors. The Logistic Regression model, which focuses on linear relationships, identified malaria as the single most influential factor (highest coefficient), confirming its strong linear association with the outcome. In contrast, tree-based models like Gradient Boosting and Random Forest placed higher importance on child age and region, suggesting these models captured more complex, non-linear interactions involving geographic and developmental factors. The prominence of region across nearly all models suggests that unobserved environmental, cultural, or policy factors tied to geography are highly effective discriminators of anemia risk. Feature importance across model: (a) Gradient boosting, (b) logistic regression (absolute coefficients), (c) random forest, (d) decision tree, (e) SVM, (f) ANN. Top 10 predictors shown; region, child_age_months, and mother_anaemic consistently rank highest, indicating robust determinants of anemia risk.
3.4.2. SHAP analysis
The SHAP (SHapley Additive exPlanations) framework provided a unified measure of feature importance and a directional interpretation for the best-performing Gradient Boosting model, moving beyond correlation to explain how each feature affects the prediction. Figure 6 presents a comprehensive SHAP analysis. The analysis confirms that being in a younger age group (6–23 months), testing positive for malaria, having an anemic mother, and residing in specific regions (such as the Northern region) significantly increased the SHAP value, thereby increasing the predicted probability of childhood anemia. SHAP analysis of gradient boosting: (a) Mean absolute SHAP feature importance, (b) summary plot, (c) beeswarm plot (red: high, blue: low), (d) waterfall plot for individual prediction. Confirms child_age_months, malaria, mother_anaemic, and region as key predictors; younger age, malaria, maternal anemia, and certain regions increase anemia risk.
4. Discussion
This study assessed the comparative utility of six machine learning algorithms in predicting childhood anemia using the 2022 GDHS dataset. Among the algorithms tested, the GB model demonstrated the most robust overall discriminatory power, achieving the highest AUC of 0.72 and a F1-Score of 68.99%. This suggests that ensemble boosting methods are particularly effective at handling the complex, non-linear interactions inherent in demographic and health data. These findings align with recent applications of machine learning in public health, where ensemble techniques frequently outperform single classifiers by reducing bias and variance sequentially. 23
While Gradient Boosting offered the best overall balance, the LR and SVM models yielded the highest sensitivity (recall) at 71.74% and 72.73%, respectively. In the context of mass public health screening, high sensitivity is often prioritized over precision to minimize false negatives; missing a child with anemia can lead to severe developmental consequences. 3 It is worth noting that the performance of SVMs appears highly dependent on the data modality; while SVM demonstrated high sensitivity in this tabular dataset, Appiahene found that SVM yielded the lowest accuracy (96.34%) compared to Naïve Bayes and CNNs when detecting anemia using image-based features of the palm. 24
While some existing studies have reported significantly higher performance metrics compared to this study, the discrepancy is largely attributable to differences in data modality and feature specificity. Studies achieving accuracy exceeding 90% typically utilize image-based deep learning or clinical biomarkers, such as conjunctiva analysis or serum ferritin levels, which provide a direct physiological proxy for hemoglobin concentrations. 24 In contrast, our study utilizes nationally representative survey data, which focuses on distal socio-demographic and environmental risk factors. Our performance (AUC 0.72) is highly consistent with other DHS-based machine learning studies in Nigeria and Bangladesh which report AUCs in the 0.68 to 0.75 range.14,15 This suggests a predictive ceiling for survey-based models, where the lack of granular biological data, such as precise daily iron intake or individual helminthic load, limits the ability to achieve the near-perfect accuracy seen in clinical or diagnostic imaging tools.
Conversely, the RF model exhibited signs of overfitting, with a perfect training accuracy but significantly lower testing performance (65.23%), diverging from findings in Ethiopia where RF was identified as the superior model. 10 Furthermore, the Decision Tree and ANN models performed poorly, with AUCs ranging from 0.57 to 0.63. This underperformance contrasts with studies utilizing image processing, where Decision Trees have achieved accuracies as high as 99.29% when classifying anemic status based on palmar pallor. 24 This discrepancy suggests that the tabular nature of DHS data may be better suited to tree-based ensemble methods than simple decision trees or neural networks, which may require different feature representations to converge. 7 The application of SHAP values provided critical insights into the directionality and magnitude of risk factors. Consistent across the top-performing models, the strongest predictors of childhood anemia were child age, malaria status, maternal anemia, wealth index, and region.
Child age emerged as a dominant predictor, with SHAP plots indicating that children aged 6–23 months are at substantially higher risk. This period coincides with the weaning transition, where rapid growth increases iron requirements that are often unmet by complementary foods. 2 Malaria status showed a strong positive SHAP influence, confirming that parasitaemia remains a primary biological driver of anemia in Ghana. This is consistent with the pathophysiology of malaria, which causes hemolysis and bone marrow suppression. 25 Furthermore, maternal anemia exerted a positive influence on child anemia risk, reinforcing the existence of an intergenerational cycle of micronutrient deficiency. Socioeconomic determinants were also pivotal; lower wealth quintiles were associated with higher positive SHAP values, indicating increased risk. This reflects the compounded burden of food insecurity and poor sanitation, often found in low-income households. 26 Regional disparities were marked by broad distributions of SHAP values, suggesting that geographic location serves as a proxy for unmeasured environmental factors, such as healthcare accessibility and local dietary patterns. Conversely, variables like maternal education and marital status showed weaker SHAP contributions, suggesting that while they provide social context, they are secondary to immediate biological and structural determinants in this specific dataset.
The findings of this study corroborate a growing body of evidence from sub-Saharan Africa. The identification of wealth and age as critical predictors aligns with recent multilevel analyses from Liberia 2 and Mozambique, 3 which highlight how economic deprivation and early-life vulnerability intersect to drive anemia prevalence. Similarly, the strong association between malaria and anemia observed here mirrors findings from Nigeria, where malaria parasitaemia was identified as a leading risk factor in geospatial modelling.7,27 However, there are divergent views on the model’s efficacy. While some studies found Random Forest to be the optimal algorithm for Ethiopian datasets, our study found Gradient Boosting to be superior for the Ghanaian context.10,23 This discrepancy may result from differences in data preprocessing, particularly in class-balancing techniques, or from inherent differences in the feature spaces of East and West African datasets. For instance, Ghana’s distinct climatic zones and malaria transmission intensities may introduce variances that boosting algorithms capture more effectively than bagging methods. Additionally, our findings regarding the limited predictive power of household head characteristics contrast with studies in South Asia, where such patriarchal demographic factors often carry more predictive weight. 28
4.1. Policy and health system implications
The strong predictive capacity of the models supports the integration of machine learning into national health surveillance systems. This aligns with the broader push towards non-invasive and cost-effective screening methods advocated by Appiahene, 24 who highlight that machine learning algorithms can significantly reduce the time, pain, and expense associated with invasive blood sampling. The dominance of malaria as a predictor underscores the need to synchronize anemia control with the National Malaria Elimination Program. Interventions such as Seasonal Malaria Chemoprevention (SMC) and the distribution of Insecticide-Treated Nets (ITNs) should be viewed as direct anemia control strategies.29,30 The SHAP analysis highlights the critical window of 6–23 months, suggesting that nutritional interventions, such as micronutrient powder supplementation, must be aggressively targeted at this age group during postnatal care and immunisation visits. Furthermore, the strong maternal-child anemia link supports the implementation of dual-generation screening, where treating an anaemic mother triggers automatic screening for her child. 5
4.2. Study limitations
This study has several limitations. First, the GDHS dataset is cross-sectional, preventing the establishment of causal relationships between predictors and anaemia. Second, although the dataset was balanced (48.95% prevalence), lower specificity in some models indicates a challenge in correctly classifying non-anaemic children, potentially leading to unnecessary follow-up testing and inefficient use of limited resources if applied indiscriminately. Third, while the highest sensitivities achieved are promising for screening, they still imply a miss rate of approximately 28–30%, meaning nearly one in three anaemic children would not be identified by these models; this clinical limitation should be explicitly considered when deploying such tools for public health screening. Fourth, the feature importance rankings were not fully consistent across algorithms, reflecting differences in model structure and how each method captures linear versus non-linear relationships and interactions; therefore, determinant “importance” should be interpreted as model-dependent rather than as a single definitive hierarchy. Fifth, reliance on self-reported variables, such as fever occurrence or bed net usage, introduces recall bias, which may dilute the predictive signal of these features. Finally, the models lacked granular data on dietary intake (e.g., consumption of iron-rich foods) and parasitic co-infections (e.g., helminths), both known determinants of anaemia. These unobserved factors may partly explain the ceiling on predictive performance (∼66–68% accuracy) observed across all models.
4.3. Future research directions
Future studies should aim to integrate clinical biomarkers, such as serum ferritin and C-reactive protein, to distinguish between iron-deficiency anemia and anemia of inflammation/infection. Furthermore, a multimodal machine learning framework could be developed by combining the demographic risk factors identified in this study with image-based screening. As demonstrated by Appiahene, algorithms such as Naïve Bayes can achieve up to 99.96% accuracy using palm images; fusing this visual data with survey-based predictors could significantly enhance diagnostic precision. 24 Incorporating geospatial environmental data, such as rainfall patterns and vegetation indices, could also enhance the predictive power of regional variables. Additionally, applying Deep Learning techniques to larger, pooled datasets from multiple West African nations could help capture complex, high-dimensional interactions that standard ML models miss. Developing hierarchical or multi-level ML models would also better account for the clustering of risk factors at the household and community levels. Finally, external validation of these models using facility-based data is essential before clinical deployment.
5. Conclusion
This study shows that machine learning models, particularly Gradient Boosting, can support prediction of childhood anaemia in Ghana using nationally representative survey data, achieving moderate discrimination and reasonable overall accuracy. The findings reaffirm that childhood anaemia in Ghana is shaped by a syndemic of malaria, early-life biological vulnerability, maternal anaemia, and socioeconomic deprivation. While these models offer a framework for predictive risk stratification to support more targeted allocation of limited resources, their performance, especially the sensitivities observed, still implies that approximately 28–30% of anaemic children may be missed if deployed as a standalone screening approach. Therefore, any operational use should be complemented by confirmatory testing and implemented with clear thresholds and follow-up pathways. Progress toward the Global Nutrition Targets for 2025 will require integrated strategies that combine malaria control, maternal–child nutrition interventions, and poverty alleviation, guided by data-driven targeting of the most vulnerable populations.
Footnotes
ORCID iDs
Ethical considerations
This study is based on secondary analysis of the 2022 Ghana Demographic and Health Survey (GDHS) dataset. The original data collection protocol was approved by the Institutional Review Board of ICF and the Ghana Health Service Ethics Review Committee.
Consent to participate
Informed consent was obtained from parents or legal guardians for all child participants in accordance with established ethical standards. As this research utilizes publicly available, de-identified, and anonymized data, the requirement for additional ethical approval for this secondary analysis was formally waived by the Institutional Review Boards of the authors’ respective institutions. Confidentiality and anonymity were strictly maintained throughout the analytical process.
Author contributions
MMA Conceptualized this idea. The study design was developed collaboratively by ASA, MMA, MAO and YSAH. Material preparation and data collection were performed by YSAH and MMA. MAO analyzed and interpreted the data. The initial draft was composed by ASA, MMA and YSAH. JKK revised the manuscript. All authors contributed to the writing, reviewing, and editing of the subsequent versions of the manuscript.
Funding
The authors received no financial support for the research, authorship, and/or publication of this article.
Declaration of conflicting interests
The authors declared no potential conflicts of interest with respect to the research, authorship, and/or publication of this article.