
Abstract
As a chronic disease, diabetes mellitus has emerged as a worldwide epidemic. The aim of this study is to classify diabetes disease by developing an intelligence system using machine learning techniques. Our method is developed through clustering, noise removal and classification approaches. Accordingly, we use expectation maximization, principal component analysis and support vector machine for clustering, noise removal and classification tasks, respectively. We also develop the proposed method for incremental situation by applying the incremental principal component analysis and incremental support vector machine for incremental learning of data. Experimental results on Pima Indian Diabetes dataset show that proposed method remarkably improves the accuracy of prediction and reduces computation time in relation to the non-incremental approaches. The hybrid intelligent system can assist medical practitioners in the healthcare practice as a decision support system.
Keywords
Introduction
Diabetes has been one of the leading health problems in the United States. 1 It has attained the dubious distinction of becoming the fifth leading cause of disease-related death. 2 Diabetes is a chronic endocrine disorder affecting the body’s metabolism and resulting in structural changes affecting the organs of the vascular system.3,4 Generally, diabetes is characterized as existing in two major forms: (a) insulin-dependent (Type I) 5 and (b) noninsulin-dependent (Type II). 6 The latter appears to be the more common, accounting for 80 percent of all cases. 2 The Pima is one of the most studied populations regarding diabetes, not only among American Indians, but in the world. 7 The most studied populations regarding diabetes is Pima, not only among American Indians but also in the world. 7 The samples of studied populations regarding diabetes refer to discrete Type-2 positive and negative instances.
The only way for the diabetes patient to live with this disease is to keep the blood sugar as normal as possible without serious high or low blood sugars, and this is achieved when the patient uses a correct management (therapy) which may include diet and exercising, taking oral diabetes medication or using some form of insulin. 2 However, treating the diabetes disease is also a difficult, an expensive and a complex task for the medical staff. 8 There are a number of important things to record about the patient and disease that help the doctors to make an optimal decision about the patient to make his or her life better.
Machine learning deals with the development of technologies which allow machines to learn. The challenge is to create algorithms that can take a group of patterns (on a broader range, the existing knowledge) and automatically make new inferences from the initial information, with or without human intervention.
From the machine learning perspective, classification is the problem of identifying a set of observations into several categories, based on the training result of a subset of observations whose belonging category is known. The unsupervised learning is defined as cluster analysis. It is also called clustering. Clustering is a process of putting a set of observations into several reasonable groups according to certain measures of similarity within each group. The clustering problem has been addressed in many disease diagnosis systems.9-11 This reflects its broad appeal and usefulness as one of the steps in exploratory health data analysis.
There is a vast sea of different techniques and algorithms used in data mining, especially for supervised machine learning techniques; therefore, selecting the appropriate technique has been a challenge among researchers in developing the diabetes disease diagnosis systems.12,13 In addition, although these data mining methods can be used to classify the diabetes disease through a set of real-world datasets, most of the methods developed by supervised methods in the previous researches do not support the incremental approaches for diabetes disease prediction. Furthermore, standard supervised methods usually cannot be performed in incremental situation and therefore they require to recompute all the training data to construct the classification model. Hence, in order to improve predictive accuracy and computation time of diabetes disease classification, a new method is proposed by applying noise removal, classification and clustering techniques. To the best of the authors’ knowledge, there is no implementation of classification method (support vector machine (SVM)), clustering method (expectation maximization (EM)) and noise removal method (principal component analysis (PCA)) for diabetes disease diagnosis from the real-world dataset. In addition, since in medical datasets constantly new information is available, it is desirable to incrementally update the once trained models to reduce computation time in classifying the data. The proposed method in the study at hand supports incremental updates and re-learning of data and is more efficient in memory requirement.
Our study at hand is organized as follows. In section “Related work,” we present the related work. In section “Methodology of research,” the research methodology and all techniques incorporated to the proposed method are explained. In section “Results of methods,” the evaluations of methods are presented. Finally, we conclude our work in section “Conclusion and future work.”
Related work
Polat et al. 14 used discriminant analysis and SVM for diabetes classification. Using 10-fold cross-validation, they achieved 82.05 percent of accuracy on Pima diabetes dataset. Kayaer and Yıldırım 15 developed a method using general regression neural network (GRNN) for diabetes classification. The method was tested on Pima Indian Diabetes (PID) and achieved 80.21 percent accuracy for classification. Aslam et al. 16 proposed a method using genetic programming (GP) for diabetes classification. The method includes three stages: features selection, features generation and testing. Two classifiers, the k-nearest neighbor (k-NN) and SVM, were used for evaluating the selected features. The authors tested the performance of method using Pima Indians diabetes dataset. A hybrid intelligent system was developed by Kahramanli and Allahverdi 12 using fuzzy neural network (FNN) and artificial neural network (ANN). They evaluated the method on two public medical datasets, Pima Indians diabetes and Cleveland heart disease. Using k-fold cross-validation, the method obtained classification accuracies of 84.24 and 86.8 percent for Pima Indians diabetes dataset and Cleveland heart disease dataset, respectively. An intelligent system was proposed by Erkaymaz and Ozer 13 for diagnosis of diabetes. The method was based on the small-world feed forward artificial neural network (SW-FFANN). The accuracy of the method was 91.66 percent. Ganji and Abadeh 17 developed a method, FCS-ANTMINER, by ant colony optimization (ACO). They extracted a set of fuzzy rules to classify the diabetes disease. The obtained classification accuracy was 84.24 percent. An intelligent diagnosis system, linear discriminant analysis–adaptive neuro-fuzzy inference system (LDA-ANFIS), was developed by Dogantekin et al. 18 for diabetes using LDA classification method and neuro-fuzzy (ANFIS) system. The classification accuracy of LDA-ANFIS was about 84.61 percent. A comparative study of diabetes disease on Pima Indian diabetes disease was conducted by Temurtas et al. 19 They used multilayer NN which was trained by Levenberg–Marquardt (LM) algorithm and probabilistic NN. An automatic diagnosis system, linear discriminant analysis–Morlet wavelet support vector machine (LDA–MWSVM), was developed for diabetes by Çalişir and Doğantekin. 20 They used Morlet wavelet support vector machine (MWSVM) classifier and LDA. Their method classification accuracy was about 89.74 percent.
From the literature on diabetes disease diagnosis from experiments with Long Beach and Cleveland Clinic Foundation, we found that at the moment there are no implementations of PCA, Gaussian mixture model with EM and SVM method for distinguishing between presence and absence of diabetes disease in patients. This research accordingly tries to develop a diabetes disease diagnosis intelligent system based on these methods. Overall, in comparison with research efforts found in the literature, in this research
EM is used for data clustering. The clustering problem has been addressed in many disease diagnosis systems.9-11 This reflects its broad appeal and usefulness as one of the steps in exploratory health data analysis. In this study, EM clustering is used as an unsupervised classification method to cluster the data of experimental dataset into similar groups.
SVM is used for data classification. SVM is widely employed in diagnosis of diseases for their efficiency and robustness. It is a promising classification approach which has been used in many researches on diseases classification.21-24
PCA is used for dimensionality reduction and dealing with the multi-collinearity problem in the experimental data. This technique has been used in developing in many disease diagnosis systems to eliminate the redundant information in the original health data. 25
Incremental techniques, incremental support vector machine (ISVM) and incremental principal component analysis (IPCA), are used for incremental learning. Incremental techniques have been used in many disease diagnosis systems23,26,27 to enhance the predictive accuracy and decrease the computation time of classification.
By combination of EM, PCA and SVM, a hybrid intelligent system is proposed to increase the predictive accuracy and decrease the computation time of diabetes disease.
Methodology of research
Focusing on the prediction and classification of diseases, this study uses PCA, EM and classification (SVM) methods. We also develop the method for incremental situation using incremental noise removal method (IPCA) and incremental classification (ISVM) method. The general framework of proposed model is shown in Figure 1. We propose to rely on classification methods to learn the classification functions. Additionally, PCA is employed for dimensionality reduction and to overcome the multi-collinearity problem of the datasets. In addition, since in medical datasets the data are constantly collected from the new observations, it is beneficial to incrementally update previous model of classification by considering only new arrived data to reduce the computation time in classification tasks. The proposed method therefore supports incremental updates using IPCA and ISVM to re-learn the medical data which can be more efficient in memory requirement. These methodologies are addressed in the following sections.
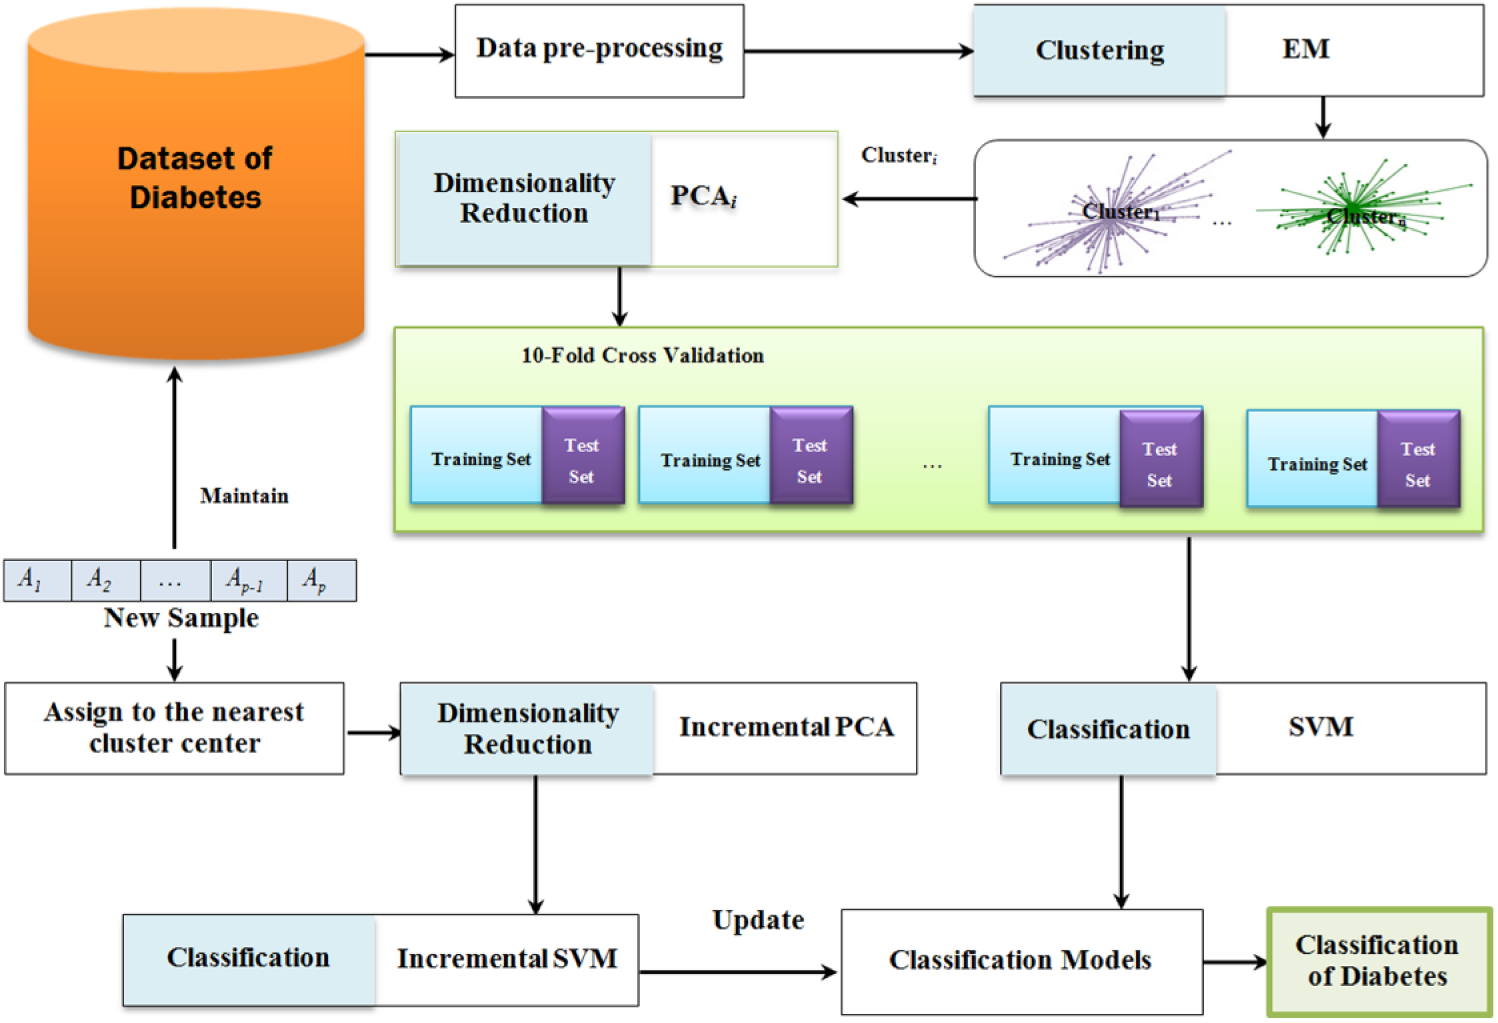
Proposed method for the diabetes diseases diagnosis.
Dataset for the experiments
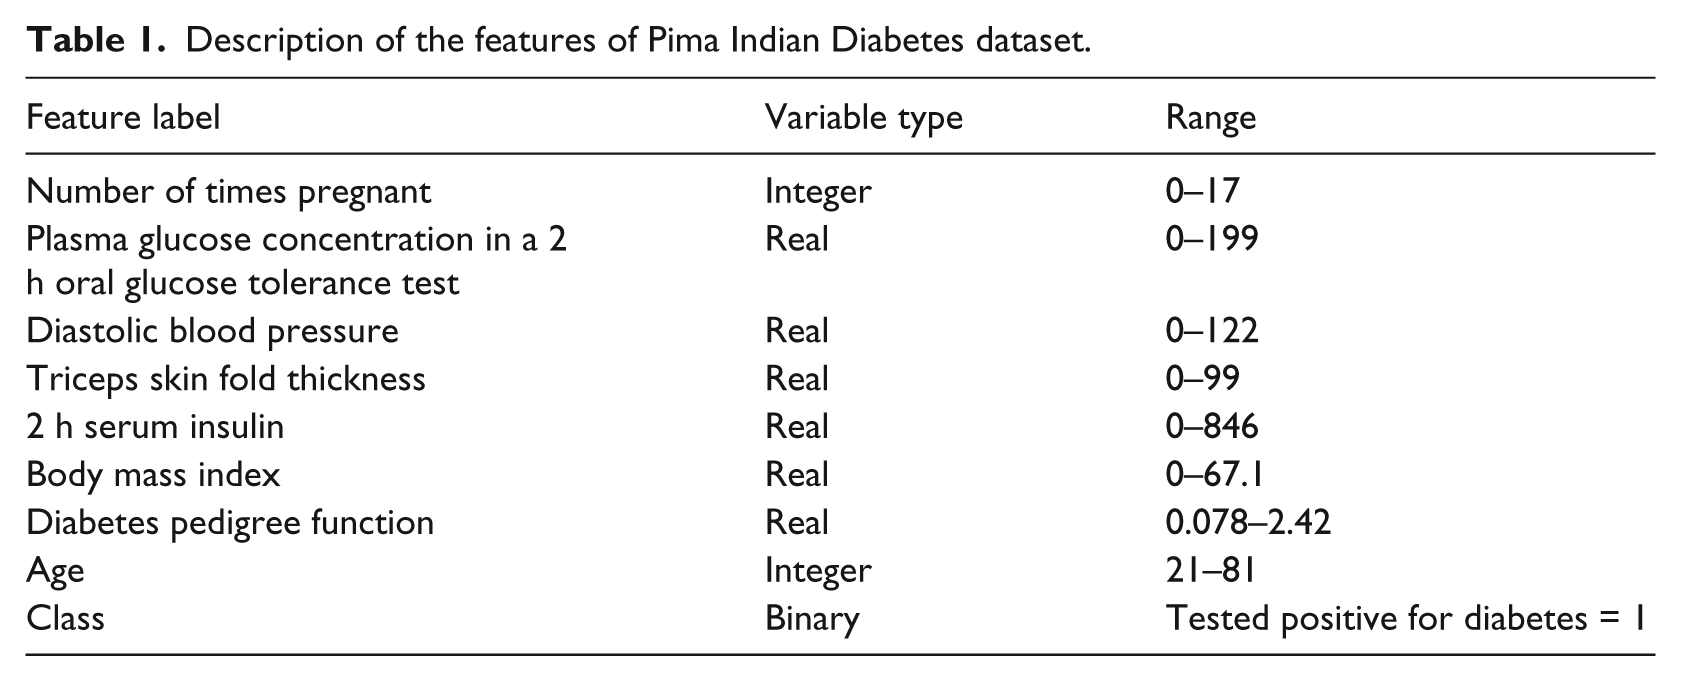
The Pima aboriginals diabetes dataset is provided at the courtesy of National Institute of Diabetes and Digestive and Kidney Diseases and Vincent Sigillito of the Applied Physics Laboratory of the Johns Hopkins University who was the original donor of the dataset. The actual data itself are obtained by the author of this research from the website of the UCI (University of California, Irvine). 28 These data have been used in the past by the researchers to investigate possible vital signs that may be used to indicate the presence of diabetes within patients according to World Health Organization (WHO) standards. There are a total of 768 training instances included in this dataset. Each training instance has eight features and a class variable that provides the label for that training instance (see Table 1). The features are number of times pregnant, plasma glucose concentration, diabetes pedigree function, triceps skin fold thickness (mm), diastolic blood pressure (mmHg), 2-h serum insulin (mU/mL), body mass index (kg/m2) and years of age. The class variable takes on the binary value of 0 or 1, with 0 indicating a healthy person and 1 indicating a patient with diabetes.
Description of the features of Pima Indian Diabetes dataset.
EM clustering
One of the commonly used model-based clustering approaches is mixture-approach EM algorithm, which was first officially proposed by Dempster et al. 29 Later, Wu 30 has corrected a flawed convergence analysis in the method. The EM algorithm is widely used because of its simplicity, easy implementation and its efficient iterative procedure in computing the maximum likelihood (ML).31-34
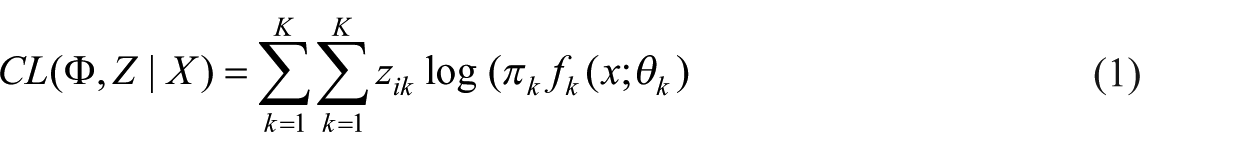
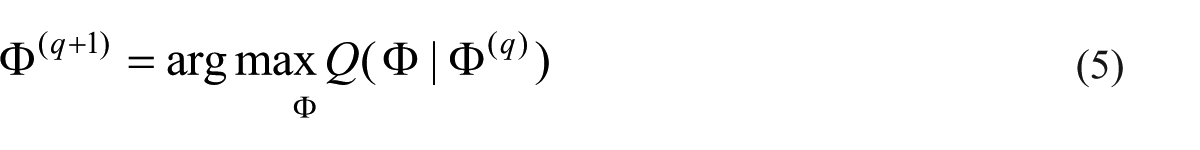
Since it is not easy to maximize the log-likelihood directly, EM algorithm maximizes the expectation of complete log-likelihood instead. The complete data in EM algorithm are considered to be (x, z). z is the missing data indicating the mixture component origin label of each observation. z = (z1, …, zn) where zi = k when xi belongs to the component k. The complete log-likelihood takes the form
EM algorithm starts from the initial parameter
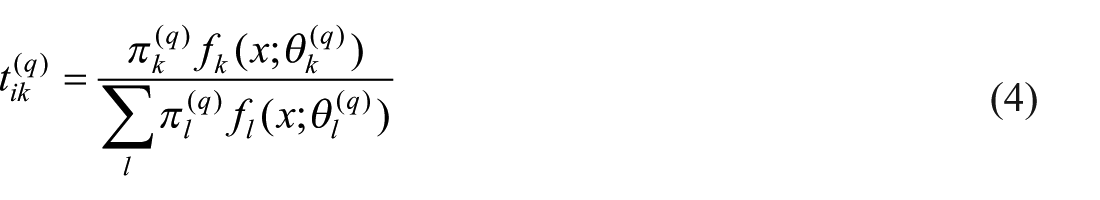
E step. In this step, the expected value of the complete log-likelihood function is calculated. The calculation is with respect to the conditional distribution of z given x under the current estimate of the parameters


that is, calculate the posterior probabilities
M step. In this step, the parameter
PCA
PCA is a statistical technique for multivariate analysis and is used as a dimensionality reduction technique in data compression to retain the essential information and is easy to display. 35 The method identifies patterns in data and represents the data in a way that highlights similarities and differences. The central idea is to reduce the number of dimensions of the data while preserving as much as possible the variations in the original dataset. 36 PCA has four goals. The first goal is to extract the most information from the data. The second goal is to compress the data by only keeping the most characterizing information. The third goal is to simplify the description of the data and the fourth goal is to enable analysis of the structure of the observations. The analysis enables conclusions to be drawn regarding the used variables and their relations. The analysis is performed through transforming the data to a new set of variables, called the principal components (PCs). 37 The PCs are uncorrelated and ordered so that the first few PCs retain most of the variations of the total dataset.38,39 The first PC describes the dimension in which the data have the biggest variation (variance) and the second component describes the dimension in which it has the second largest variation (variance).
PCA is chosen for this study because the method exemplifies a category of analysis methods. If the data have linear relations and are correlated, as data often are in medical datasets, the method will give a compression that maintains a high amount of the information in the original dataset. The described solution saves a compact summary of the data, which is derived by applying ideas from statistics to enable an analysis while preserving its characteristics. In this study, we use an algorithm for IPCA proposed by Hall et al. 40 that updates eigenvalues and eigenvectors incrementally.
ISVM
SVMs are large-margin classifiers which have found successful applications in many scientific fields such as engineering 41 and disease classification, 21 information retrieval, 38 finance and business 42 among many others. An important and crucial point in the SVM formulation is that it can provide a good generalization independent of the training set’s distribution by making use of the principle of structural risk minimization. This principle provides a trade-off between the complexity of the classifier (accuracy in the training set) and the quality of fitting the training data (generalization-empirical error). Therefore, the SVMs belong to a class of algorithms which are known as maximum-margin classifiers. The size of the gap is decided upon the training samples which are between the margins. These samples are the so-called support vectors (SVs).
Classical SVMs method has been originally developed as offline classification algorithms that are trained with a pre-determined dataset before they can be used for classification problems. Cauwenberghs and Poggio 43 proposed ISVM by analyzing the changes of the Karush–Kuhn–Tucker (KKT) conditions for online learning when a new (incremental) sample was added into the old samples. Employing a partition of the dataset, ISVM trains an SVM which reserves only the SVs at each step of training the samples and creates the training set for the next step using these SVs. Hence, the key of ISVM is to preserve the KKT conditions on all existing training data while adiabatically adding a new vector. In this project, the MATLAB scripts of incremental learning are created based on Cauwenberghs and Poggio’s 43 work.
Suppose the current working set is
Cross-validation
Cross-validation is a statistical method that, in this research, is used for the performance evaluation of learning algorithms and performance of a predictive model on an unknown dataset. For this reason, using cross-validation, the datasets used in the research are divided into several equally sized subsets (see Figure 2). The learning model is then trained on some subsets known as training sets. After training process, the model is tested on the remaining subsets, known as test sets. According to the number of subsets partitioned, researcher tests k-fold cross-validation. For 10-fold cross-validation, researchers use 10 result of 10-fold cross-validation. In the experiments of this research, for the training of models, it is considered to test different 10 for 10-fold cross-validation, so that researchers can make sure that there are enough training instances to learn the models. 44
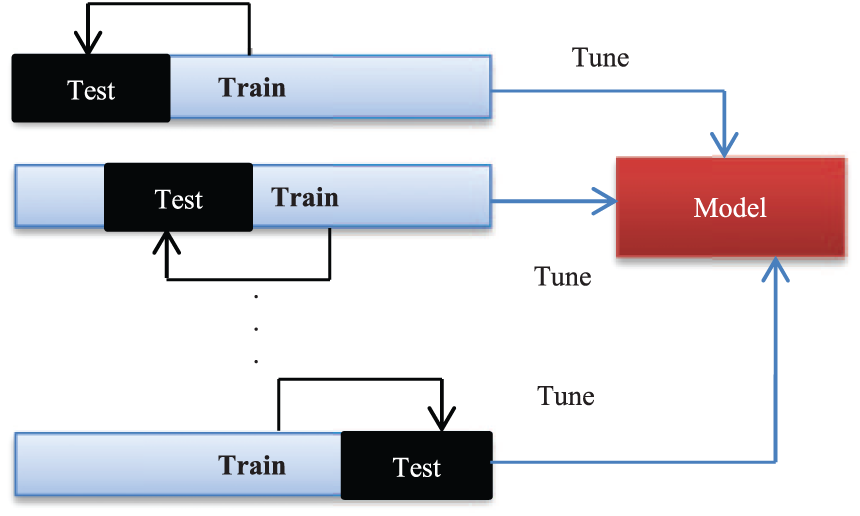
k-fold cross-validation.
Results of methods
The experimental results of the proposed method on real-world datasets are explained in this section. Here, the results of applying all incorporated methods in the proposed system are discussed.
Clustering with EM algorithm
In this research, EM algorithm is applied on experimental dataset. As far we know, in any clustering algorithm, the right number selection of the clusters is an important task. The selection of number needs to be performed to provide the best quality for clustering. In EM algorithm, the maximization of likelihood is important for the Gaussian mixture model. Akaike information criterion (AIC), as a model selection approach, can be used for the maximization of likelihood. 45 Accordingly, for the dataset used in this study, we have applied resubstitution AIC to select the value optimal number of clusters in EM algorithm. Additionally, 10-fold cross-validation was applied in the clustering procedure to obtain unbiased results. Hence, as we used resubstitution AIC estimate to choose the value optimal number of clusters, we need to test the number of clusters from n = 1 to n = m, in which for n > m, the criterion value be always increased. From the results, we found the minimum criterion value for n < 10 and, accordingly, we decided m = 10 for obtaining optimal criterion value. The results of clustering by EM is presented in Figure 3 where based on chosen criterion, the various numbers of clusters are shown to select the best cluster for the datasets.
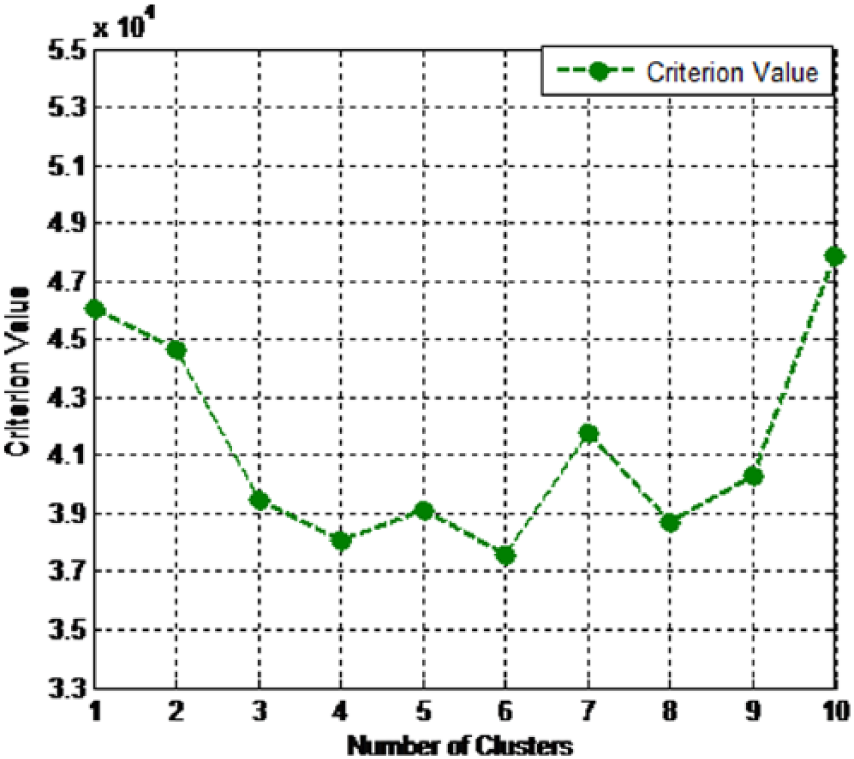
Best cluster using EM algorithm for PID dataset.
In addition, from Table 2, it can be seen that the best criterion value (37577.854250) is obtained when EM generates six clusters. For visualizing clusters of EM for each dataset in scatter plot, we use two PCs of PCA in order to obtain a two-dimensional (2D) representation. In Figure 4, the clusters (six clusters) generated by EM are visualized. As can be seen, we project the observations in the first two dimensions generated by PCA.
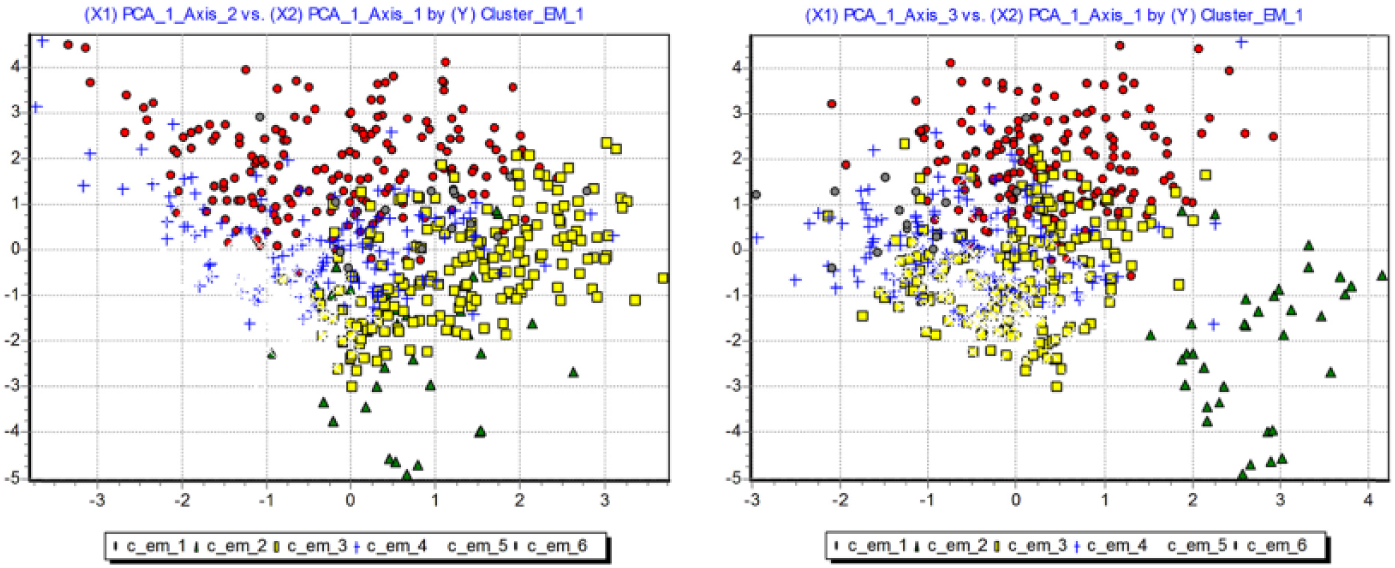
Clusters visualization of PID dataset.
Best cluster using EM algorithm for PID dataset.
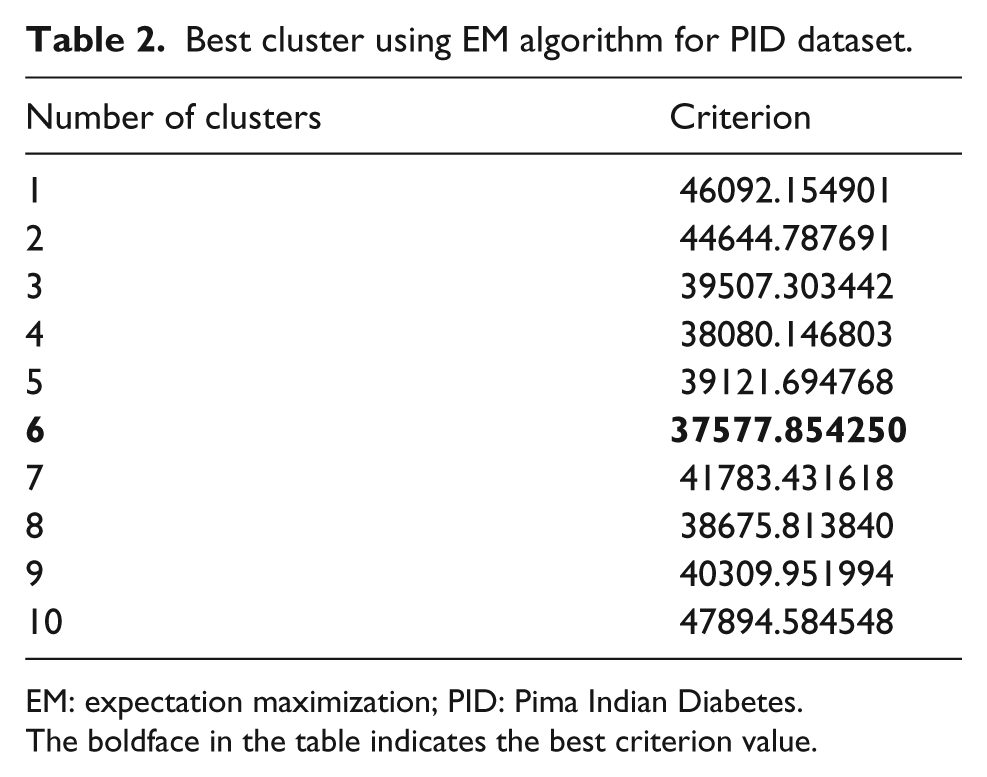
EM: expectation maximization; PID: Pima Indian Diabetes.
The boldface in the table indicates the best criterion value.
PCA evaluation
As PCA generates PCs instead of original factors, choosing the right number selection of these PCA is an important task. If we select too many factors, we include noise from the sampling fluctuations in the analysis. If we choose too few factors, we lose relevant information, and the analysis is incomplete. As we know that the eigenvalue associated to a factor corresponds to its variance, the eigenvalue indicates the importance of the factor. The higher the value, the higher the importance of the factor. The eigenvalues for each factor can be indicators for its importance. In this study, we have applied the rule proposed by Cattell. 46 Accordingly, we create “scree” plots that show the eigenvalues of the factors. In the “scree” plots, we can simply detect “elbows” to decide the number of PCAs to be used in the classification process.
We employed the PCA technique for the clusters of experimental dataset obtained by EM algorithm. Based on the rule proposed by Cattell, 46 in PID, for Cluster 1, we included the elbow into the selection, that is, we selected k = 2 factors. Indeed, the eigenvalues associated with the second factor was high. In addition, three PCs for Clusters 2 and 4 and four PCs for Clusters 3, 5 and 6 were chosen.
Performance evaluation of ISVM
This section provides the experimental results of diabetes disease classification with non-incremental and incremental SVM classifiers based on PID. In addition, comparison experiments with other methods in the literature are performed using non-incremental and incremental SVM based on the same dataset.
As far we know the classical SVM, it can be used as offline classification and prediction methods which are trained with a pre-determined dataset before they can be used for the disease classification and prediction. In addition, the capability of classical SVM is limited by fixed number of training samples. Therefore, there was a need for a classifier that be able to augment itself with new data constantly. Accordingly, we have implemented ISVM to overcome this issue by taking their ability in learning incrementally.
The models of classification were trained under a 4 GHz processor PC and Microsoft Windows 7 running MATLAB 7.10 (R2010a). We applied ISVM with radial basis function (RBF) kernel on experimental dataset clustered by EM algorithm. To show the predictive accuracy of the proposed method, we use area under the curve (AUC) of receiver operating characteristic (ROC) chart. ROC is a graphical display that provides the measure of classification accuracy of the model using sensitivity and specificity. 24 For predicting events, sensitivity in ROC can be used as a measure of accuracy which can be calculated by dividing the true positive over total actual positive. For predicting nonevents, specificity can be used as a measure of accuracy which can be calculated by dividing true negative over the total actual negative of a classifier for a range of cutoffs.
As we have selected RBF kernel for SVM classifier, there are two parameters, C and
In order to experimentally demonstrate the effectiveness of EM clustering, IPCA and ISVM, we divide the data in the clusters into two categories. The first category is considered as initial clustering and the second one is considered for incremental phase that is incrementally added to the initial clusters data. The aim is to calculate the classification prediction time method after adding the second category data incrementally. We perform this procedure on all clusters and present the average computation time. The general procedure of this evaluation is demonstrated in Figure 5.
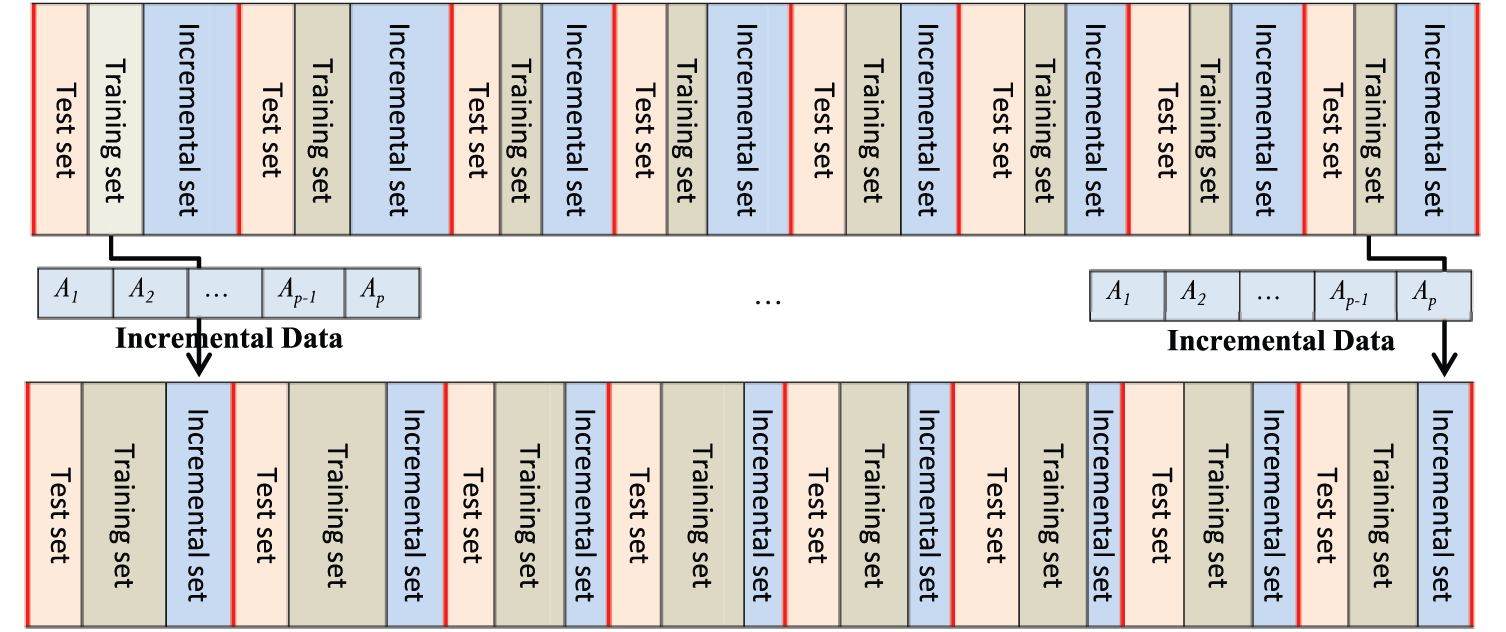
ISVM evaluation procedure.
For evaluating the ISVM, we initially considered 20 percent of data in any cluster for test set, 20 percent for initial data clusters and 60 percent for incremental set which is incrementally added to the clusters, initial data.
The increment ratio is considered 10 percent of incremental set and added to training set and calculated computation time. Specifically, we consider six measurement points add the 10 percent of data to the initial clusters in each measurement point. In that direction, for different measurement points, the average computation time and accuracy were calculated for all clusters.
To experimentally show the effectiveness of EM and incremental approach (ISVM), we conduct the experiments on the public PID dataset and compare with the methods of the non-incremental learning for computation time. It should be noted that the kernel parameters and penalty parameter C have been determined by 10-fold cross-validation.
In Figure 6(a), the classification accuracy of ISVM measured by ROC in each cluster for PID is presented. From all plots in Figure 6(a), we can see the influence of using ISVM on accuracy is significant and the incremental update has provided a good classification accuracy measured by ROC in each cluster. The average accuracy obtained by the proposed method is about 97.95 percent for all clusters. It should be noted that the increment ratio for ISVM is considered 10 percent of incremental set and added to training set, and we calculated accuracy in each fold of 10-fold cross-validation.
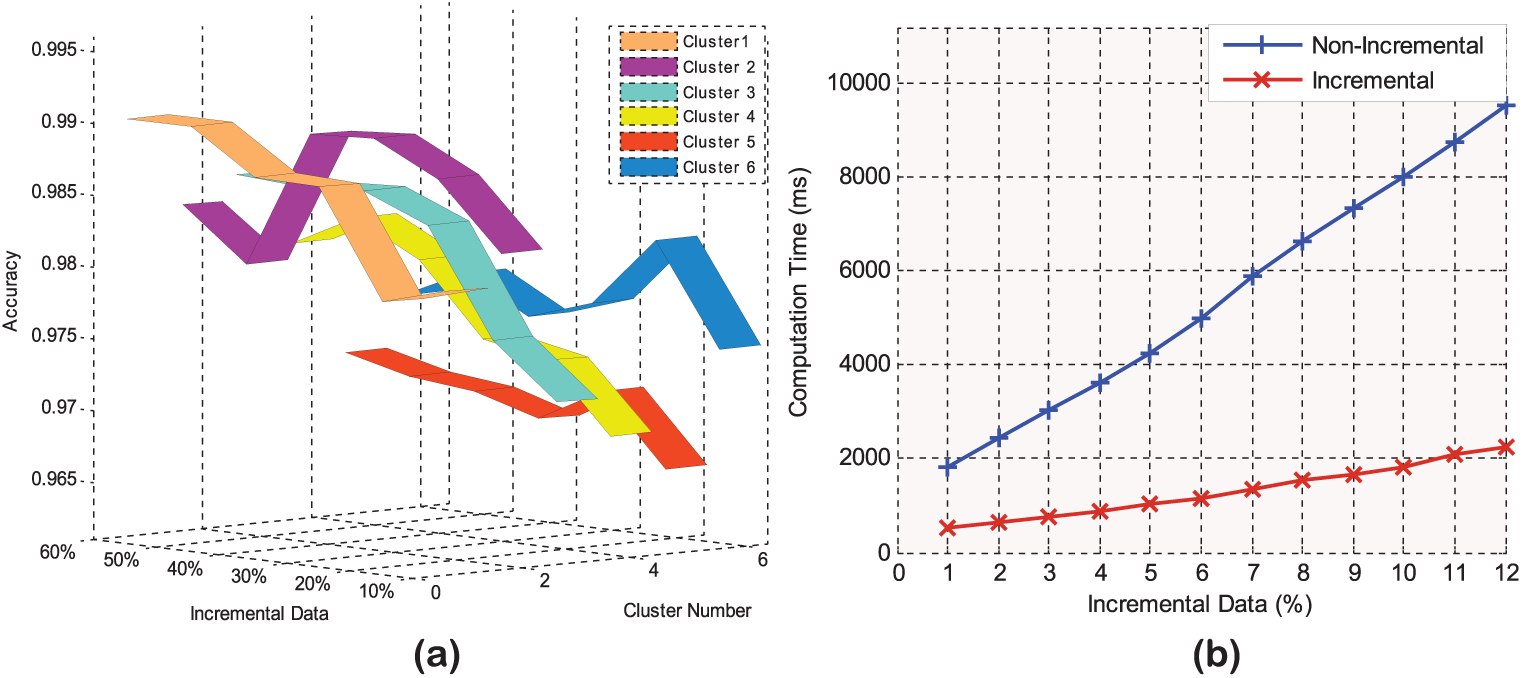
Incremental SVM evaluation for (a) accuracy and (b) computation time.
Figure 6(b) presents the computation time results of our experiments for the proposed method in the incremental situation. The computation time is plotted as a function of the incremental data percentage. Note that in the comparative experiments, the non-incremental SVM and ISVM were tested with a 10-fold cross-validation. From all curves in Figure 6(b), we can see that the incremental method has significantly reduced the computation time in relation to the non-incremental one. In addition, as the figure shows, non-incremental methods perform poor with respect to time for PID dataset. From the curves as shown in the figures, it can be also observed that by increasing the number of incremental data, the computation time is slightly raised. A possible explanation could be that, since the non-incremental method cannot learn in the incremental situation, it requires to recompute all the training data to build the classification and prediction models. In addition, the non-incremental SVM method can be used as an offline method and is trained with a pre-determined dataset before it can be used for the disease classification. Thus, the capability of non-incremental SVM is limited by fixed number of training samples in each cluster, and it is not be able to augment itself with new data constantly. In other words, those medical records in the experimental dataset, which have been incrementally added, need to be retained along with the previous data in each cluster through non-incremental SVM. However, the methods that use ISVM reduce computation time results as it needs to train only the data which have been added incrementally. Finally, the method that combines clustering, IPCA and ISVM lead to the computation time reduction results. Overall, the results showed that the main practical advantage of using ISVM as a training method is a great saving in computation time.
We compare the accuracy of our proposed method with the classification accuracy of the methods GRNN, 15 General Discriminant Analysis and Least Square Support Vector Machine (GDA-LSSVM), 14 MWSVM 20 and SW-FFANN 13 for PID. The performance of the classifiers that were compared with our method is shown in Table 3. From the results shown in this table, our proposed method proves to have a better accuracy (0.9795) in relation to the other classification systems. Compared to GRNN (80.21%), GDA-LSSVM (79.16%), MWSVM (89.74%) and SW-FFANN (91.66%), our classification, clustering and noise removal techniques help to improve the classification accuracy of diabetes disease by more than 17, 18, 8 and 6 percent, respectively. This shows the effectiveness of incorporating the clustering and PCA techniques for the classification accuracy of diabetes disease.
Comparison of proposed method with other classifiers for PID.
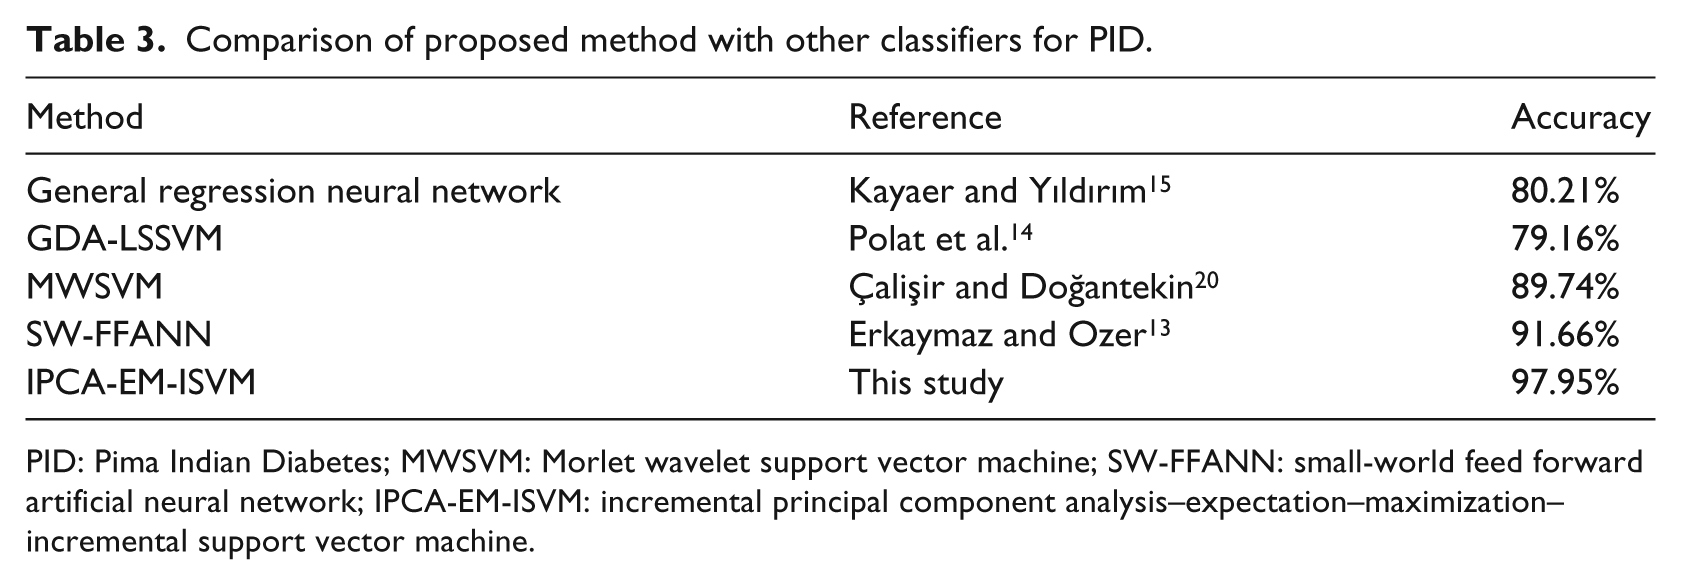
PID: Pima Indian Diabetes; MWSVM: Morlet wavelet support vector machine; SW-FFANN: small-world feed forward artificial neural network; IPCA-EM-ISVM: incremental principal component analysis–expectation–maximization–incremental support vector machine.
Conclusion and future work
In this article, we propose a new hybrid intelligent system for diabetes disease classification using machine learning techniques. We applied EM clustering algorithm to cluster the experimental diabetes disease dataset and SVM for classification of disease types. In addition, PCA was used for dimensionality reduction and to address multi-collinearity in the dataset. Furthermore, since new information is constantly available in medical datasets, it is desirable to incrementally update the trained models to reduce the computation time. The proposed method in this study at hand then supports incremental updates that were more efficient in memory requirement. In order to analyze the effectiveness of the proposed method and validate the system, several experiments were conducted on PID. The dataset was taken from Data Mining Repository of the UCI. The results indicated that the method which combines clustering, IPCA and ISVM obtains good classification accuracy and significantly reduces the computation time in relation to the non-incremental methods. All of the approaches used in this study may also be applicable to other classification problems within the medical domain. However, there is still plenty of work in conducting researches on incremental algorithms for disease diagnosis in order to exploit all their potential and usefulness. In the future work, more attention should be paid to the datasets for disease classification and prediction using the incremental machine learning approaches. Hence, in our future study, we plan to evaluate the proposed method on additional datasets and in particular on large datasets to show the effectiveness of the incremental methods on computation time of large data in relation to the non-incremental ones.
Footnotes
Data availability
The actual data itself are obtained by the author of this research from the website of the UCI (University of California, Irvine).
Declaration of conflicting interests
The author(s) declared no potential conflicts of interest with respect to the research, authorship and/or publication of this article.
Funding
The author(s) disclosed receipt of the following financial support for the research, authorship, and/or publication of this article: The authors would like to thank the Research Management Center (RMC) at Universiti Teknologi Malaysia (UTM) for supporting and funding this research under the Post-Doctoral Fellowship Scheme Grant (Vote no. Q.J130000.21A2.03E26) and the UTM-GUP Research Grant (Vote no. Q.J130000.2506.13H49).