
Abstract
Porters play an important role in supporting hospital operations. Their responsibilities include transporting patients and medical equipment between wards and departments. They also need to deliver specimens, drugs, and patients’ notes to the correct place at the right time. Therefore, maintaining a trustworthy and reliable porter team is crucial for hospitals to ensure the quality of patient care and smooth the flow of daily operations. However, most existing porter systems lack detailed information about the porter movement process. For example, the location of porters is not transparent to the dispatch center. Thus, the dispatcher does not know if porters are spending all their time providing services. The invisibility makes it difficult for hospitals to assess and improve the efficiency of porter operations. In this work, we first developed an indoor location-based porter management system (LOPS) on top of the infrastructure of indoor positioning services in the hospital National Taiwan University Hospital YunLin Branch. The LOPS provides real-time location information of porters for the dispatcher to prioritize tasks and manage assignments. We then conducted a 5-month field trial to collect porters’ traces. Finally, a series of quantitative analyses were performed to assess the efficiency of porter operations, such as the movement distribution of porters in different time periods and areas, workload distribution among porters, and possible bottlenecks of delivering services. Based on the analysis results, recommendations were given to improve the efficiency of the porter team.
Keywords
Introduction
Hospital porters play an important role in supporting the daily operations of hospitals. Their major responsibility is to transport patients to and from different places, such as from a ward to an X-ray room. They also deliver specimens, drugs, and patients’ notes to the correct place at the right time. On some occasions, hospital porters are also called support services assistants or patient services assistants. A porter service is typically requested by a ward or a department. The request is then followed by job dispatch, service delivery and completion confirmation. 1 The porter team has to ensure a smooth and well-coordinated delivery process for patients. For example, when a patient needs an X-ray examination, a ward nurse will send a request for transportation to the dispatch center via phone or an online booking system. After receiving the request, the dispatcher of the dispatch center will assign the job to a porter based on information about every porter’s location, availability, current workloads and so on. Once the porter accepts the job, he or she should go to the ward to move the patient to the X-ray room on time. After the X-ray is taken, the porter needs to move the patient back to the ward and then inform the dispatcher that the job is completed. This example illustrates how important it is to have a trusted and reliable porter team so that a high quality of patient care can be ensured.
Several porter management systems have been proposed to coordinate porter services in hospitals. Arnvør á Torkilsheyggi et al. implemented a mechanism of two-way communication for nurses and porters to share information about pending patient transport. 2 However, the locations of porters were not considered in the coordination activities. Allan Stisen et al. developed a mobile application for porter task management, in which the location of porters was considered. Three different wearable devices were used to compare their applicability in supporting hospital service work. 3 Claus Bossen et al. studied the increase in visibility, awareness, and influence of porters after the task management system was upgraded from a manually operated system to a computer-supported system. 4 Although the location information of porters has been used in coordinating the porter services in these works,3,4 it is unclear how indoor positioning data were collected, processed, stored and distributed. In addition, how the tracking data of porters can be utilized to assess the efficiency of porter operations has yet to be investigated.
In this paper, we present an indoor location-based porter management system (LPOS), which is built on top of the indoor positioning system of the hospital National Taiwan University Hospital YunLin Branch. The LPOS serves three different user roles: nurses, the dispatcher and porters. A web interface is provided for nurses to request porter services, track the progress of the service, and monitor the location of designated porters. Additionally, real-time information about porters’ locations is provided for the dispatcher to prioritize tasks and manage assignments. Furthermore, a mobile application is developed for porters to receive and confirm new tasks and report their status. The major contributions of this work are described as follows. (1) An indoor location-based hospital porter management system (LOPS) that provides real-time locations of porters for everyone involved in the process, including nurses, medical staff, the dispatcher and porters. LOPS makes the status of porter services visible to the hospital, such as the availability of porters, the waiting time for pending tasks and the starting time of running tasks. With the support of LOPS, the dispatch center can allocate tasks among porters to improve productivity and patient care. Additionally, the movement of the porters is automatically stored in a database for performance evaluation. (2) A series of quantitative analyses were conducted to explore the movement behavior of porters and assess the efficiency of porter operations. First, trace information was used to evaluate the workload of porters from different perspectives, such as gender, age, seniority, shift and department. Second, the movement distribution of porters in different time periods was investigated to understand the peaks in demand. Third, hot spot areas of the hospital where porters visited most often or spent most of their time were also determined to find possible bottlenecks. The analysis results suggest that a different dispatch policy, such as dynamic porter allocation, during peak times is needed to further smooth porter services. Additionally, more employee training is required to align the skills of porters and balance their workloads.
Related work
Performance access and scheduling policies
Odegaard, F. et al. conducted a 7-month study of porter operations at Vancouver General Hospital. 5 They first found that the porter system capacity did not match hourly demand patterns and then provided several recommendations for improving porter management, such as better communication between different departments, a more accurate database, a proper shift schedule to match demands, and so on. Sean Brown 6 investigated several key indices that can be used to evaluate the efficiency of patient transportation in a hospital, such as the proportion of work done by porters, the waiting time for call acceptance, the time for task completion, and porter utilization. He also discussed two different types of porter system for assigning tasks to porters: push-type and pull-type. In a push-type porter system, tasks are dispatched by the porter center. On the contrary, in a pull-type porter system, porters can access the list of waiting tasks and select their next task. It was expected that a pull-type porter system could create more autonomy in the workplace to improve productivity and job satisfaction. However, the major problem with the pull-type porter system was that porters may select self-interest tasks first rather than urgent tasks. Therefore, more rigorous supervision is needed to make this type of system efficient.
C.K. Lin proposed a heuristic algorithm to generate a monthly roster for hospital porters. 7 The quality of the schedule is assessed by job satisfaction and employee equity. Unlike scheduling a monthly roster, in this work, we focus on the task-level dispatch that assigns a new incoming task to an available porter who is closest to the location of the origin unit. Odegaard, F. et al. 8 constructed a simulation model to investigate the effects of different scheduling policies on travel time, pick-up time, and so on. They also adopted a linear programming model to optimize the shift schedule so that the capacity of the porter system can match hourly demand patterns. Heydari et al. provided an overview of combined hospital planning problems. They developed an algorithm to optimize patient flow and porter operations, such as minimizing idle time of sources, maximizing satisfaction, maximizing the number of planned patients, and so on. 9 Our work and the above-mentioned methods are complementary to each other. These scheduling policies can be implemented as a third-party module and integrated with LOPS to adapt to different scenarios and requirements.
Information system for porter management
Joanna Abraham et al. conducted a field study of coordination between clinical and non-clinical staffs in a hospital. 10 Their results showed that efficient patient transfer required information sharing. Additionally, awareness of patient transfer goals and pre-notification of internal transfers could also affect the level of information sharing. Tornbjerg et al. investigated the collaboration between humans and robots in logistics tasks in the basement of a hospital. The robots could automate the delivery process and improve the working environment of hospital staff members. However, the research showed that the robots were not considered reliable enough for critical tasks such as transporting blood. 11 L. Chen et al. recommended the development of a porter system to identify and collect timestamps in the porter movement process. They claimed that these timestamps could be used to monitor porter performance and identify where bottlenecks occur. 12 However, how the tracking data of porters can be utilized to assess the efficiency of porter operations has yet to be investigated.
Some researchers took porters’ locations into account when designing a porter management system. Allan Stisen et al. developed a mobile application for porter task management, in which the location of porters was considered. Three different wearable devices were used to compare them with handheld devices in the applicability of supporting hospital service work. 3 Claus Bossen et al. studied the increase in visibility, awareness, and influence of porters after the porter management system was upgraded from a manually operated system to a computer-supported system. 4 Didi Surian et al. adopted Bluetooth beacons to track a moving user in an indoor environment. 13 Their results showed that an RNSI (received number of signals indicator)-based method could be useful to track a moving user without involving complex calibration. Their method could be used together with other methods to further improve the accuracy of indoor positioning. Although the location information of porters has been used in coordinating the porter services in the above-mentioned works,3,4 it is unclear how indoor positioning data were collected, processed, stored and distributed.
To the best of our knowledge, this is the first work that realized a location-based porter management system which makes porter operations transparent to the dispatch center. Additionally, a field trial was conducted to collect daily operations of porter services in a hospital. Furthermore, a series of quantitative analyses revealed important aspects of the delivery process, including workload, efficiency, hotspots, peak time, delay time and working time. Finally, recommendations based on the analysis results were given to improve the efficiency of the porter team.
Indoor location-based porter management system (LOPS)
Indoor object tracking system
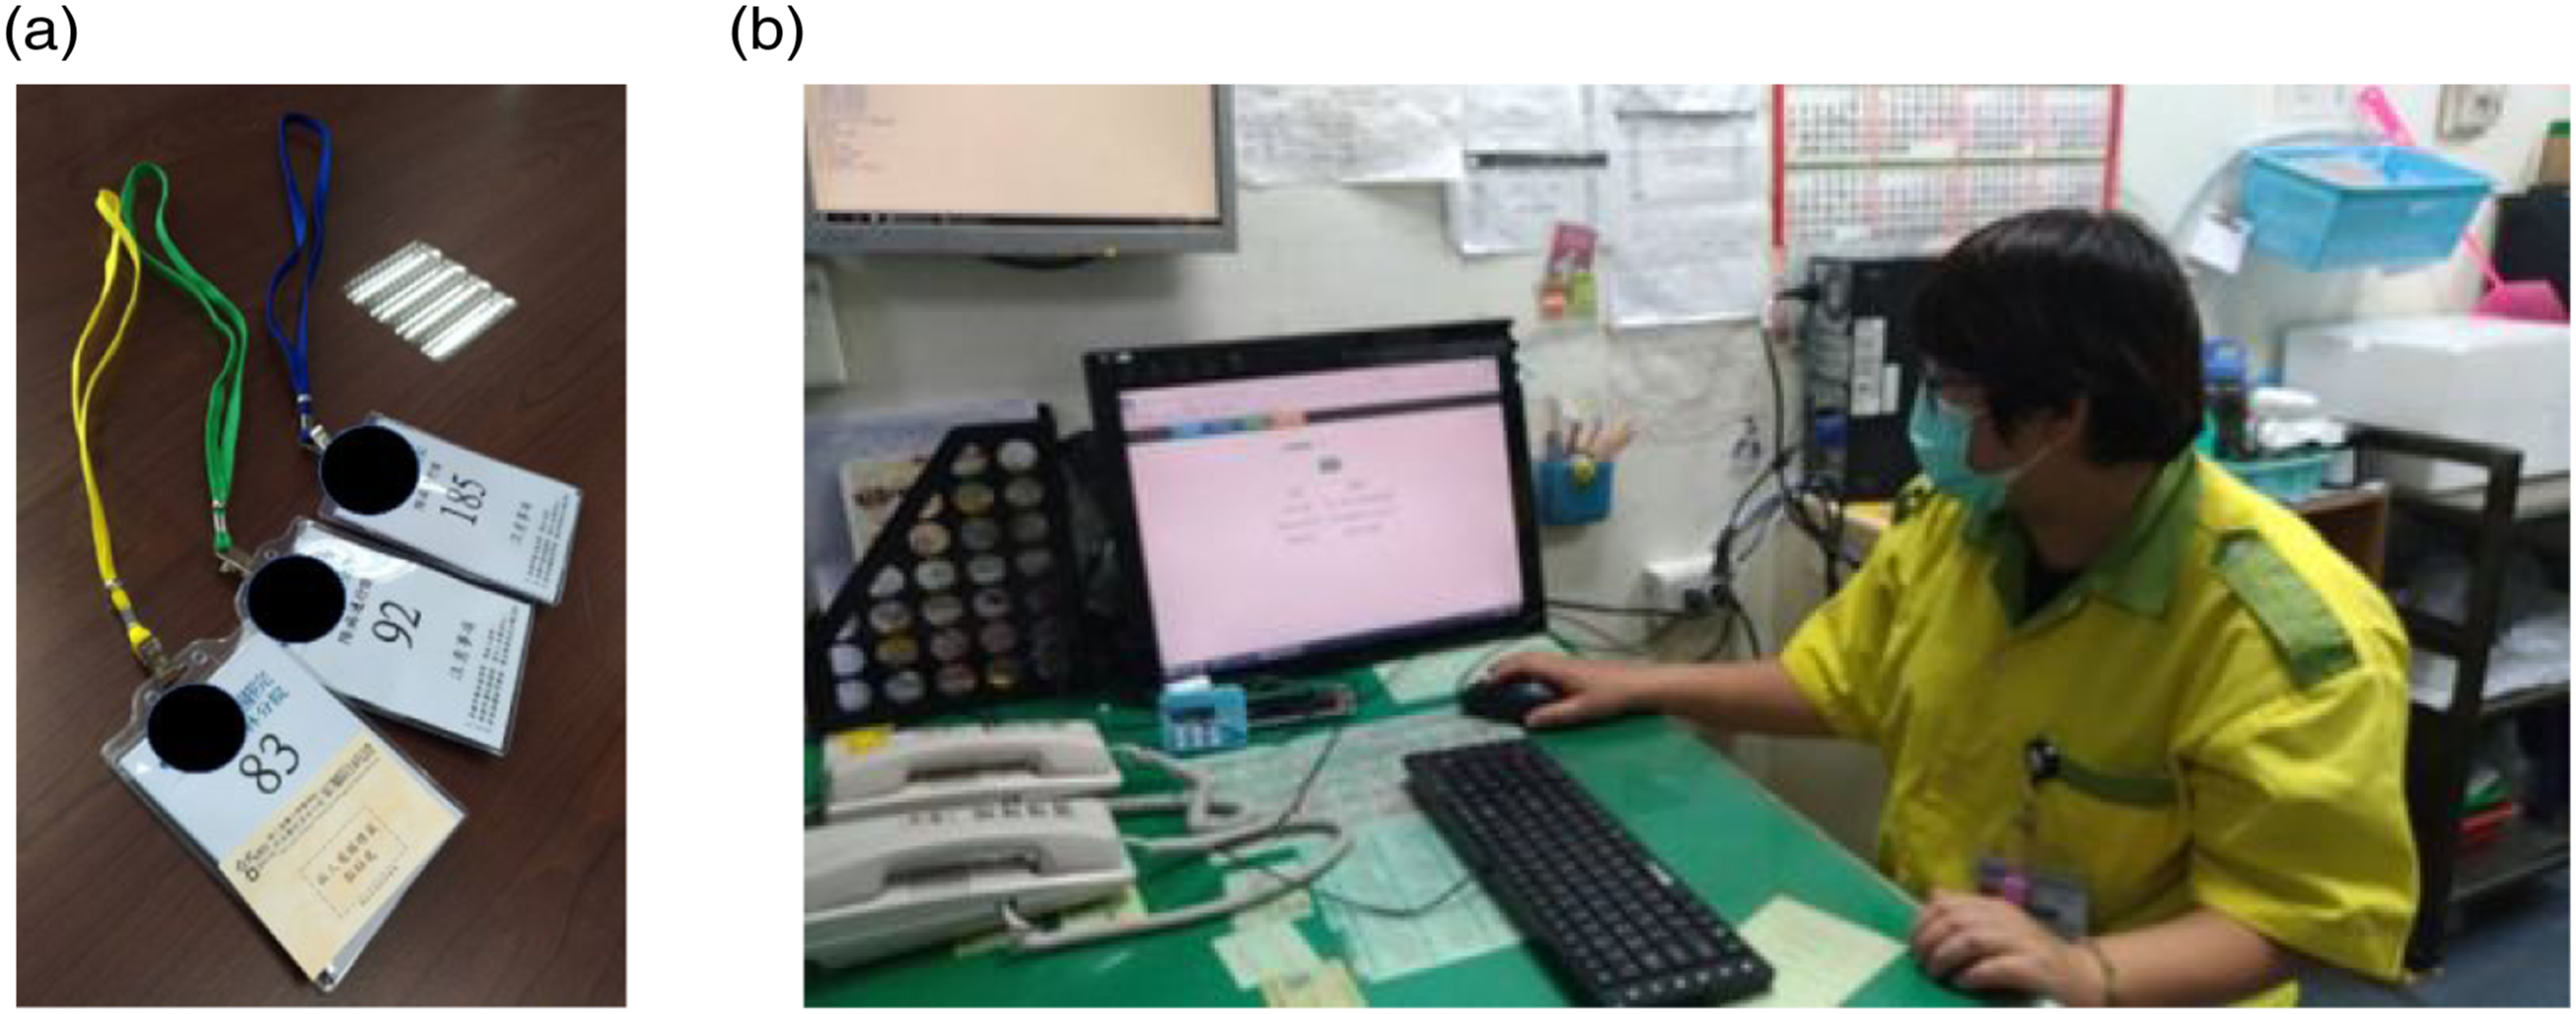
A Bluetooth-based object tracking system was adopted to track objects inside the hospital. As shown in Figure 1, Bluetooth readers were hung on walls to scan and locate Bluetooth devices within a range of 10–15 m. The collected device IDs and the value of RSSI (Received Signal Strength Indicator) were sent back to a remote server where each device’s location was determined. In order to track the movement of porters, their badges were embedded with a Bluetooth tag, as shown in Figure 2. Whenever a porter walks inside the hospital, he or she will be tracked by the object tracking system. The positioning accuracy is at the zone level, in which a zone can be a ward or a point of interest, such as a blood collection counter, a main entrance, a nurse station, and so on. For readers who are interested in the technical details of the object tracking system, please refer to our previous work.
14
Bluetooth readers were hung on walls to scan Bluetooth tags nearby. Porters’ badges and a manger who was using the dispatch system to monitor the location of porters.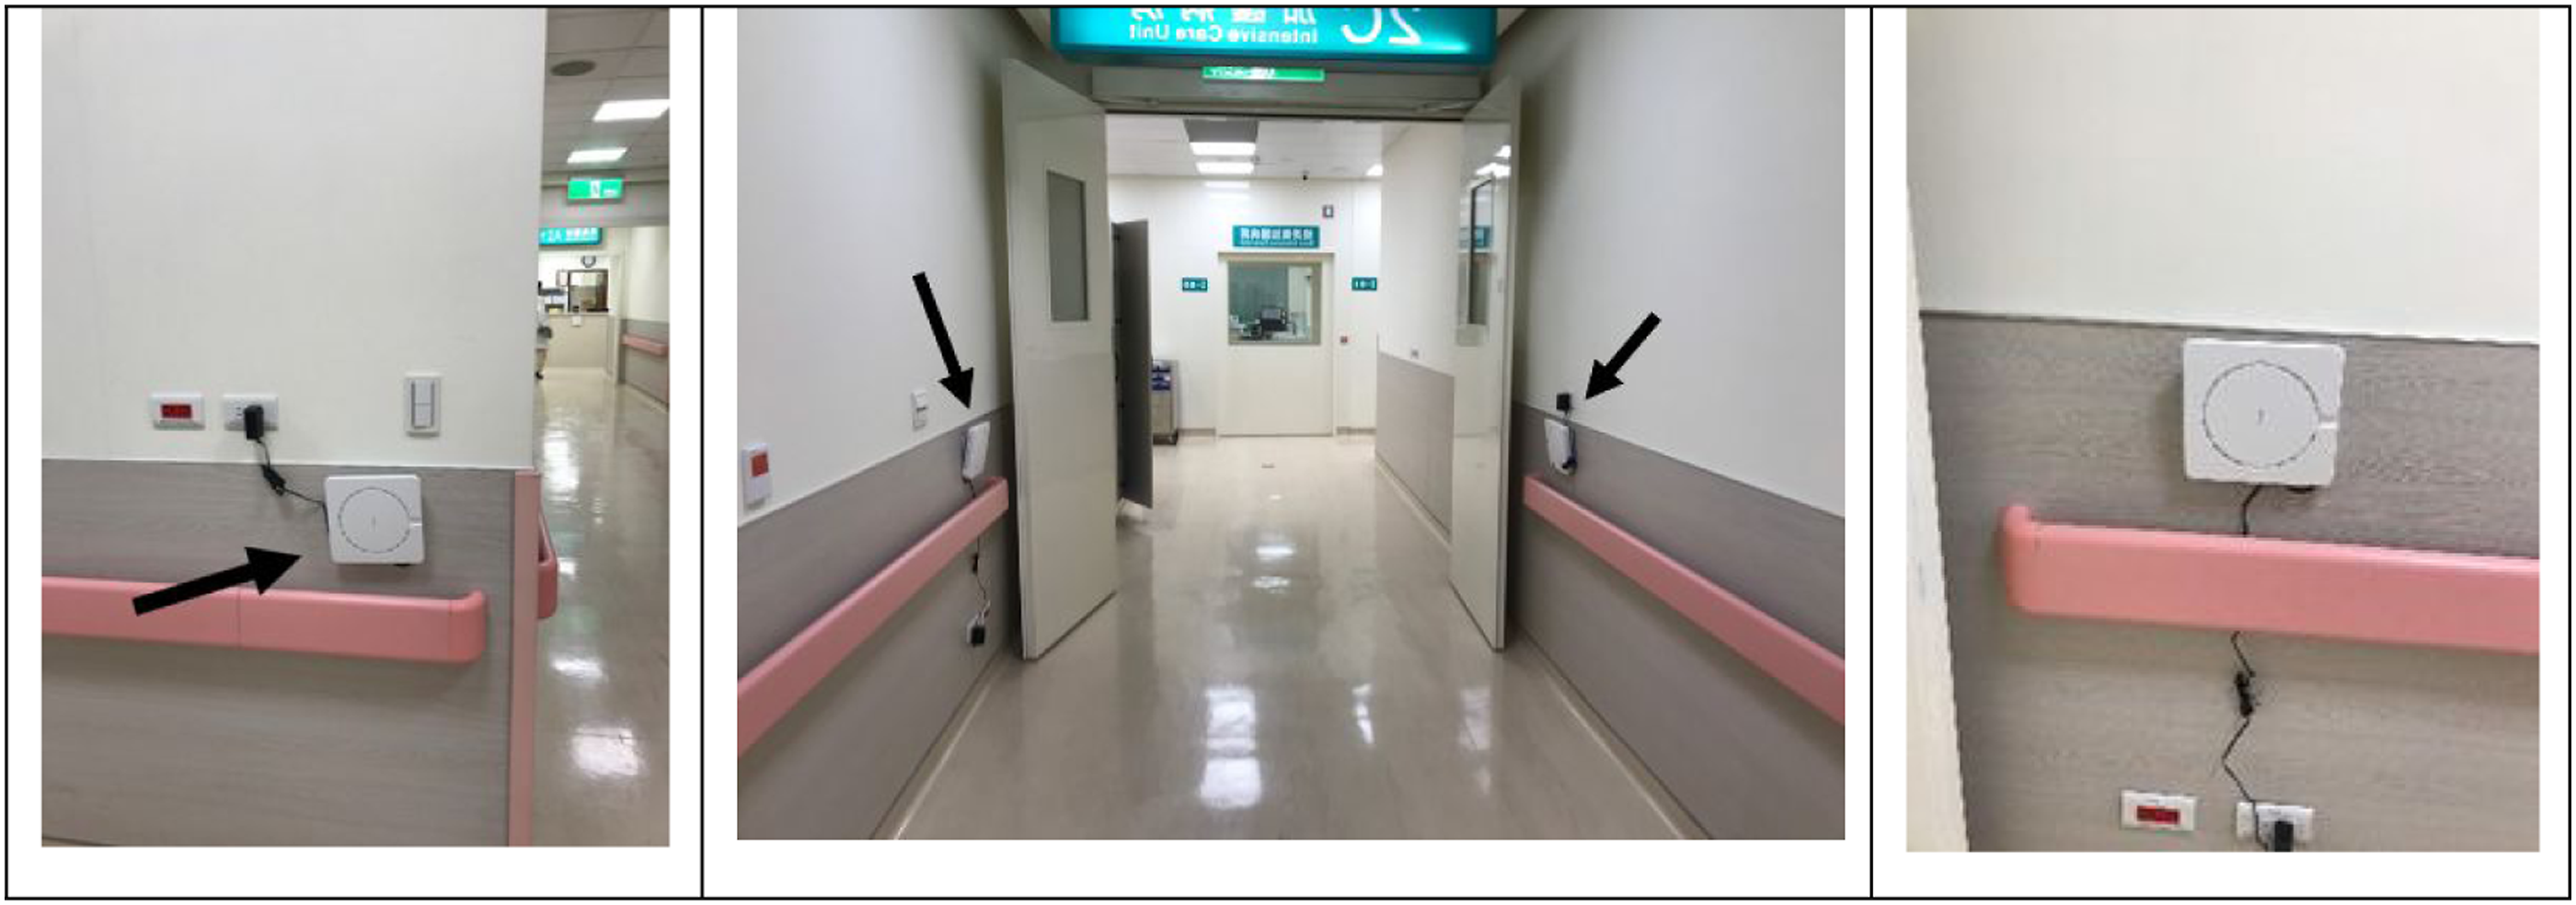
The architecture and user interface of LOPS
The LOPS comprises two major software components: a dispatch module and a database. As illustrated in Figure 3, when a ward requests porter service, the dispatch module first checks the status of each porter in the database, including their locations and current workloads (Step 1). The location information of each porter is provided by the indoor object tracking system. Based on this information, the LOPS selects an available porter who is closest to the original requester. Alternatively, the porter dispatch process can be manually operated by the manager in the porter center (Step 2). After a porter is selected, both the ward and the porter receive notifications from the LOPS (Step 3). Finally, when the porter completes the task, he or she informs the LOPS through a mobile app (Step 4). The architecture of LOPS.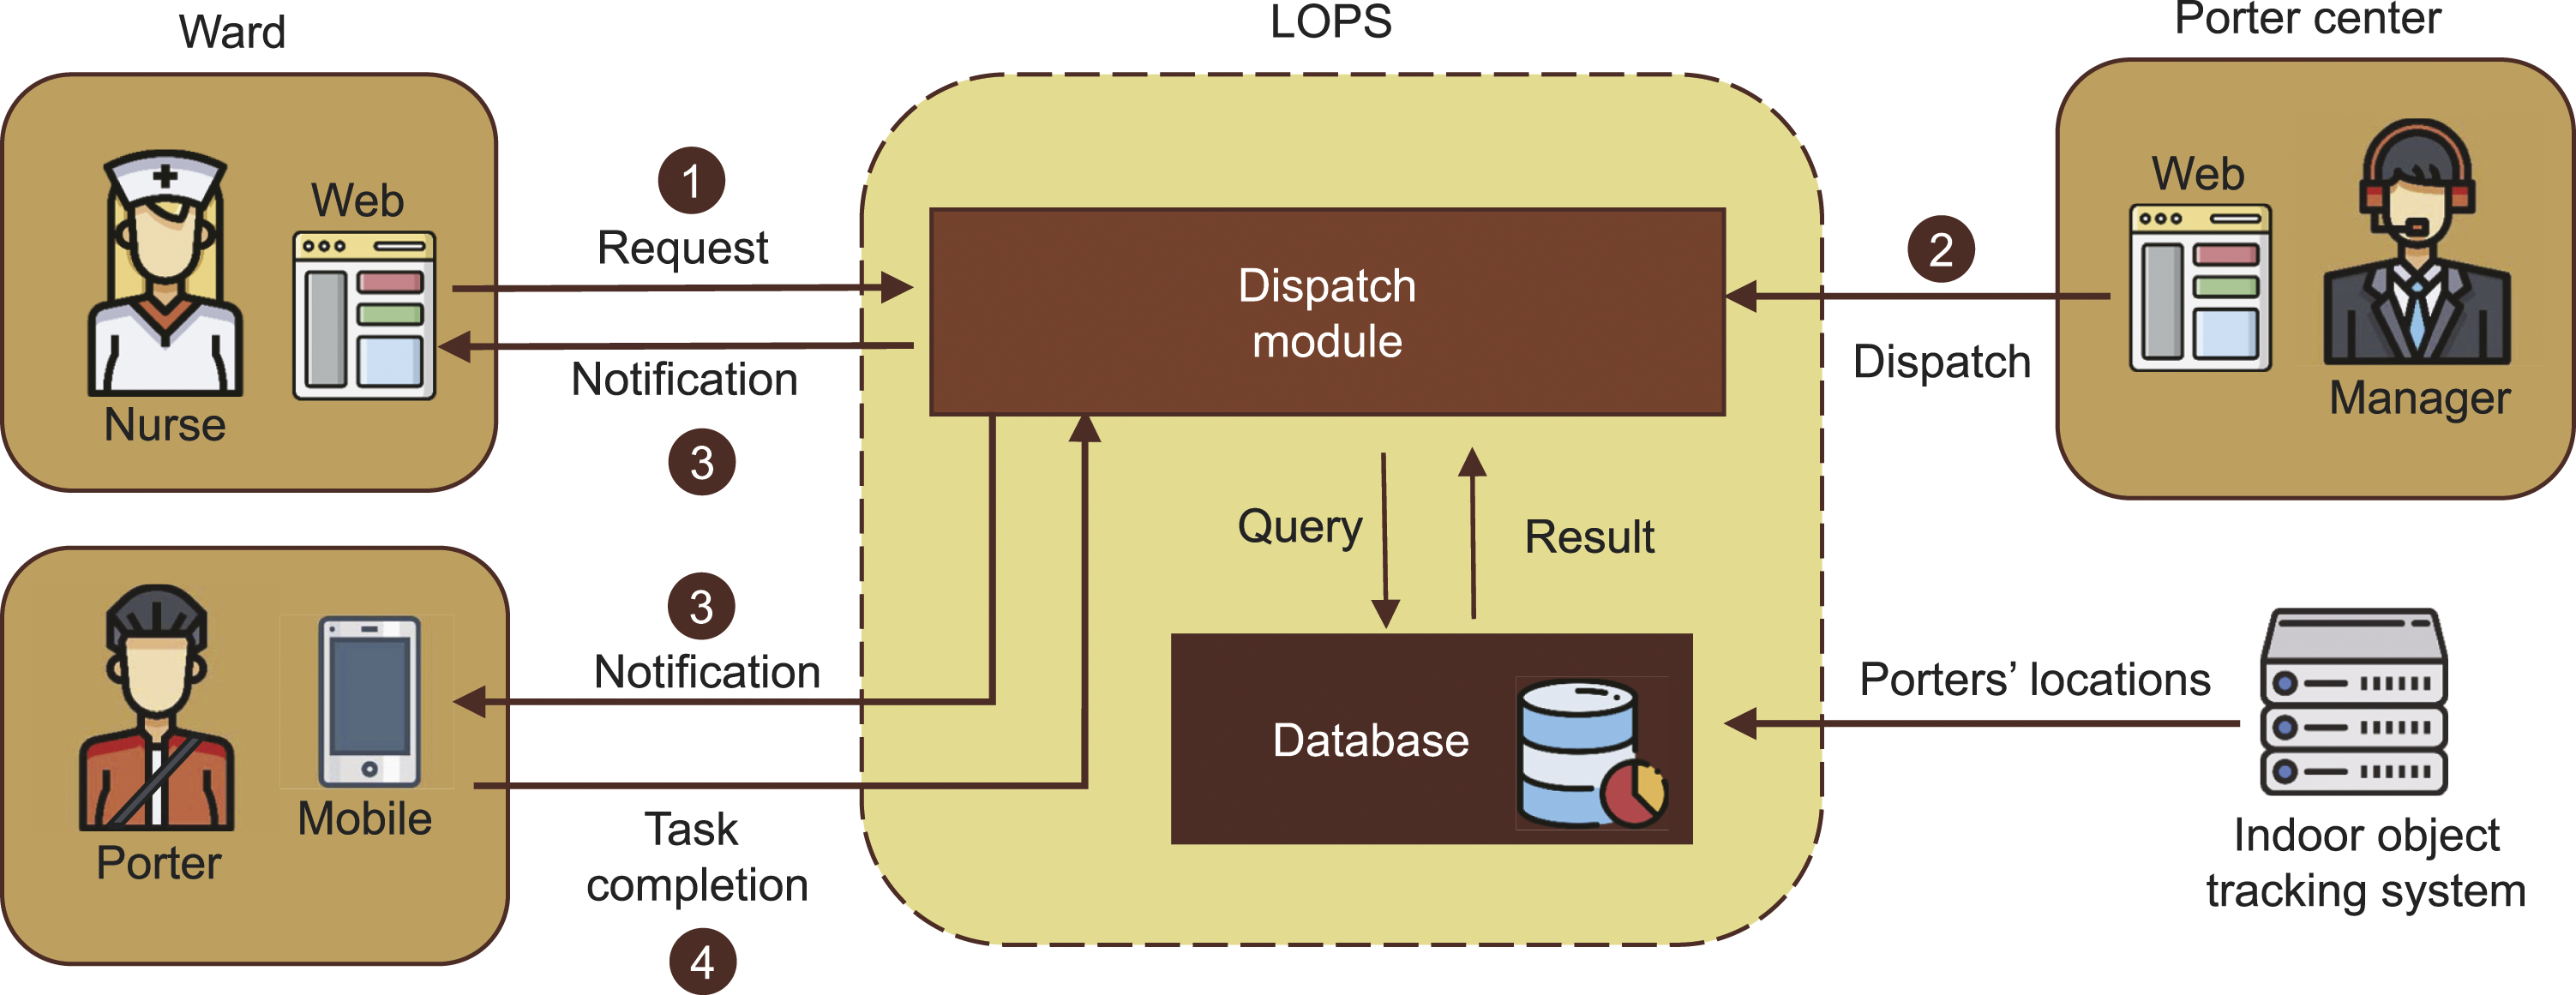
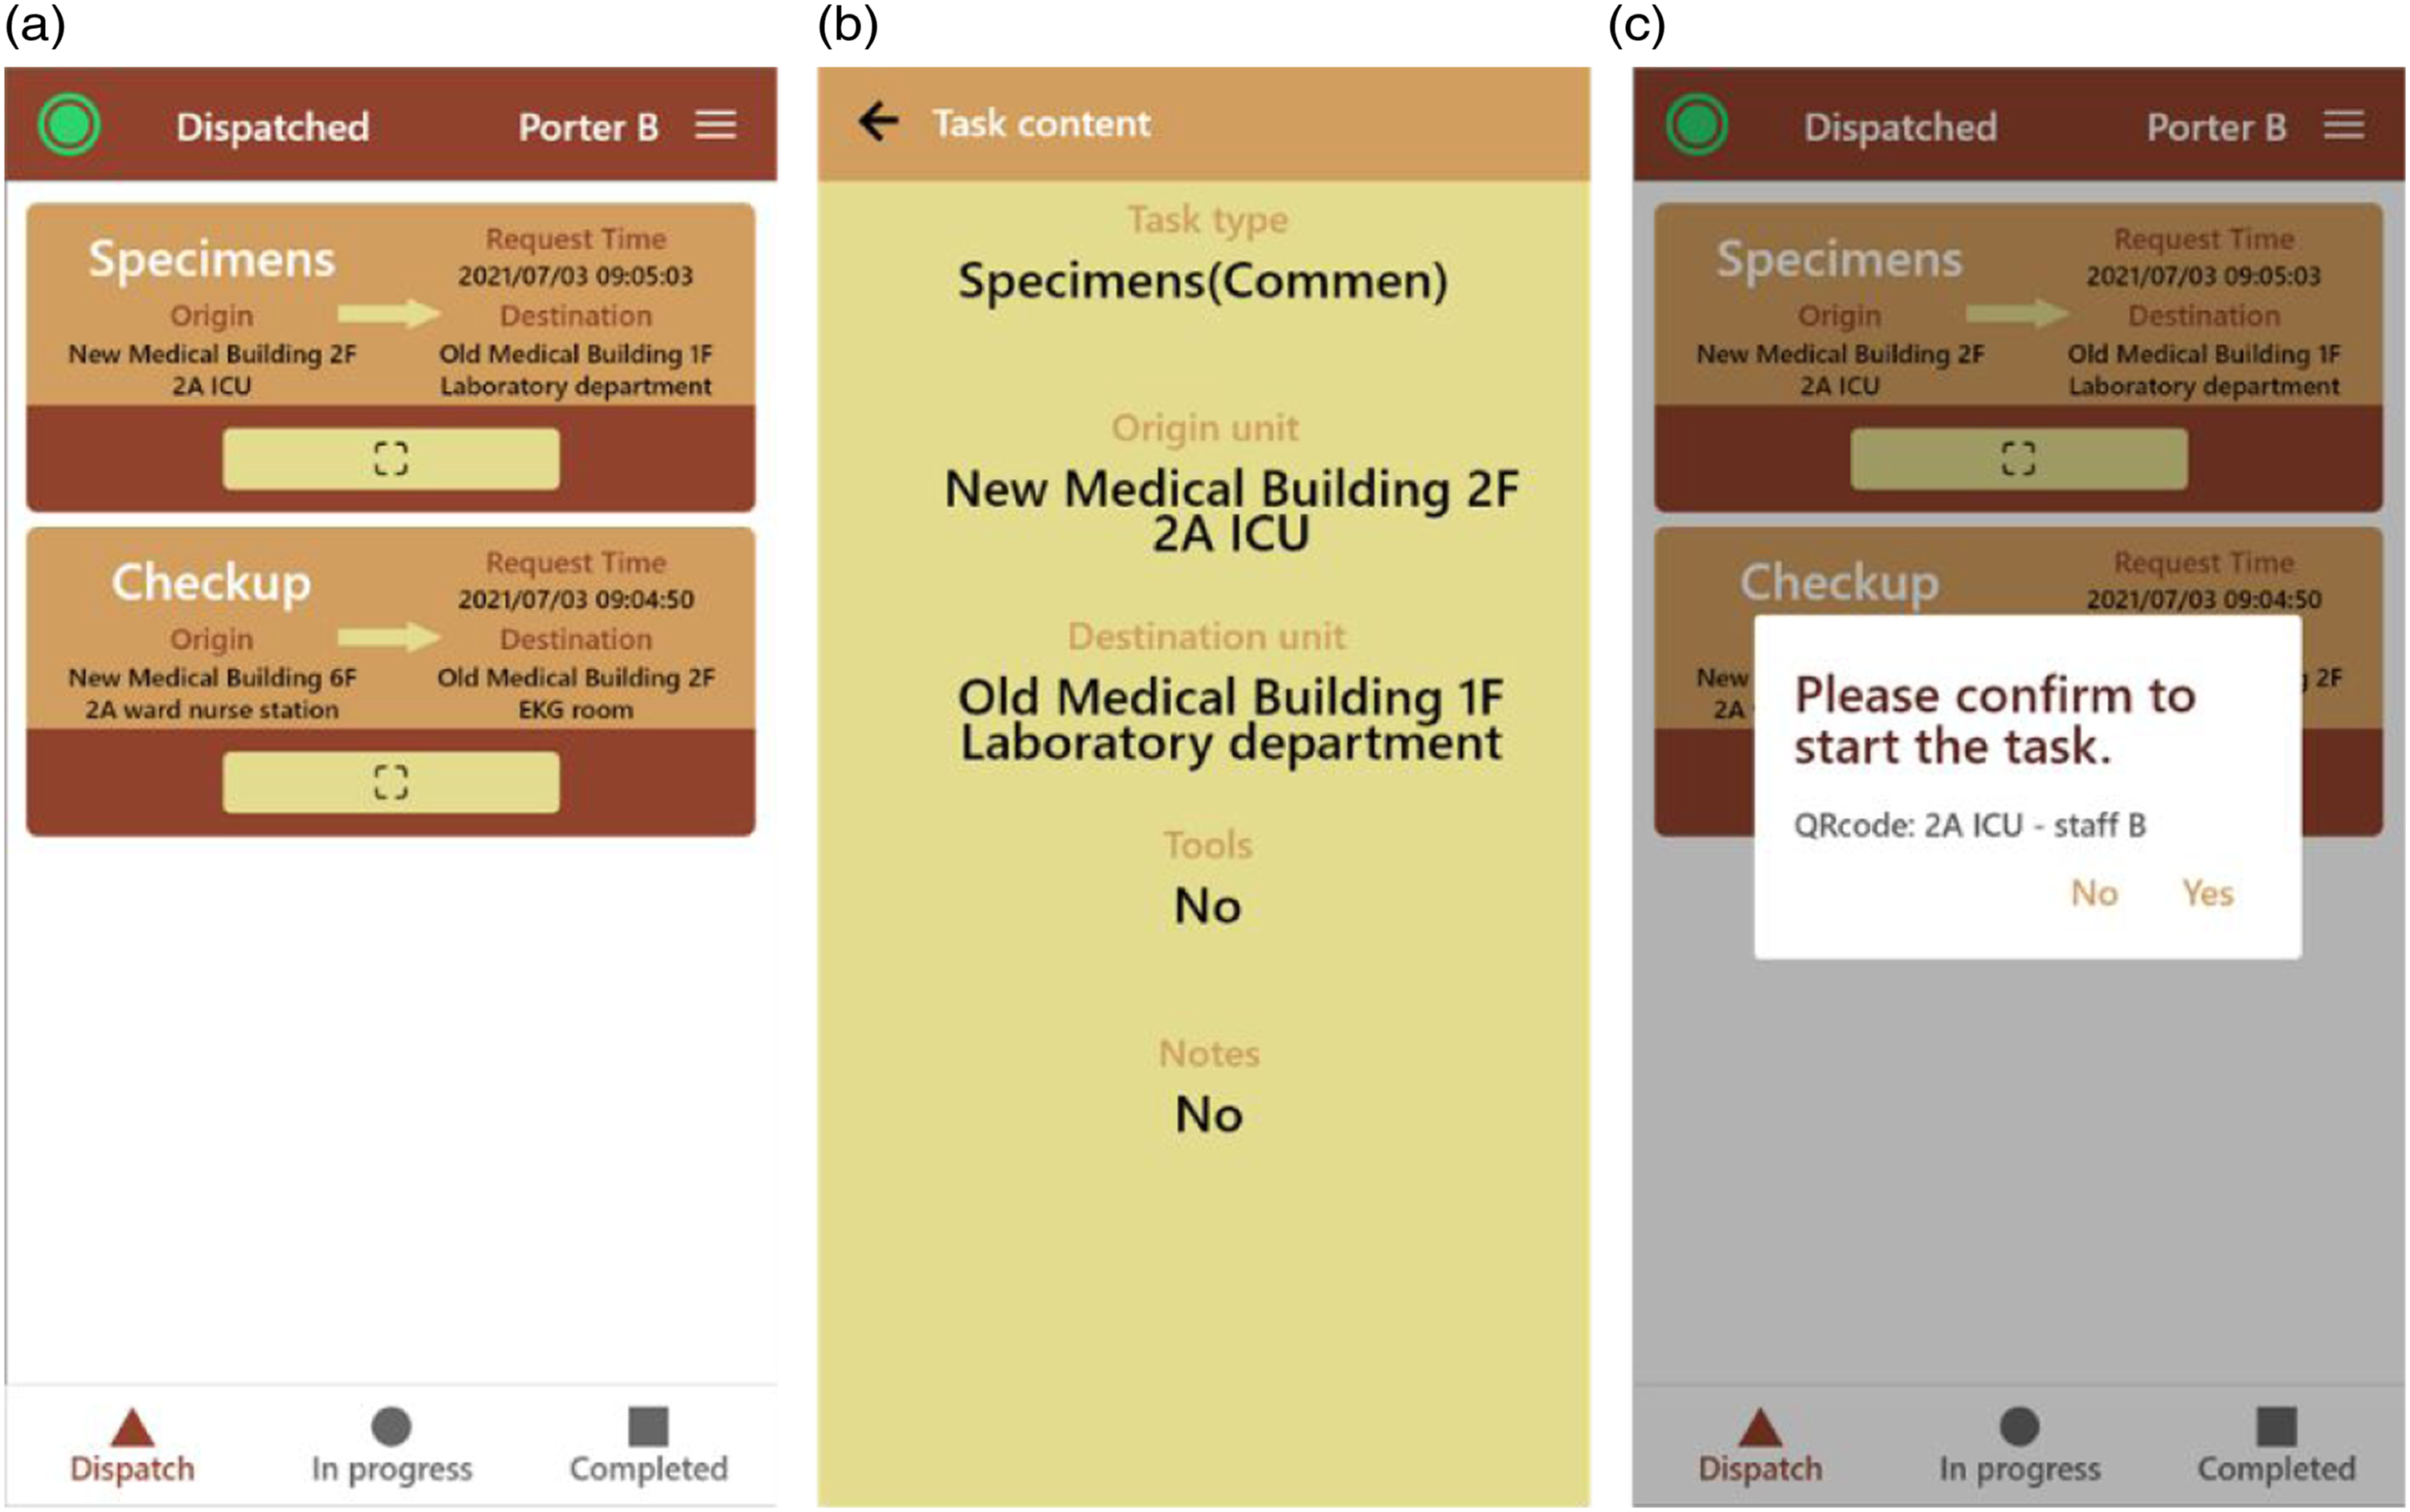
Figure 4 depicts the user interface (UI) of LOPS, which makes the porter process transparent to the porter center by displaying detailed information about each porter task. The task information includes the request time, task status, task type, origin unit, destination unit, porter name, and porter location. Necessary features are also provided for the manager to deal with the porter process, such as assigning a task to a porter, auto-assignment, adding a task, and refreshing the task list. Figure 5 shows the UIs of the porter application, including the list of assigned tasks (Figure 5(a)), detailed information about each task (Figure 5(b)), and the QR code scanner. The porter scans a QR code upon arrival at the origin of the assigned task or upon reaching the destination to notify the porter center. The UI of LOPS. The UI of porter app.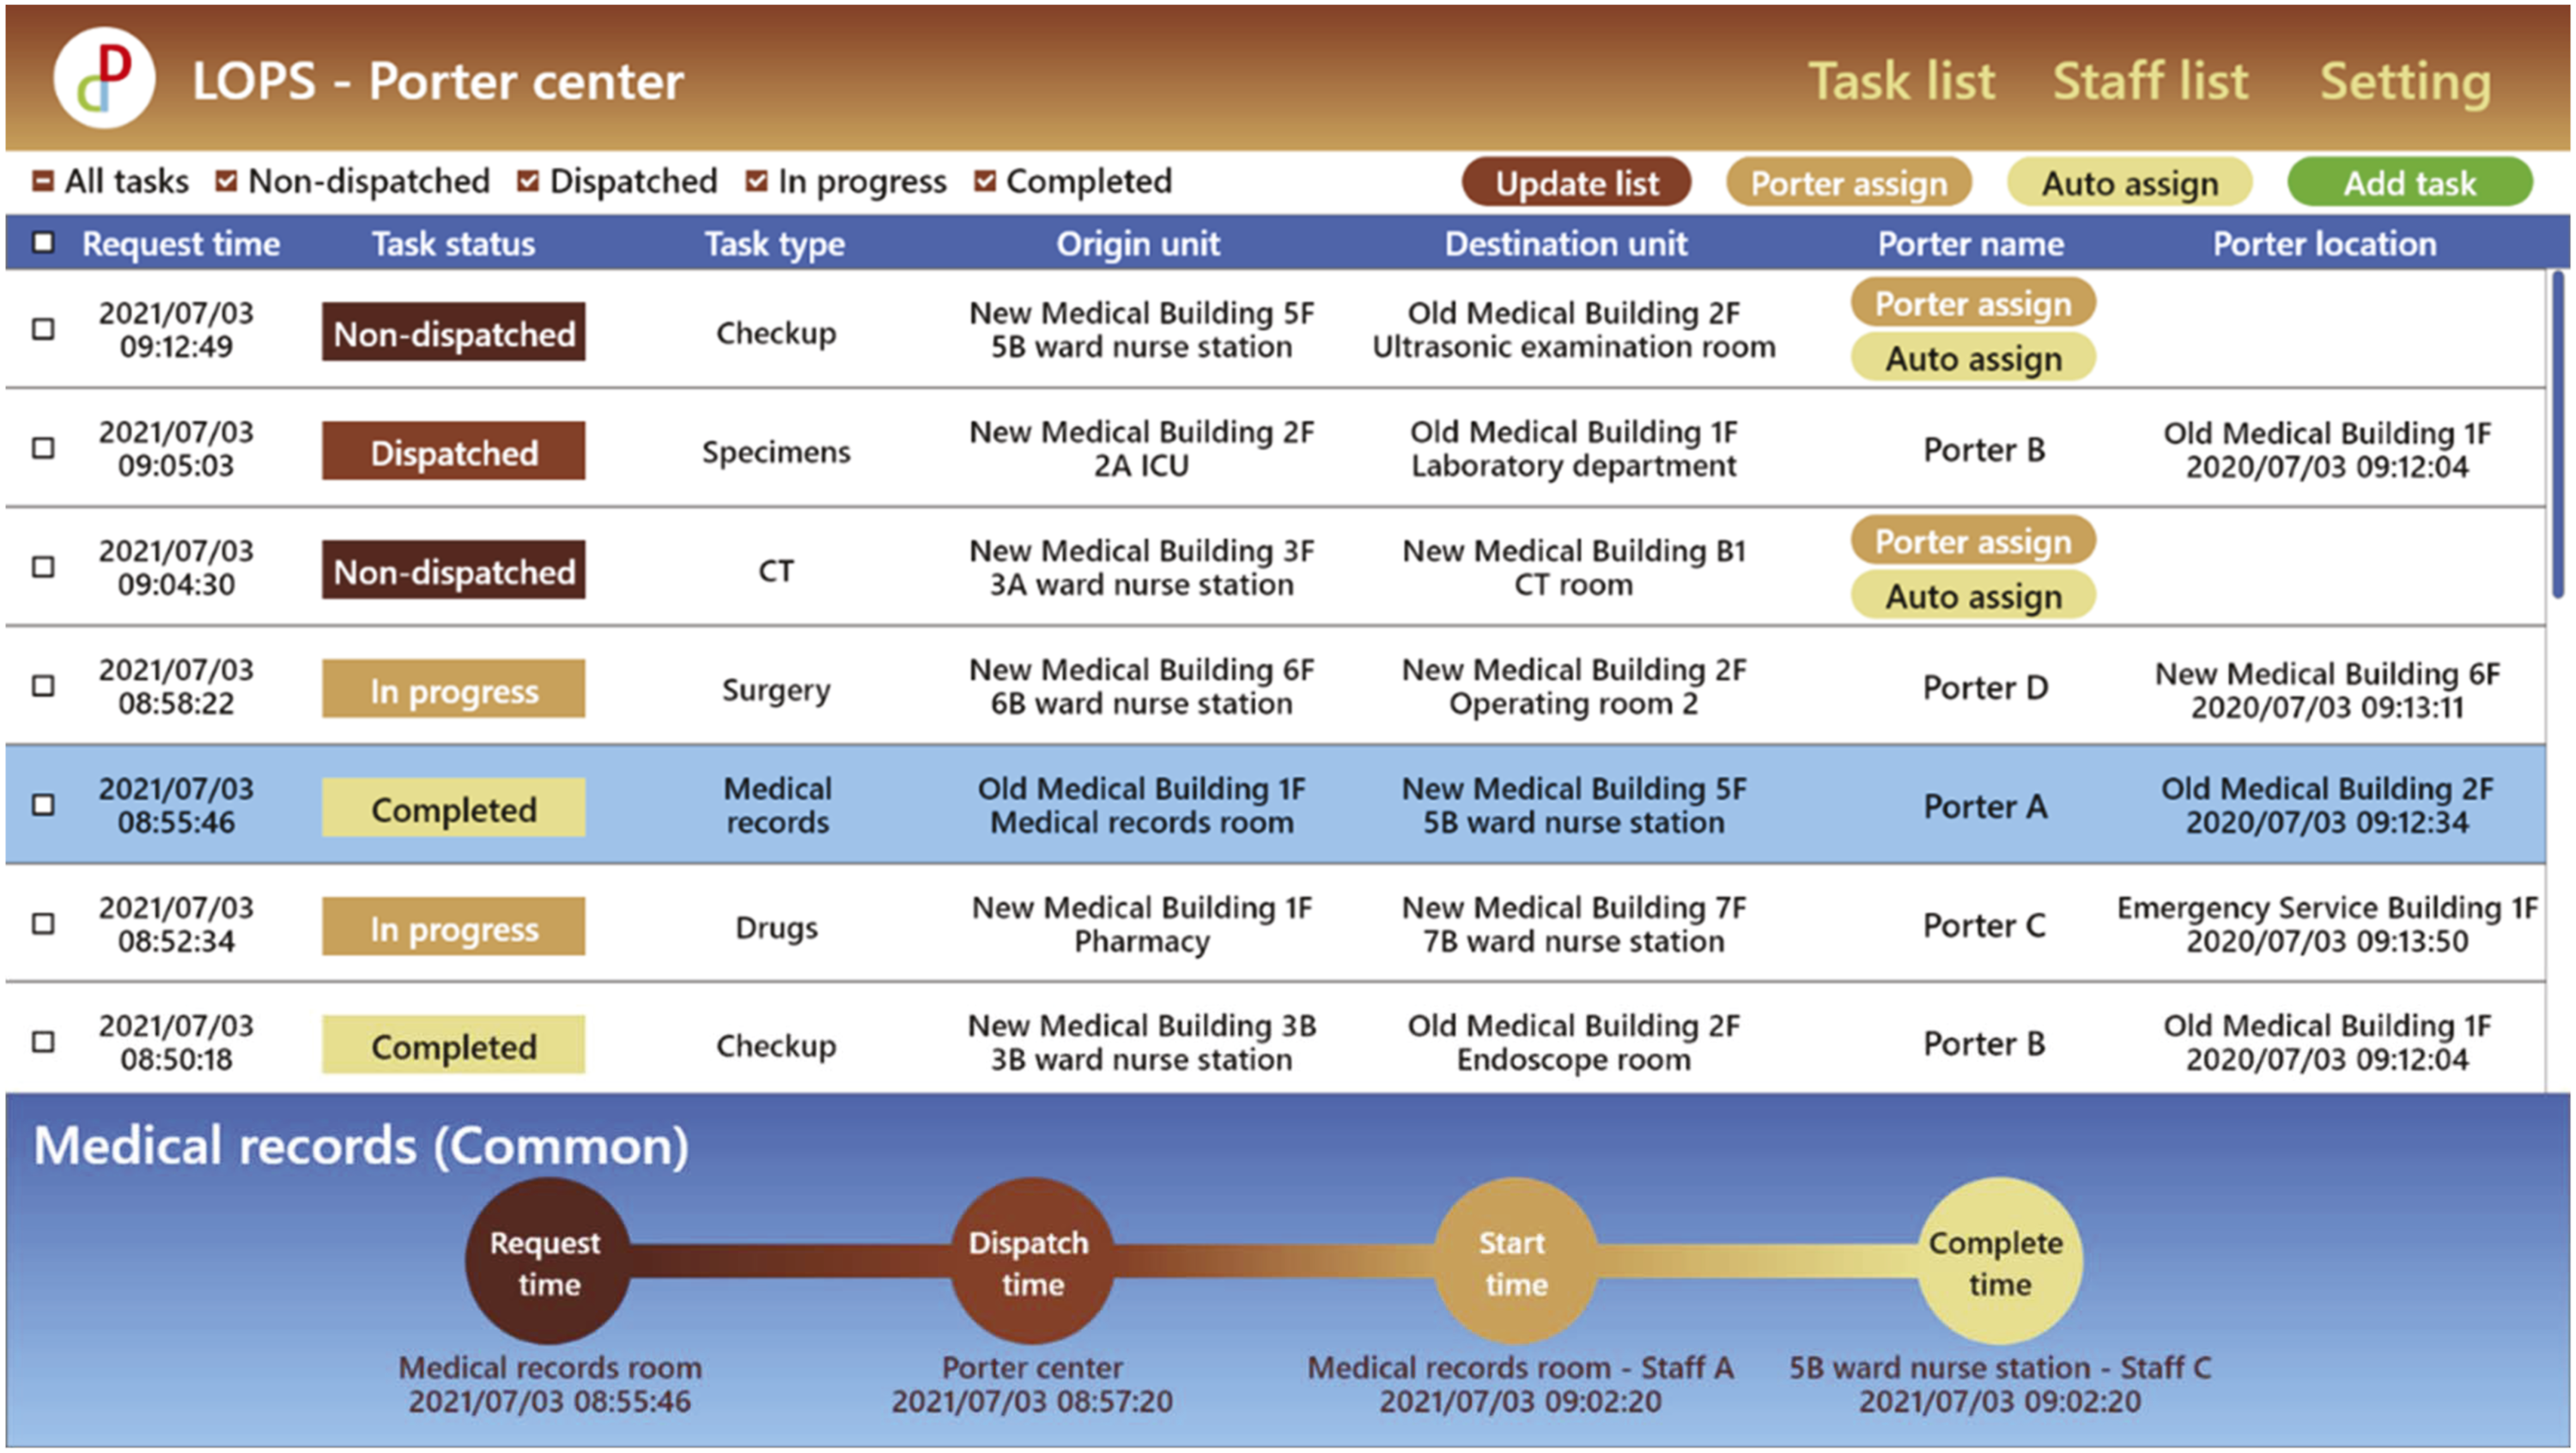
Indoor trace analysis of porter services
Factors that can affect porter services
Basic information of porters and samples.
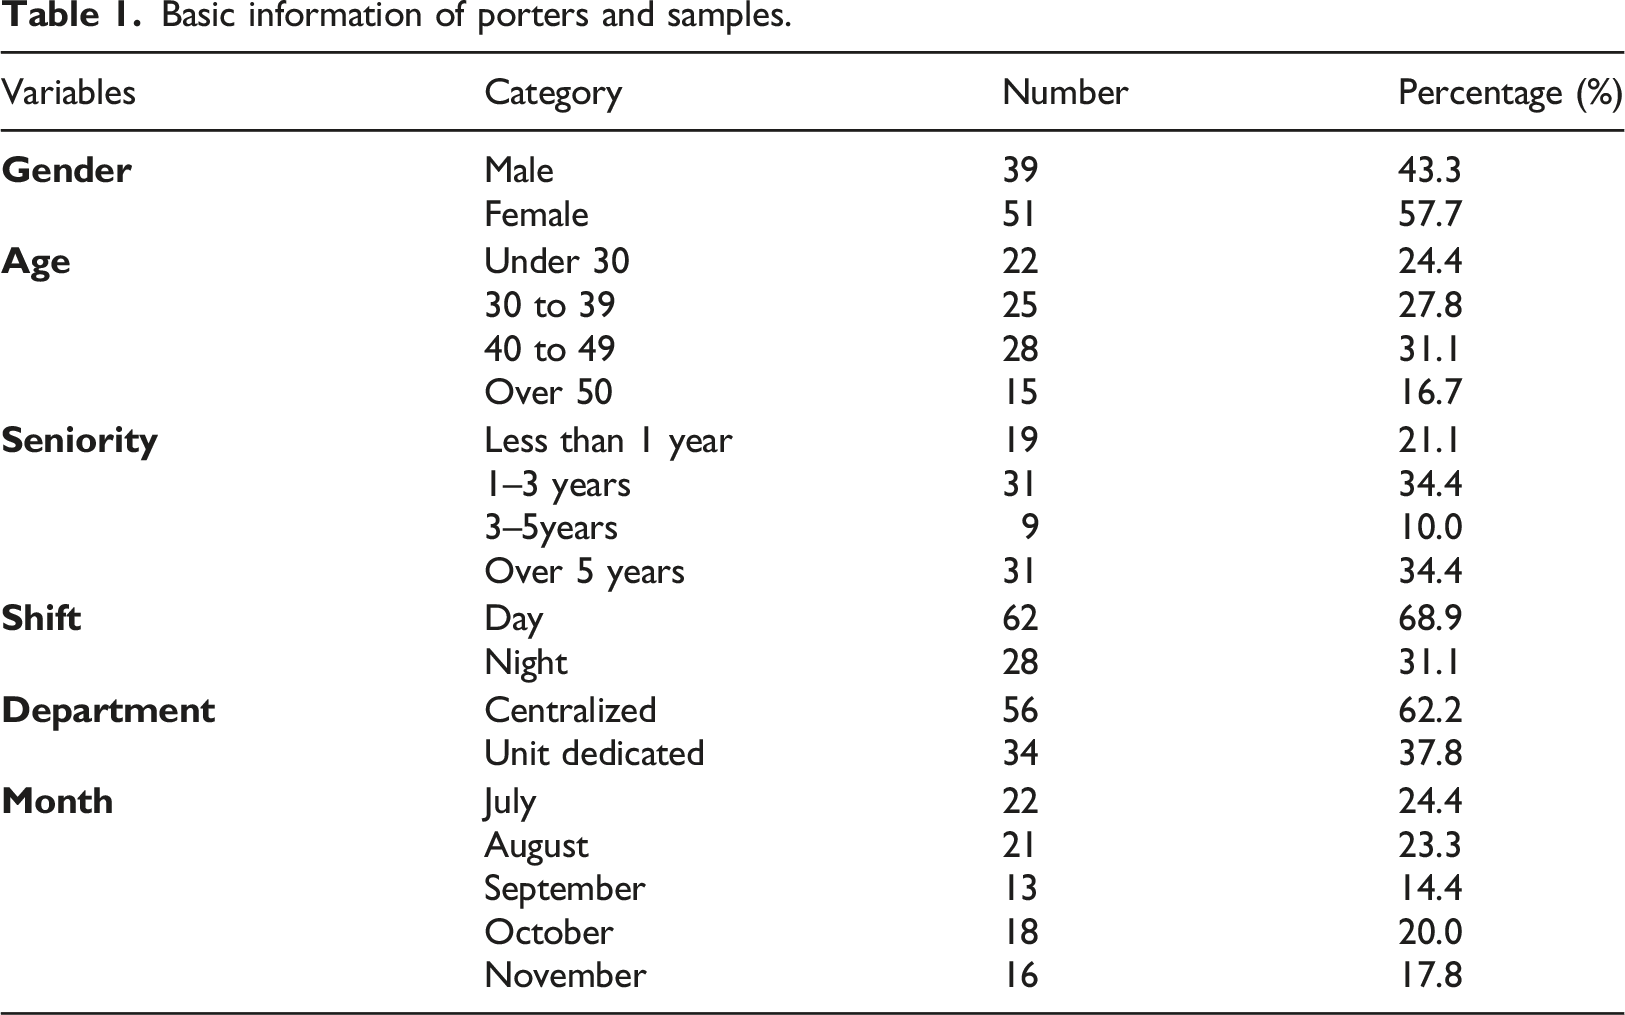
In this work, we use two factors to determine a porter’s workload: tracked time and the number of cross-zone movements. Let T denote the tracked time, which is defined as the time a porter stayed within the coverage of the indoor object tracking system. The T can be interpreted as the porter’s working time. The longer the porter was detected by the indoor object tracking system, the larger T was, and the busier the porter was. Additionally, we use Z to denote the number of cross-zone movements. As Table 1 shows, a zone can be a ward, a department, or a point of interest. The Z is used to represent the distance traveled by the porter. In other words, the larger the Z value, the longer the porter moved, and the busier the porter was.
In the following subsections, we first analyze whether personality plays an important role in porters’ workloads. We then investigate the number of cross-zone movements for different periods of time, such as daily, weekly, and monthly. Our aim is to identify hot zones, peak times, and possible bottlenecks of porter services by using indoor trace data of porters. Figure 6 shows the independent and dependent variables used for quantitative analysis. Porter tasks are classified into two types: patient transfer tasks and non-patient transfer tasks. Patient transfer tasks involve transferring patients between different areas or departments in the hospital, while non-patient transfer tasks include delivering specimens, drugs, and documents. The total task includes both patient transfer tasks and non-patient transfer tasks. Independent and dependent variables.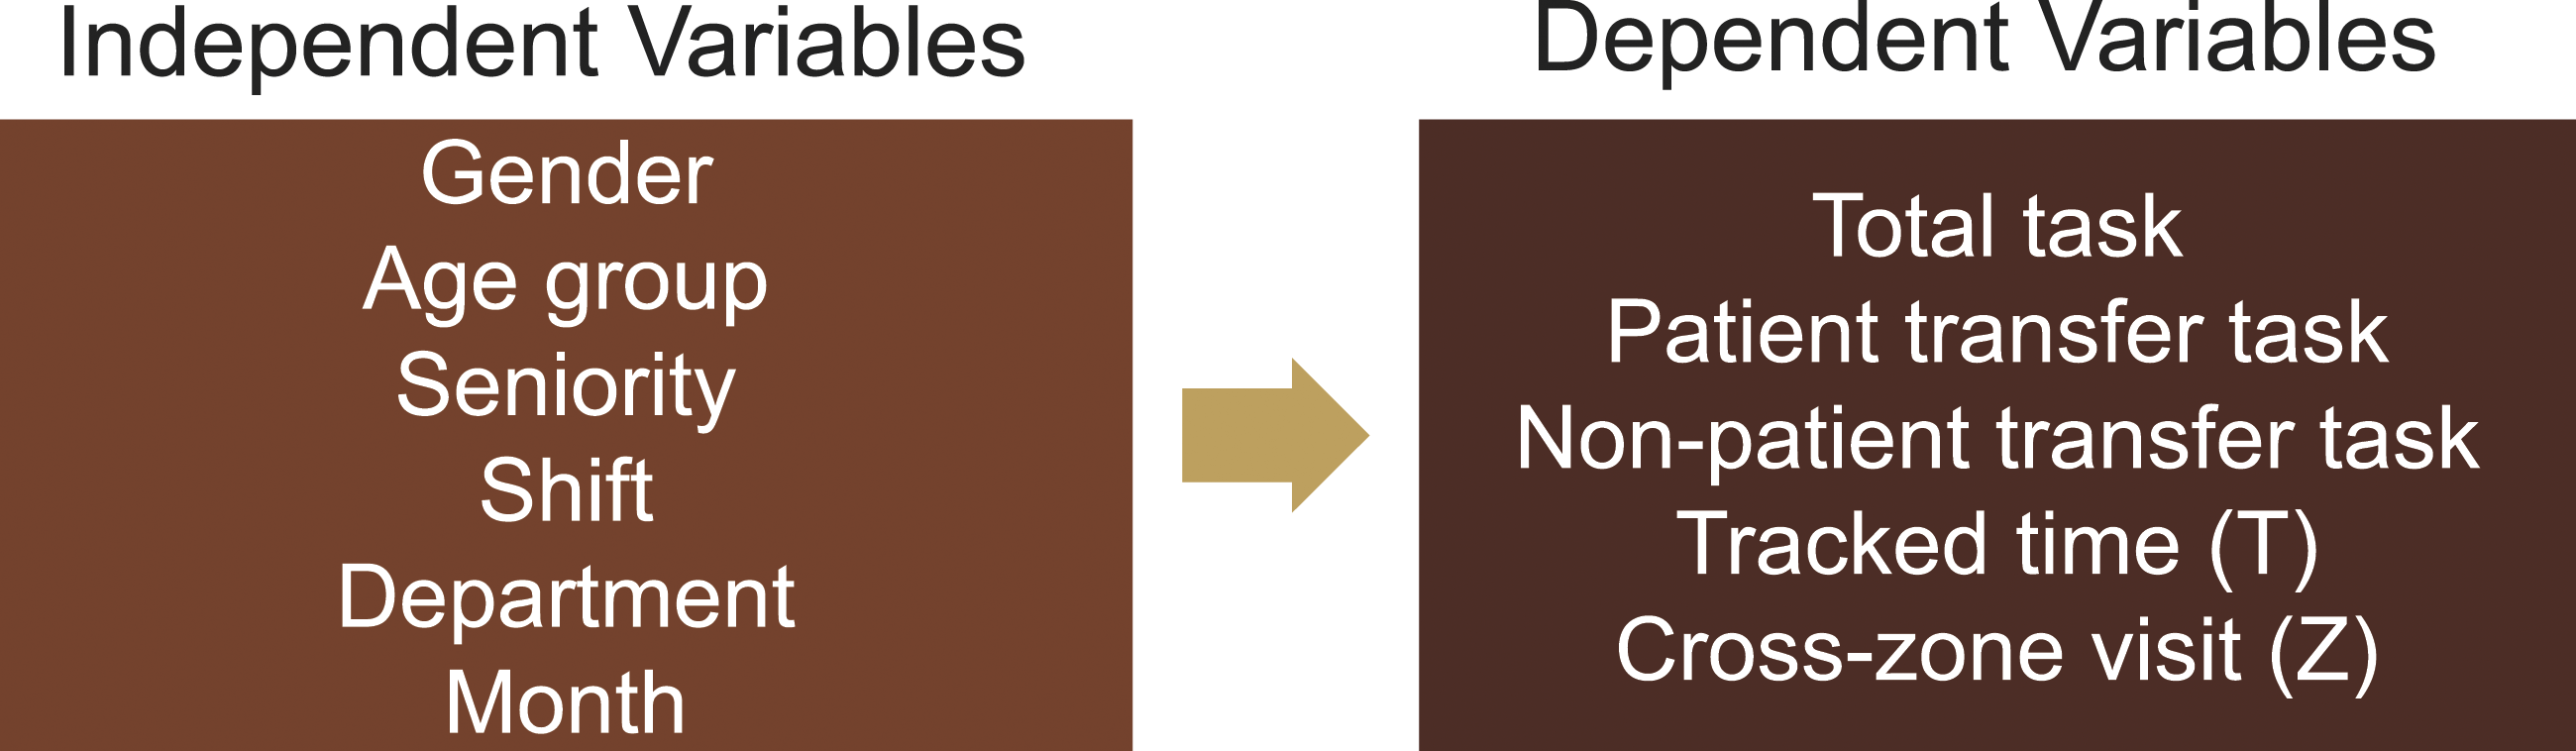
Factor analysis of the workload of porters
Gender
The independent samples t test is used to compare the means of male and female porters. The results show that there is no significant gender difference in the total task, patient transfer task and non-patient transfer task. However, the gender difference in T and Z is significant, meaning that the movement distance of male porters is longer than that of female porters. The statistical results imply that the workload of male porters may be greater than that of female porters.
Age group
The porters were categorized into four age groups: less than 30 years (group A), 30–39 years (group B), 40–49 years (group C) and greater than 50 years (group D). The one-way ANOVA (analysis of variance) test was used to compare the four age groups. The results show a significant difference in patient transfer tasks and cross-zone visits among the age groups. The number of patient transfers in group A is lower than that in groups B and C. The reason may be that porters between the ages of 30 and 49 were more familiar with the patient transfer process. Additionally, the number of cross-zone visits in group A is lower than in groups B and D. After checking the shift schedule, we found that most porters in group B were unit-dedicated porters who spent more time on standby in their own departments.
Seniority
The porters were categorized into four seniority levels: less than 1 year (group I), 1 – 3 years (group II), 3 – 5 years (group III) and greater than 5 years (group IV). There is a significant difference in patient transfer tasks and cross-zone visits among seniority levels. The number of patient transfers in group III is greater than that in groups I and II. The results indicate that senior staff were more likely to be assigned to transfer patients, especially for the porters with three to 5 years of work experience. Additionally, the number of cross-zone visits in group I is greater than that in groups II and III. This may be because junior porters were not as familiar with the process of different types of delivery services. As a result, they may select a less direct route to complete the services.
Shift
The independent samples t test was used to compare the means of day-shift porters and night-shift porters. The results show that there was no significant difference in the number of patient transfer tasks and cross-zone visits between the two groups. However, there was a significant difference in the total task, non-patient transfer task, and tracked time. The demands for non-patient transfer tasks were higher during the day shift, which was also the major task performed by the day-shift porters.
Department
The independent samples t test was also used to compare the means of centralized porters and unit-dedicated porters. The results showed no significant difference among all variables, including the total task, patient transfer task, non-patient transfer task, tracked time, and cross-zone visit. The results show that the workload among porters was balanced. However, the mean number of patient transfer tasks performed by unit-dedicated porters was higher than that of centralized porters. This may be because the departments of unit-dedicated porters, such as the emergency room and operating room, had a higher demand for patient transfer compared to other departments.
The movement analysis of porters
In this section, we first investigate the movements of porters to find out the hot zones of the hospital. We then analyze the number of cross-zone movement in different periods of time, such as daily, weekly and monthly, to discover peak times and possible bottlenecks in porter services.
Hot zones
Hospital porters are responsible for transferring patients, medical equipment, and patients’ notes between various areas in the hospital, making them a special group of people who move throughout the hospital. From the viewpoint of infection control, the areas that porters visit most frequently are the riskiest areas of the hospital, especially during the pandemic. In the new medical building of the hospital, the first floor serves as the outpatient area, the second floor is designated for operation rooms and intensive care units, while inpatient wards are located from the third floor to the seventh floor. In the old medical building, the examination rooms, such as endoscopy rooms, ultrasound rooms, and cardiac function rooms, are located on the first and the second floors.
Figure 7 illustrates the hot zones of the hospital based on the porters’ movements from July 2020 to November 2020. As expected, porters frequently visited the first floor of the new medical building and the old medical building, as these are the hubs for consultations and examinations. In addition, the walkways that connect the two buildings were also identified as hot zones. This is because porters usually transferred patients or specimens from the wards in the new medical building to the examination rooms or specimen reception in the old medical building via these walkways. To better support infection control, enhanced cleaning and sterilization measures are required for the identified hot zones. The hot zones of porters in the hospital.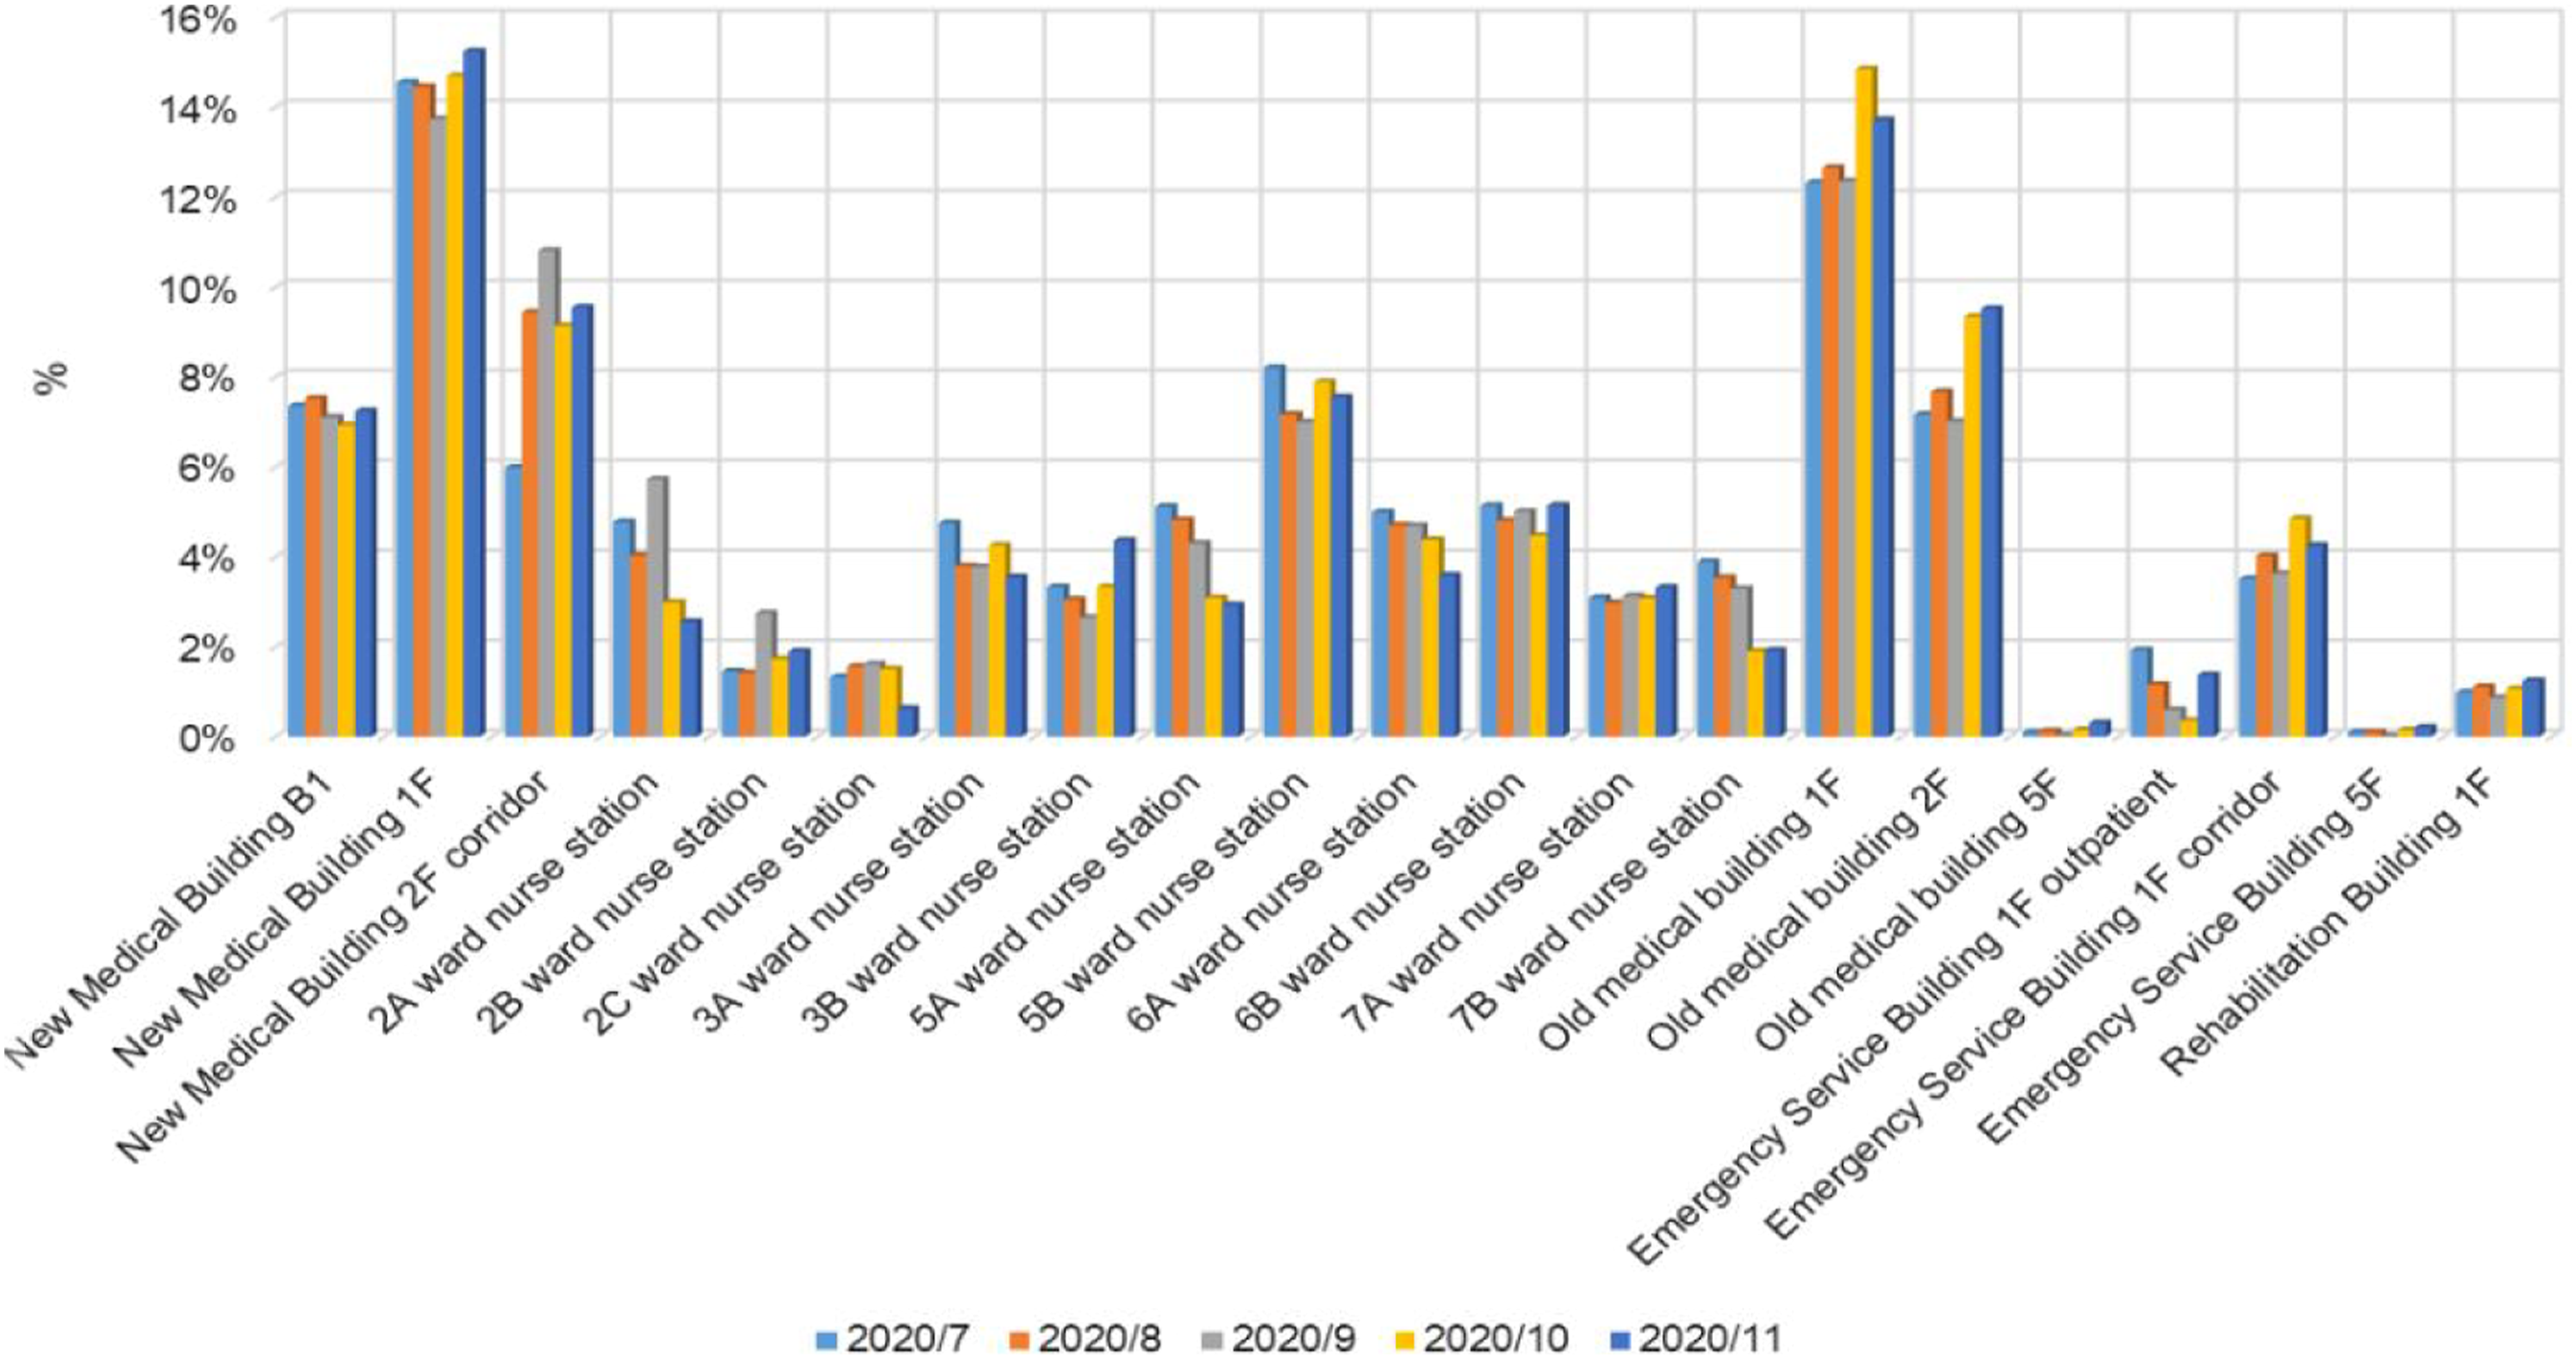
Monthly movement of porters
To further investigate the peak times and possible bottlenecks in porter services, we analyzed the number of cross-zone movement of different areas. Specifically, we examined the number of times porters visited each ward and the length of time they spent in each ward. Our analysis revealed that the demand for porter services was highest in Ward 5B, which was even twice as high as some of the other wards. On the other hand, the demand from Ward 7B was the lowest since it is a special ward where patient transfers are not as common. The results also show that the average waiting time per visit was around 2 minutes, which was reasonable. Additionally, we found that porters spent a similar amount of time transporting items or patients in each ward.
Daily and hourly movement of porters
This subsection illustrates a fine-grained analysis of porters’ movements on a daily and hourly basis. As Figure 8 shows, the total visit count for all regions peaked on July 22 to August 11, September 28, and October 14 to November 31 in 2020. The overlaps of these peak intervals indicate that porters were usually very busy from the end of 1 month to the beginning of the next. The possible reason for this was that the hospital had many more patients during this period. The total counts of all regions visit.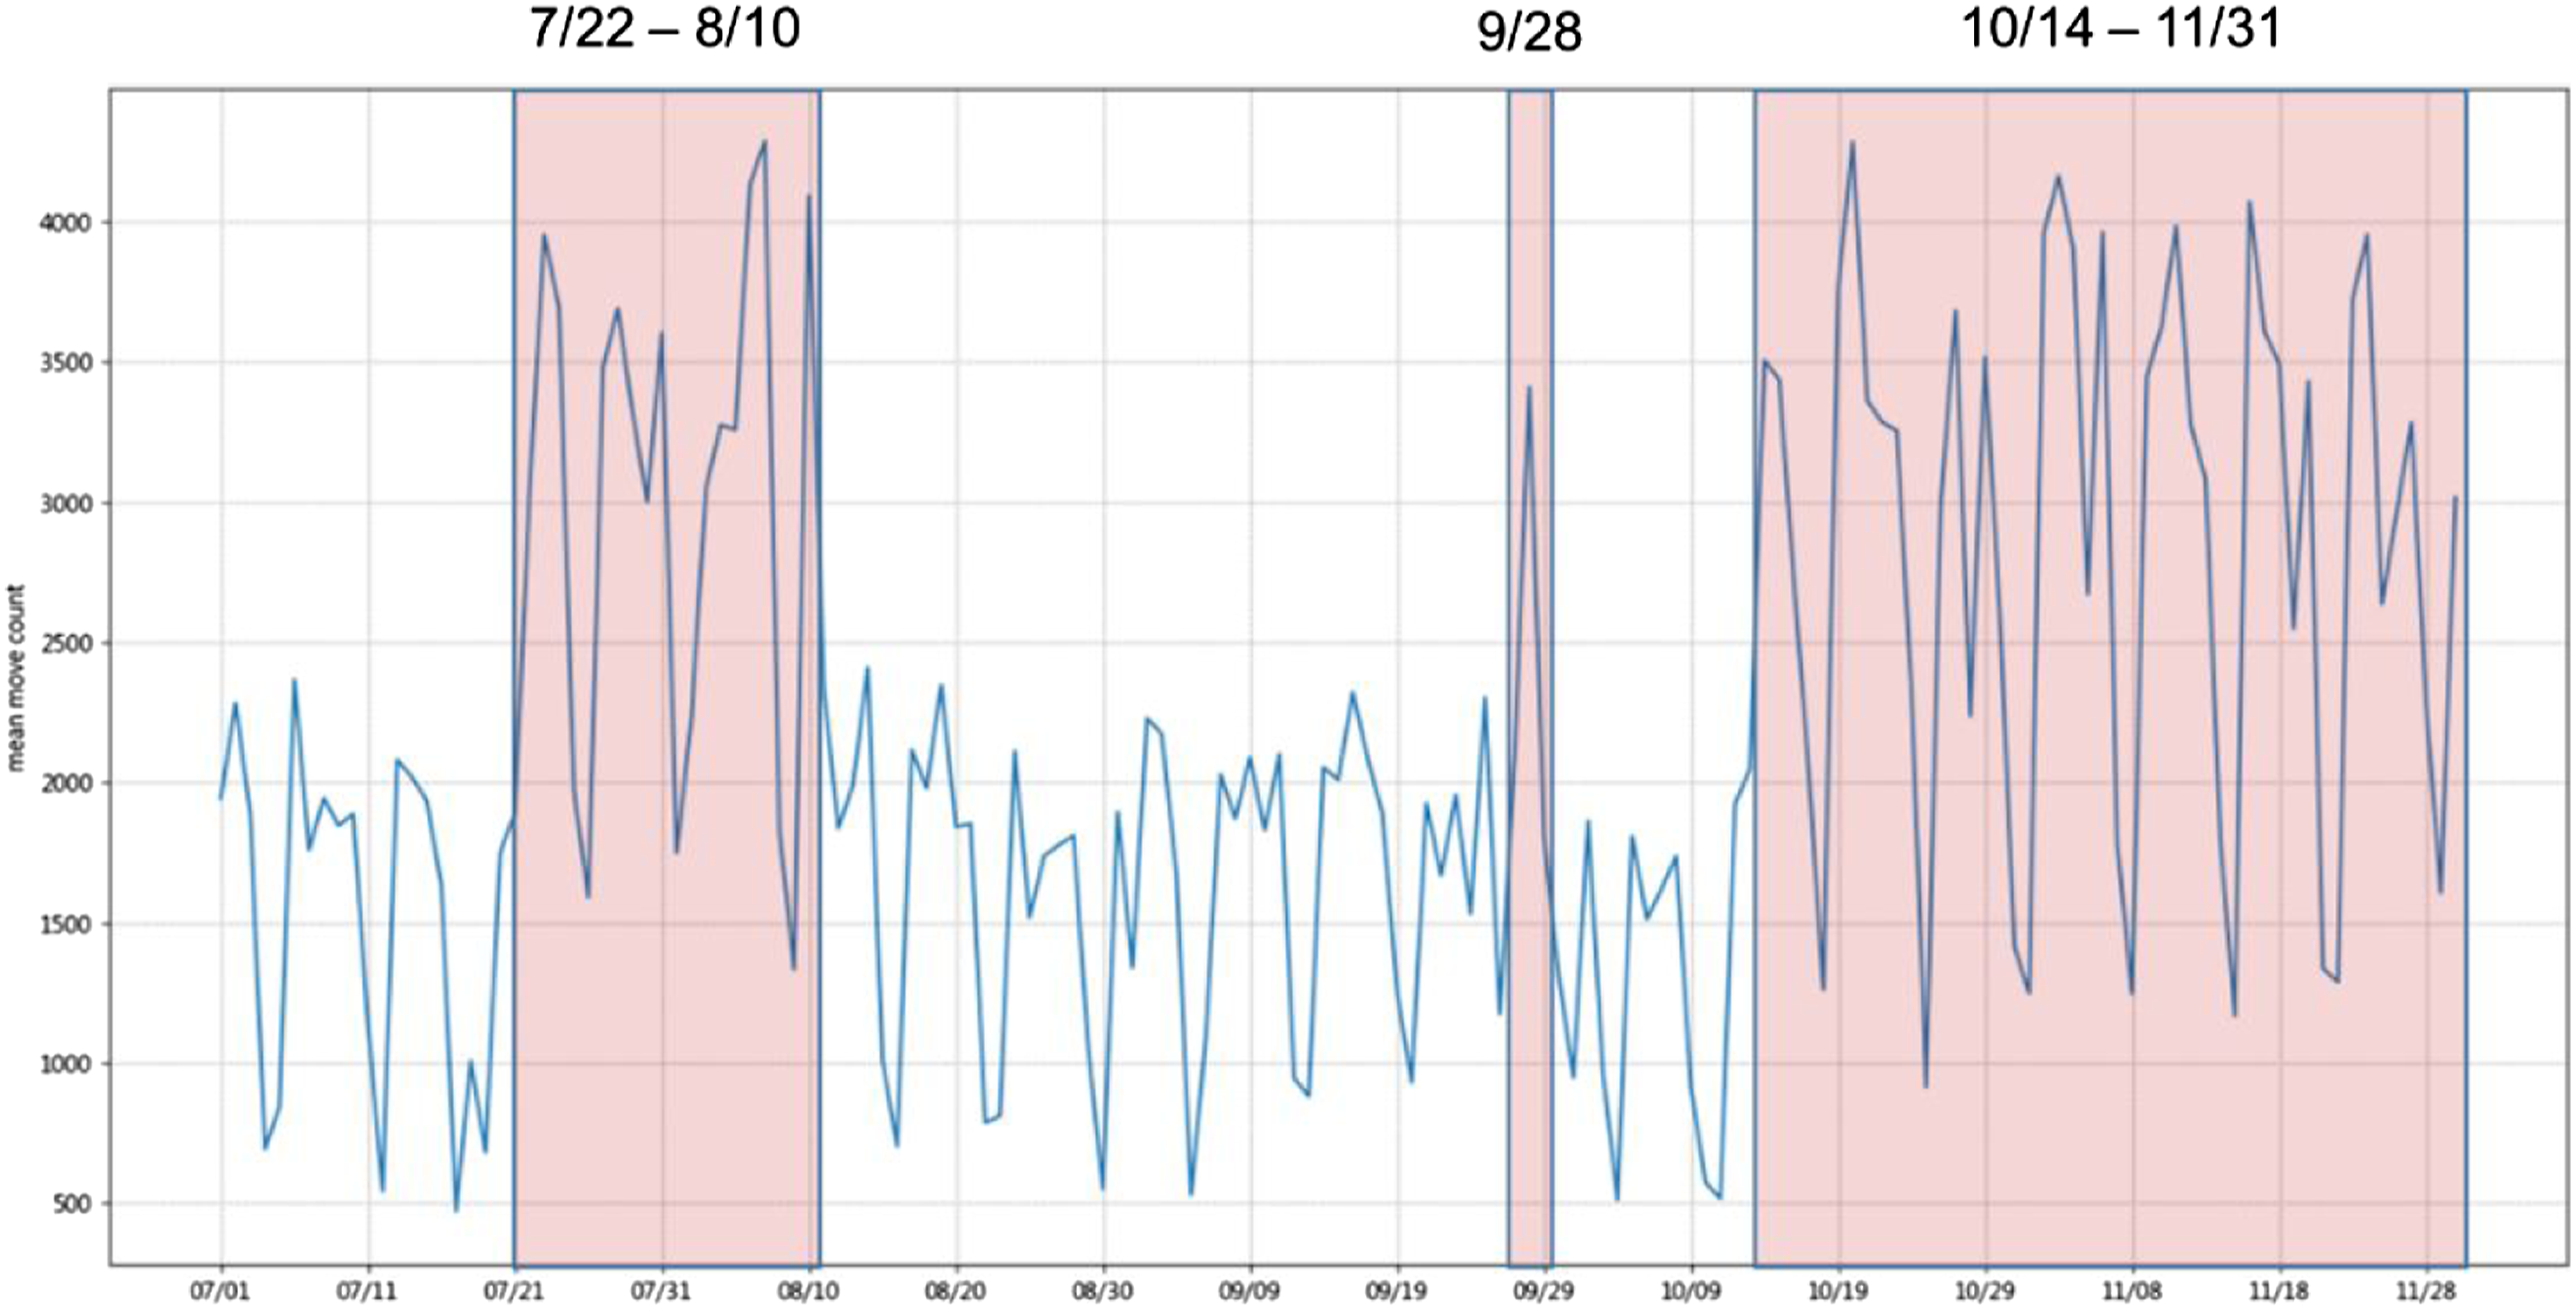
Figure 9 shows the percentage of region visit counts on weekdays and weekends for a period of 5 months. Although the peak day of a week in different months varied slightly, Monday was consistently the busiest day on average. This was because many surgeries and X-ray examinations were scheduled on Mondays. Rescheduling these treatments to other weekdays or weekends could help balance the workload of porters. The percentage of region visit count of weekdays and weekends.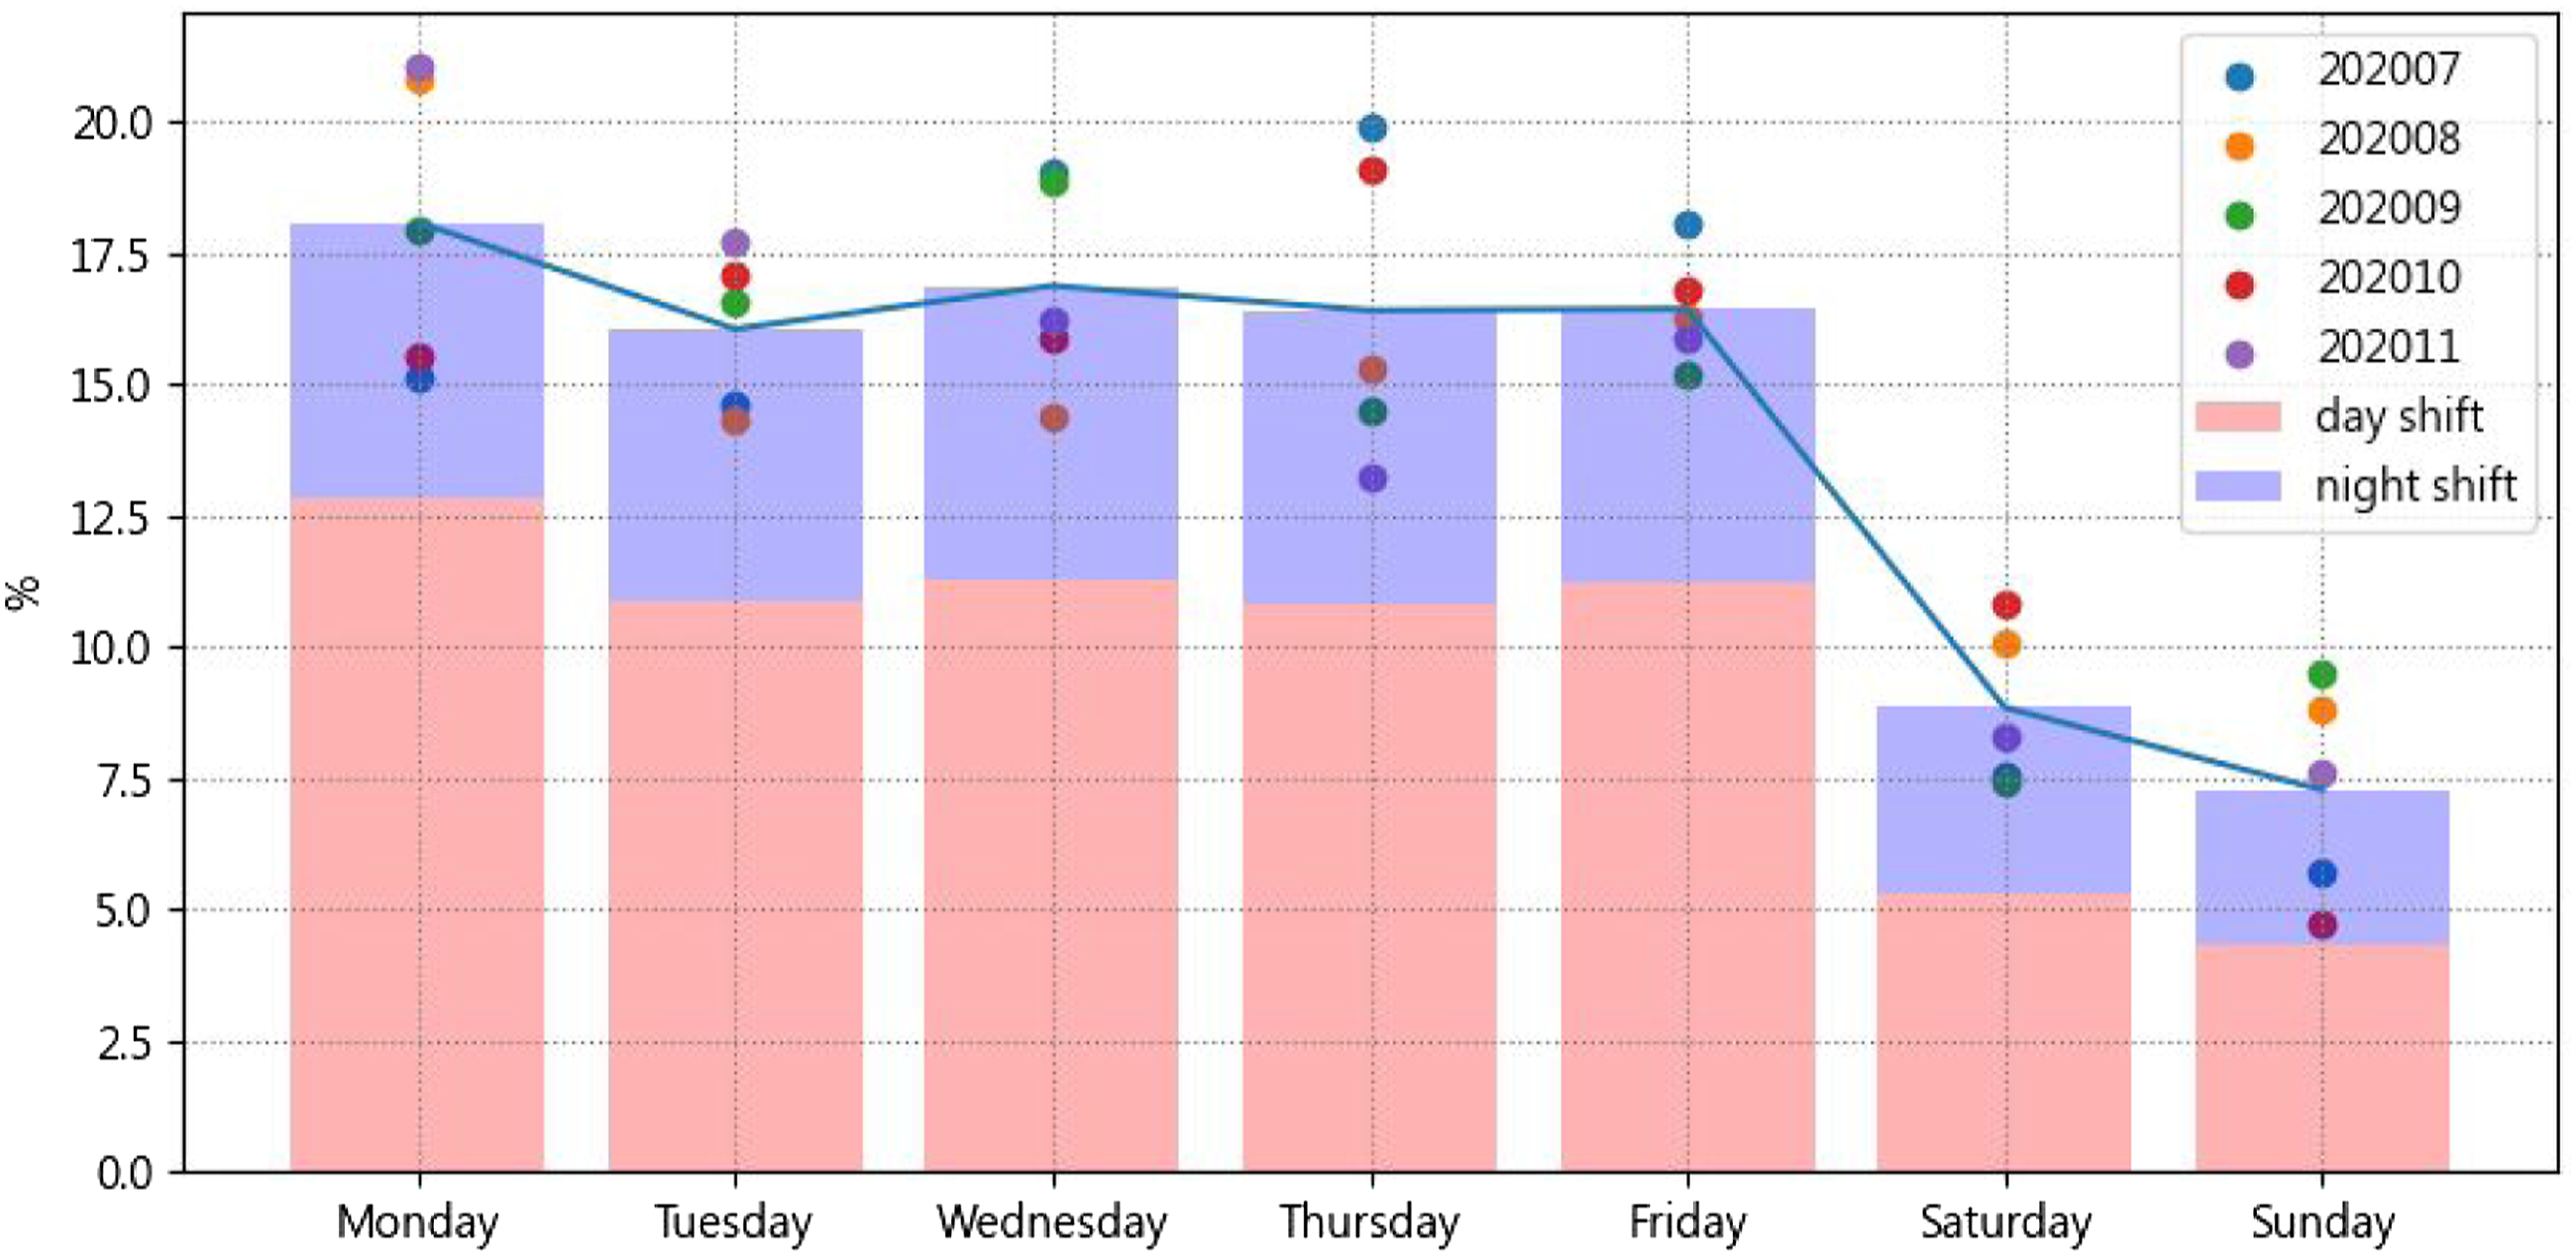
Figure 10 shows the percentage of region visit counts for each hour from July 2020 to November 2020. It is clear that the peak workload periods for porters are from 9:30 a.m. to 11:30 a.m. and from 1:30 p.m. to 3:30 p.m. If there are not enough porters, patients may have to wait. Therefore, it is suggested to avoid these peak hours or dynamically allocate porters to reduce patient waiting time. The percentage of region visit count for each hour.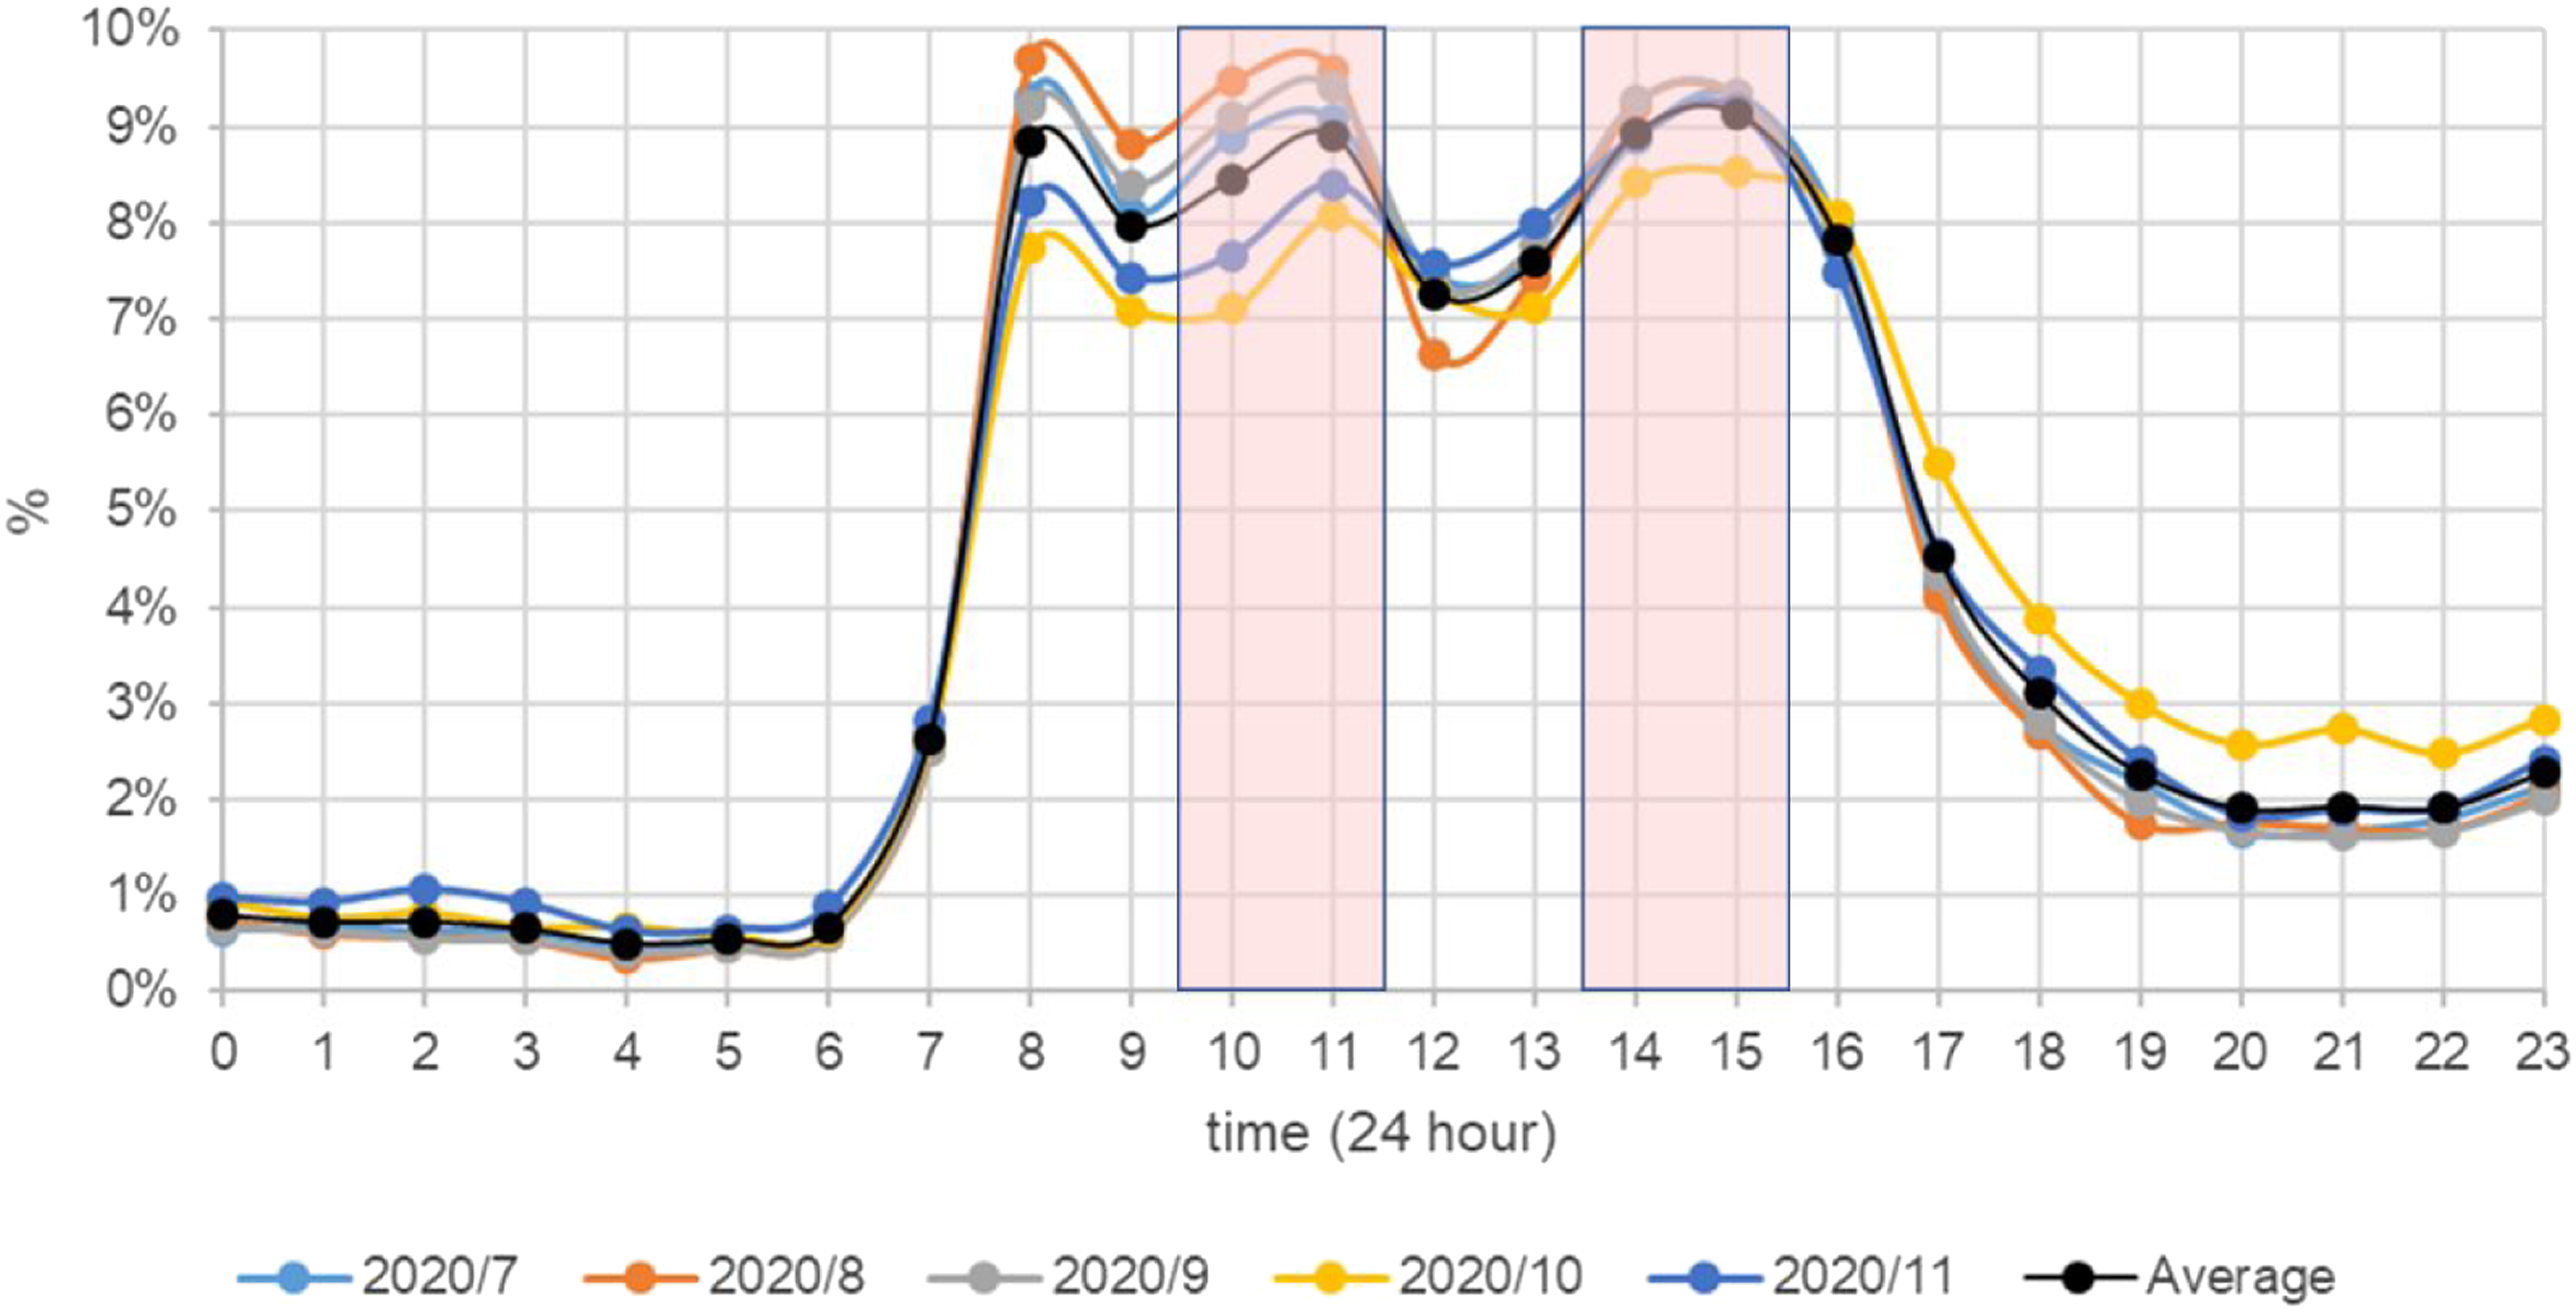
Discussion
Indoor trace analysis makes the delivery process transparent, filling the gap in the literature on hospital porter management.10,12 With both temporal and spatial information on porters, it becomes possible to compare the same indices for different time periods and spatial locations. The results of the spatial and temporal analyses are discussed below.
The results of spatial analysis
The movement behavior of porters reveals several important aspects of the delivery process. They are workloads, efficiency, and hotspots. With respect to workloads, the greater the movement distance, the higher the workload stress experienced by the porter. Balancing workloads among porters is crucial because it can improve not only job satisfaction but also enhance patient safety. Unbalanced or heavy workloads could lead to physical fatigue and emotional exhaustion. Spatial analysis shows that there was no significant difference between centralized porters and unit-dedicated porters regarding the distance of movement. A similar result was also found in day-shift porters and night-shift porters. However, from the perspective of gender, the movement distance of male porters was greater than that of female porters. This finding was aligned with the number of tasks assigned to porters; that is, the workload between male and female porters was unbalanced. Therefore, more management-related activities are necessary to effectively organize the porter team’s workload, such as reassessing workload distribution, reviewing task priorities, considering porters’ skill set, and checking their availability.
The spatial analysis also revealed an efficiency-related issue. There was a significant difference between seniority groups. The movement distance of junior porters (i.e., those with less than 1-year seniority) was greater than that of senior porters. However, there was no significant difference in the number of tasks assigned to each porter. In other words, the junior porters walked more than others even though they were not assigned more tasks. One possible reason for this is that the junior porters were unfamiliar with the delivery service process, leading them to take a detour to the destination. Continuous on-the-job training of junior porters is necessary, such as allowing them to observe a professional at work, establishing structured mentorship programs or conducting solid evaluations. Effective knowledge sharing among porters could also help them respond to job stress.
The spatial analysis further revealed the hotspots visited by porters in the hospital. As Figure 7 shows, the hotspots include the outpatient area, the waiting areas of examination rooms, and the walkways that connect the new medical building and the old medical building. The information about hotspots is valuable for both infection control and porter management. For infection control, the hospital can enhance sterilization procedures in these areas. Additional restrictions could be added to prevent an outbreak or a nosocomial infection, such as reducing the number of people permitted to stay in a hotspot at the same time. Spatial analysis can also be used for porter management. According to the rules, porters are expected to return to the dispatch center after they finish their tasks. The dispatch center can examine whether any hotspot is unexpected or unusual; that is, whether porters stay in appropriate places during or after their work shift. Further investigation or better supervision can be adopted if any hotspot is unreasonable.
The result of temporal analysis
The temporal information shows some properties relating to time, including peak time, delay time and working time. As shown in Figures 8–10, a day’s peak occurs from 9:30 a.m. to 11:30 a.m. and from 1:30 p.m. to 3:30 p.m., a week’s peak occurs on Monday, and a month’s peak starts from the end of the month and ends at the beginning of the next month. Porters can be very busy and stressed during these peak periods. If there are insufficient porters, patients may need to wait. Possible solutions for reducing patient waiting time include prioritizing tasks or hiring more porters. A cooperative model that considers both centralized porters and unit-dedicated porters could also make the porter team more productive.
The delay time is the time a porter spends in a ward waiting for a patient or object to be ready for transport. The longer the delay, the less efficient the process becomes. The delay time was provided by the indoor positioning system. The historical records of delay events were automatically stored in LOPS for further analysis. Our results show that the average delay time is less than 2 min, which was within a reasonable range. Therefore, the hospital did not have the delay problem mentioned in.5,8 However, some emergency cases may have tighter and stricter timing constraints. Further analysis of these special cases is considered as future work. Furthermore, there are other types of delays that can occur during patient transportation inside a hospital. For example, transferring the wrong patient can cause a significant delay, but we did not find this problem in our study.
Working hours refer to the time a porter is detected by the indoor object tracking system, excluding the time when the porter is on standby in the dispatch center. In other words, the working hours can be used to approximate the time the porter spends standing during his or her shift. The larger the working hours, the longer the porter stands, and the more stress he or she experiences. The working hours of male porters are higher than those of female porters. The working hours of day-shift porters are also greater than those of night-shift porters. A minimum rest period between tasks should be considered because prolonged standing can cause health issues such as low back and leg pain. In addition, commonly used intervention methods, such as compression stockings, could be considered.
Although LOPS can provide detailed temporal and spatial information on delivery services, such as delay time and workloads, more information is required to further improve the performance of the porter team. For example, to identify the root cause of delays, more information on ward operations is necessary. Additional qualitative research, such as in-depth interviews, is needed to collect detailed data and context. Furthermore, the movement distance is not the only factor that can be used to assess workload. Other factors, such as the weight of patients or equipment, and mental stress, should also be considered. These issues are considered as future work.
Conclusion
In this study, we first developed an indoor location-based porter management system on top of the infrastructure of indoor positioning services in the hospital National Taiwan University Hospital YunLin Branch. The system provides detailed information on each task for the dispatcher to prioritize tasks while storing porters’ traces in a data storage. We then conducted a 5-month field trial in the hospital with 90 porters. Finally, a series of quantitative analyses were performed to assess the efficiency of porter operations, including workloads, efficiency, hotspots, peak time, delay time, and working time. Based on the analysis results, recommendations were given to improve the efficiency of the porter team. In the future, we plan to extend the functionality of the system by adding a route planning module to optimize the route of each porter, thereby shortening the patient transport time in the hospital.
Footnotes
Declaration of conflicting interests
The author(s) declared no potential conflicts of interest with respect to the research, authorship, and/or publication of this article.
Funding
The author(s) disclosed receipt of the following financial support for the research, authorship, and/or publication of this article: This work was supported by the Ministry of Science and Technology (MOST) of Taiwan under Grant (108-2221-E−224-017-MY3) and National Taiwan University Hospital YunLin Branch Project 110.C017.
Ethical approval
The research was approved by the Research Ethics Committee C of the National Taiwan University Hospital (No.202,108,116 W). The participants were protected by hiding their personal information during the research process. They knew that the participation was voluntary, and they could retreat at any time.
Informed consent
An informed consent document was signed by each hospital porter, which declares that the collected data will be used only for workload evaluation and research purposes.