
Abstract
Medical care services can be organized into a network. Understanding the structure of this network cannot only help analyze common clinical protocols but can also help reveal previously unknown patterns of care. The objective of this research is to introduce the concept and methods for constructing and analyzing the network of medical care services. We start by demonstrating how to build the network itself and then develop algorithms, based on principal component analysis and social network analysis, to detect communities of services. Finally, we propose novel graphical techniques for representing and assessing patterns of care. We demonstrate the application of our algorithms using data from an Emergency Department in New York State. One of the implications of our research is that clinical experts could use our algorithms to detect deviations from either existing protocols of care or administrative norms.
Introduction
Medical care services (MCS) can be organized into a network that, if analyzed appropriately, can reveal common medical practices, such as clinical pathways. In this article, we introduce methods for constructing such a network and demonstrate how to explore the resulting communities to detect organized patterns of care. Clinical experts could utilize our techniques to confirm adherence to existing clinical protocols or identify atypical correlations of MCS.
A model of the delivery of MCS
Figure 1 portrays a basic model of the delivery of MCS where a physician, or a group of physicians, evaluates the patient and then recommends appropriate services.
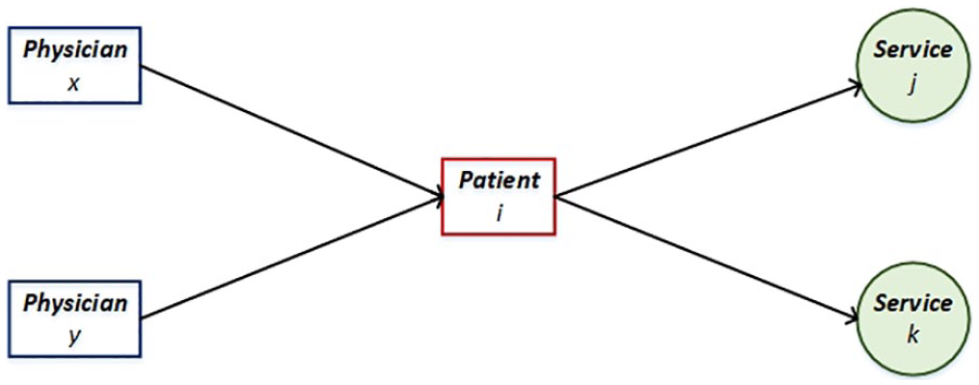
A basic model of the delivery of MCS.
From the model in Figure 1, we appreciate two possible relationships in the delivery of MCS:
Relationship 1. Physicians
Relationship 2. Services
The existing research about the relations in the delivery of MCS has focused on Relationship 1 and only explores the network of physicians who share the same patients. 1 In this research, we propose a study of the relations in the delivery of MCS that emphasizes the network of shared services among patients, a topic that has not been considered as much.
A simulation of a small network of MCS
In Figure 2, we attempt to simulate a few scenarios of medical care delivery to demonstrate how a network of shared MCS can arise. We start by imagining a small health care clinic that only provides five services ⓐ, ⓑ, ⓒ, ⓓ, and ⓔ. In addition, we assume that there are four different patient visits. We do not make a distinction as to whether the same or a different patient visited, or whether the patient(s) saw the same or a different physician.
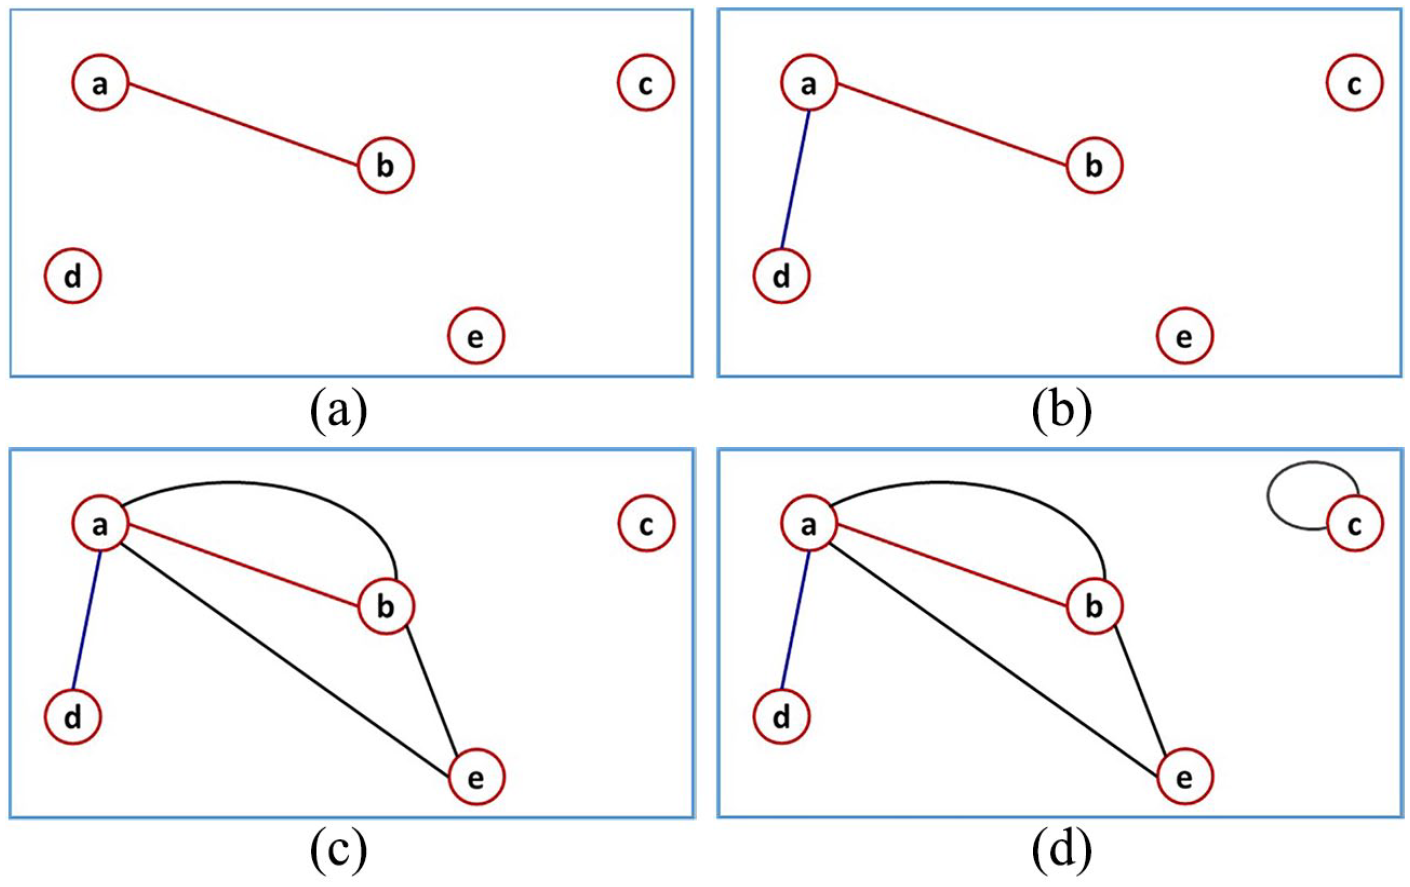
A simulation of a small network of MCS: (a) Visit 1, services ⓐ and ⓑ delivered. (b) Visit 2, services ⓐ and ⓓ delivered. (c) Visit 3, services ⓐ, ⓑ, and ⓒ delivered. (d) Visit 4, service ⓒ delivered twice.
In Figure 2(a), a patient comes in and receives services ⓐ and ⓑ. In Figure 2(b), a patient receives services ⓐ and ⓓ. In Figure 2(c), a patient receives services ⓐ, ⓑ, and ⓔ. In Figure 2(d), a patient receives service ⓒ twice. By the fourth visit, we can already appreciate that a network has formed. Each node is a distinct type of service, and the number of links or edges between two nodes signifies how much the corresponding services are related. To analyze the network of MCS, we propose algorithms based on the social network analysis (SNA) and principal component analysis (PCA).
Literature review
SNA related to the network of providers
Landon et al. 1 apply SNA methods to study the properties of patient-sharing networks among physicians. In their model, physicians are nodes, and patients are edges. A more weighted link is indicative of a higher number of shared patients. In a different study, Landon et al. 2 use a similar model to evaluate the effects of the network of physicians on patient outcomes and health care spending. Wang et al. 3 also use SNA techniques to construct a collaboration network of physicians and then evaluate the network effects on costs and quality outcomes. In this study, physicians are also nodes, but edges represent patient admissions. Similar patient-sharing network models are studied by several authors.4–6 Creswick et al. 7 study a slightly different network of providers. In their study, the authors attempt to understand a communication network among clinical and administrative staff in an emergency department (ED). The authors find that communities are formed around different professions. But, they also notice that other communities result from other reasons such as problem-solving, medication advice, and basic socialization. Boyer et al. 8 utilize a similar model to analyze the properties of a network of communication among health care professionals in a French public hospital. Tang and Yang 9 study the centrality of users in an online health care social network. The authors develop a userRank algorithm to assess the influence of users based on the nature of links and the content. Meltzer et al. 10 apply SNA methods to model effective quality improvement teams in health care. In this study, the authors recommend a strategic selection of team members based on their centrality in the network. For example, the authors indicate that a team member with a higher “net degree” will potentially receive more influence from outside, the desired outcome but also one that may dampen the cohesion of the team. Poghosyan et al. 11 in their study conduct a systematic review of studies that apply SNA methods to social networks in health care. One of their highlights is that professional and personal networks do have the potential to affect the delivery of medical care, such as in the adoption of new drugs. Chambers et al. 12 also do a systematic review of applications of SNA methods in health care. From their investigation, the authors recommend that researchers focus on SNA-interventions-based models.
SNA related to the network of MCS
There is limited literature about the applications of SNA methods to study the network of MCS. The work that we are aware of includes Carroll and Richardson, 13 where the authors discuss the use of SNA methods to model the dynamics of health care services. Specifically, the authors emphasize the application of SNA models to evaluate a careflow network. The suggested network includes nodes of patients, carers, health care administrators, social workers, and other relevant actors. The links in the network express the exchange of information and resources among the nodes. The authors indicate that using SNA to study the structure of such network could help reveal potential opportunities to improve patient safety and quality outcomes. Niyirora and Klimek-Yingling 14 also apply SNA methods to analyze connections in health care services. The authors demonstrate how to use SNA centrality measures to identify the most important services in an ED. In this article, we extend the work of these authors by proposing SNA and PCA–based algorithms to evaluate the communities of MCS and thus help clinicians confirm adherence to existing clinical protocols or detect atypical connections.
SNA in medical care
SNA, which relates to graph theory,15,16 is routinely applied to network problems in medical care. For example, in neuroscience, SNA is commonly utilized in the construction and analysis of graph theoretical models of the brain. 17 Sanz-Arigita et al. 18 and Supekar et al. 19 use graph theoretical models to identify the biomarkers of Alzheimer’s disease. Similar approaches are undertaken in Bassett et al. 20 to analyze the biomarkers of schizophrenia. Bath et al. 21 apply graph-theoretical models to study patterns and clusters of illness using public-health data.
PCA and other clustering techniques
PCA is a statistical technique that is often employed for purposes such as spectral decomposition, dimension reduction, factor analysis, and spectral clustering.22,23 Several researchers have applied PCA methods on a variety of health care problems including attempting to identify the phenotypes of acute mountain sickness. 24 In Arai et al., 25 PCA is used to predict strains of a bacterial infection in septic patients. In Platts-Mills et al., 26 PCA is used for the dimensional reduction of the data related to motor vehicle accidents in an ED. In Motin et al., 27 PCA is used in the ensemble empirical mode decomposition technique to extract respiratory and heart rates from photoplethysmographic signals. In Widjaja et al., 28 PCA is applied to the electrocardiogram data to obtain respiratory signals, whereas in Sharma et al., 29 PCA is used to compress the similar type of data. In Charkhkar et al., 30 PCA-based clustering methods are applied to diagnose acute coronary syndrome. Nilashi et al. 31 apply soft computing techniques to cluster diabetes mellitus disease into groups. Some of the methods the authors use include expectation maximization, PCA, and support vector machine.
Besides PCA, other statistical and clustering algorithms that are commonly employed to classify health care data, include k-means, hierarchical clustering methods, sphere exclusion techniques, and the lagged linear correlation method. For example, Loane et al. 32 use a k-means algorithm along with hierarchical clustering methods to classify the patterns of movement in the homes of older residents. O’Neill et al. 33 also use k-means to cluster patterns of telephone calls regarding mental health. Vazquez Guillamet et al. 34 use a sphere exclusion technique to cluster different types of chronic obstructive pulmonary disease, given International Classification of Diseases–Ninth Revision (ICD-9) medical codes. Hripcsak and Albers 35 use the lagged linear correlation method to group the laboratory values and clinical concepts.
Contributions
In this research, we do not introduce any new mathematics. We build on existing PCA and SNA theories to develop algorithms to classify communities of MCS and allow for the detection of the patterns of care. Our main contributions are as follows:
We introduce an SNA-based algorithm to create a neighborhood graph of MCS and identify relevant communities of MCS.
We introduce a PCA-based algorithm to develop a loading matrix to allow for the detection of communities of MCS based on the coefficients of correlation.
To detect the pattern of care, we suggest introducing secondary nodes into the network and then infer the context of each community based on the meaning of these new nodes.
We propose using radar charts and scatter plots to present and visualize communities of MCS.
We provide a detailed example of our methods using data from an ED in New York State.
The organization of the rest of the article follows. In the “Methods” section, we introduce our SNA and PCA algorithms. In the “Application” section, we highlight the performance of our methods using the ED data. We end the article with concluding remarks and plans for future work. In Appendix 1, there is a detailed example of how to implement the proposed algorithms.
Methods
We propose applying SNA and PCA–based algorithms to analyze the network of MCS. We begin with the construction of an adjacency matrix that we later use to create a neighborhood graph and a loading matrix. Subsequently, we attempt to find and interpret the pattern of care in the communities of the network.
Constructing an adjacency matrix
We suppose that there is a population of patient visits in a particular clinical setting. From this population, we take a representative random sample of
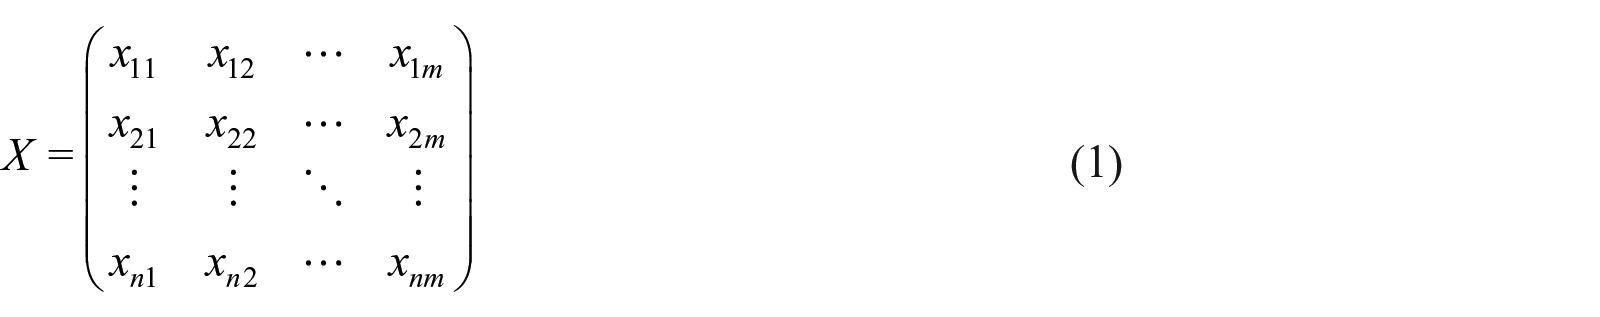
where for a visit

Next, we use the indicator matrix

where ’ signifies transpose and the expanded version of matrix
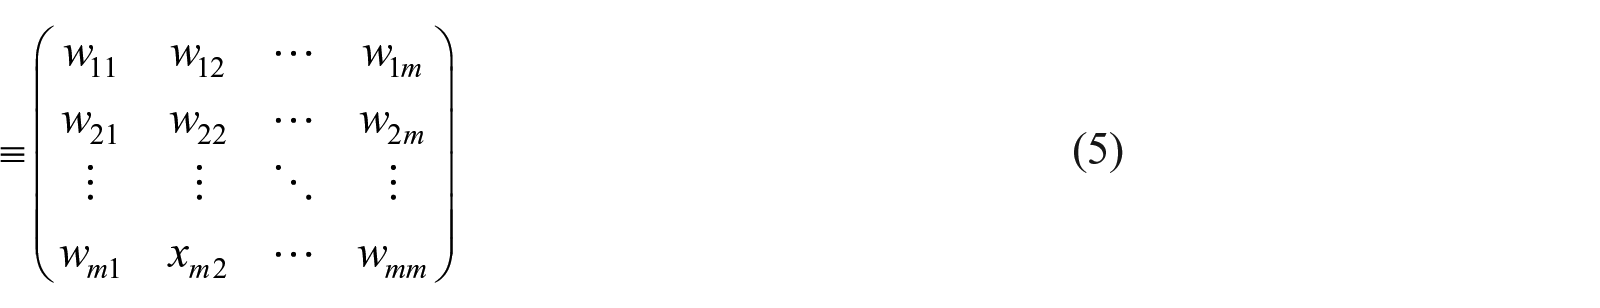
where the ≡ symbol implies equivalence. It follows that

which implies that
for
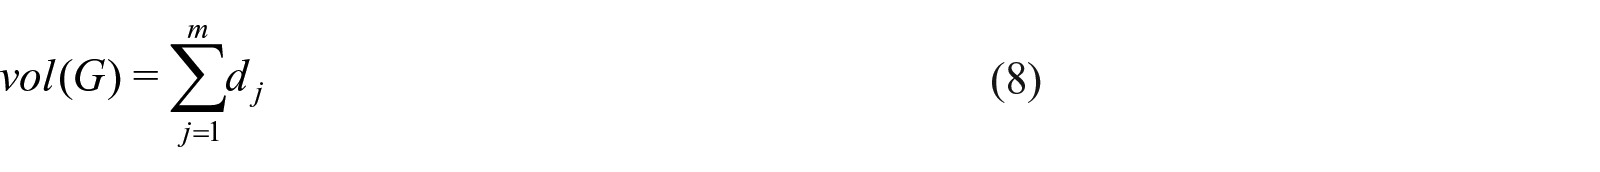
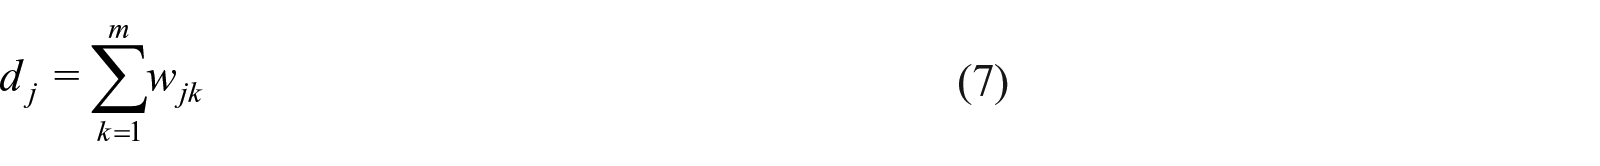
where

Here,

where
Searching for MCS communities using SNA concepts
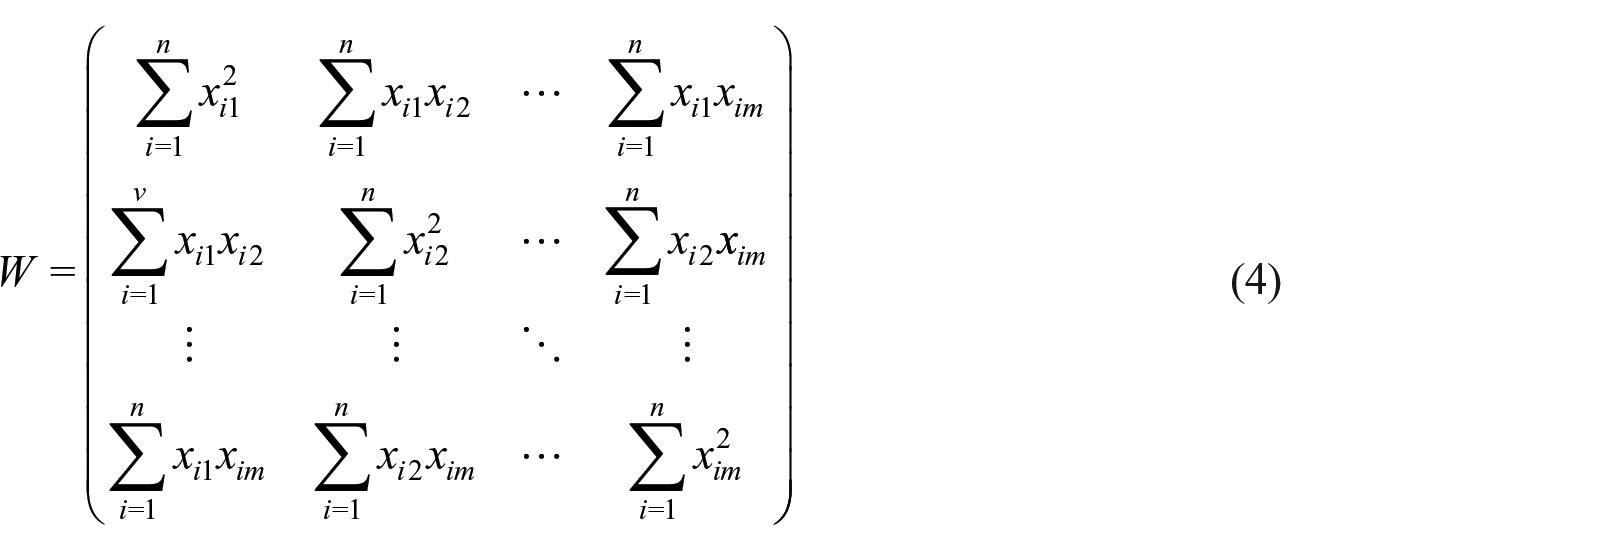
From matrix
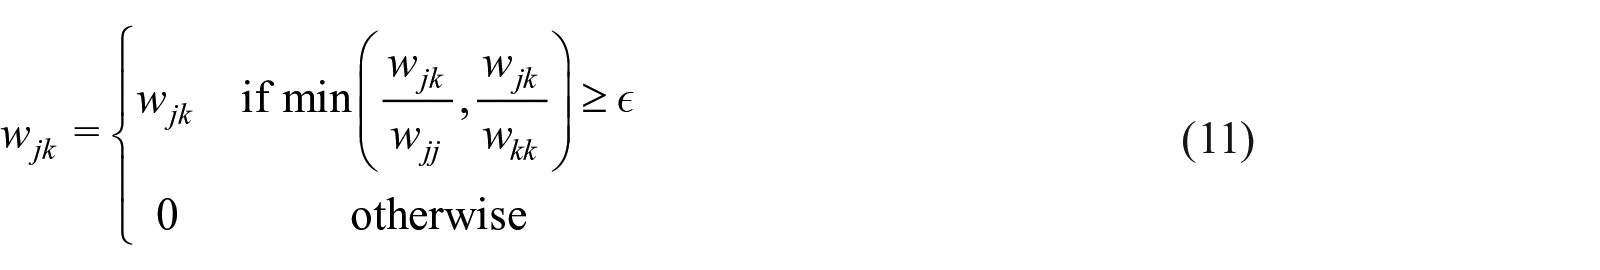
where
We propose Algorithm 1 to find and analyze the communities of MCS using SNA techniques.
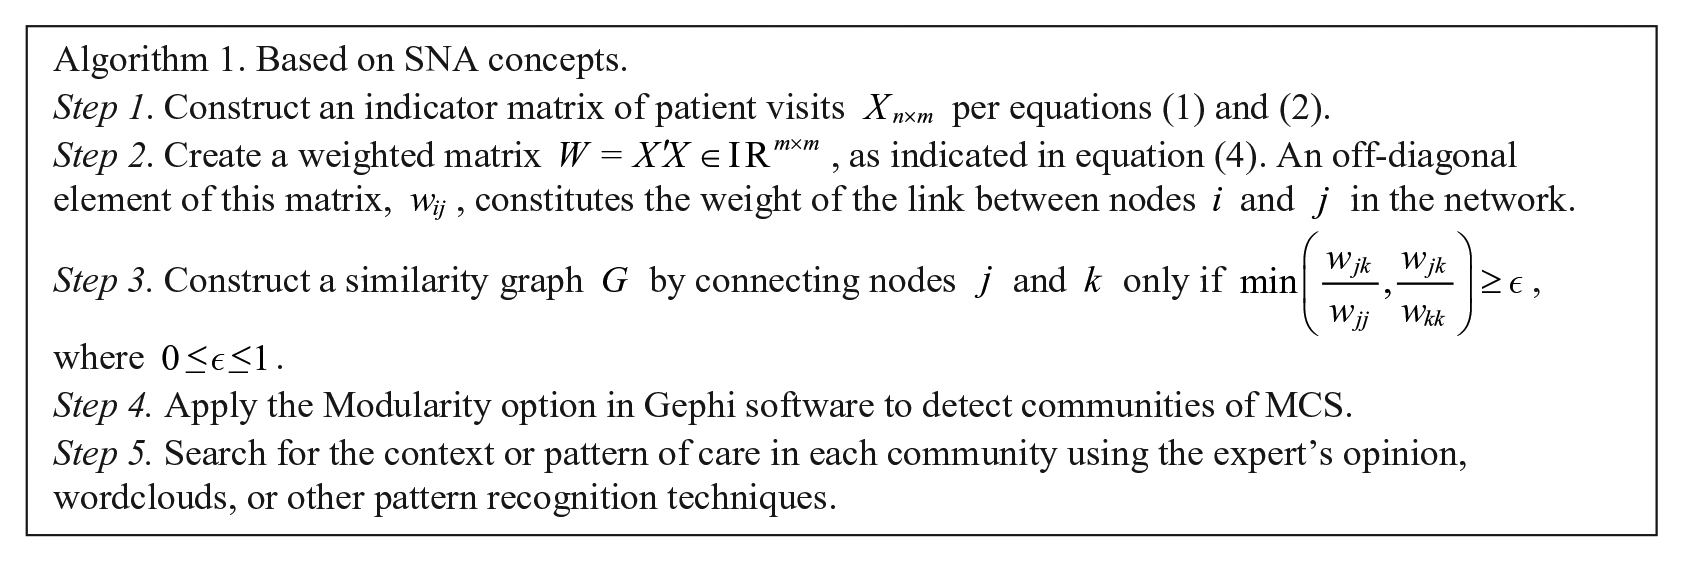
We should note that, besides the Modularity option in Gephi, several other software such as Cytoscape 38 and NetworkX 39 are applicable for detecting communities in a graph. For a theoretical discussion about various community detection methods, see Newman. 15
Searching for MCS communities using PCA concepts
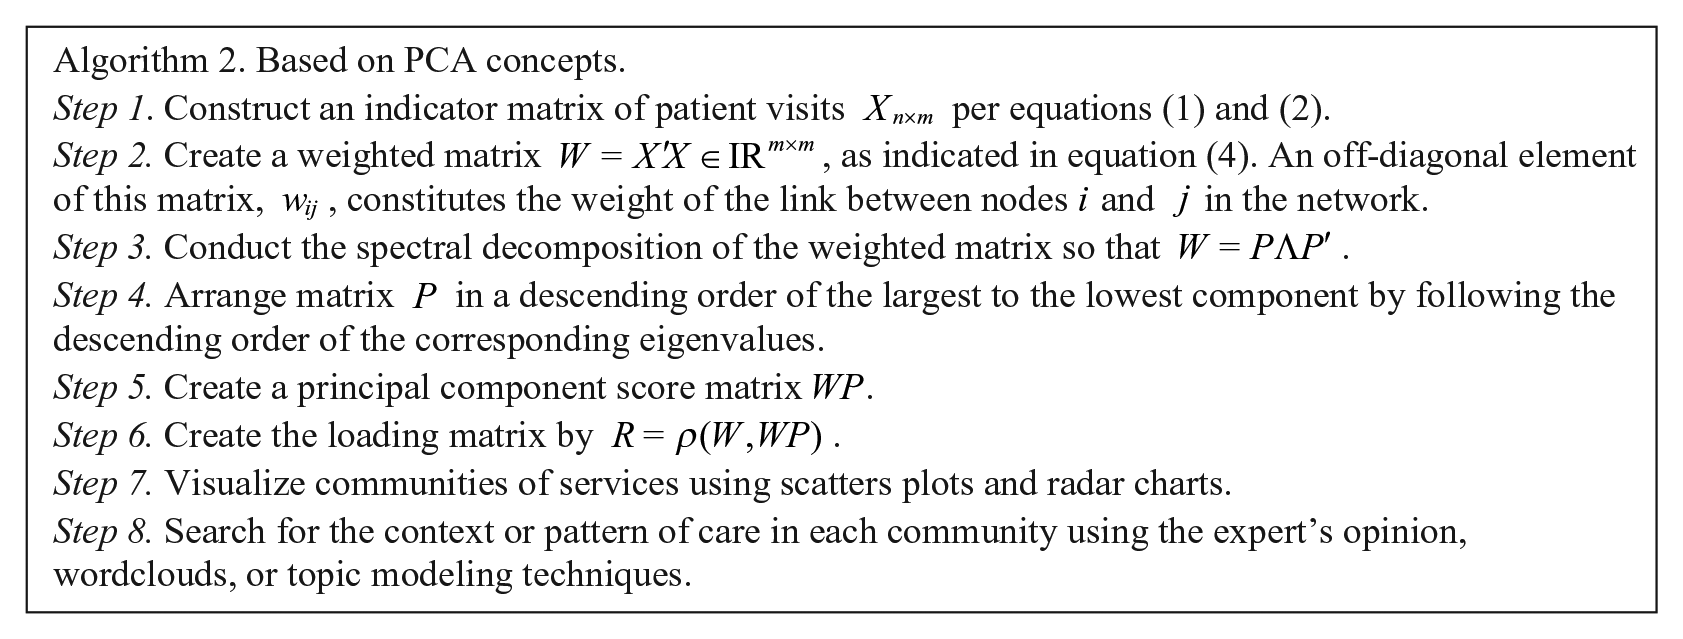
Besides SNA techniques, we can also apply the PCA concept to attempt to find communities or clusters of similar MCS. We follow the existing PCA theory22,23,40 and decompose

where

since

where
Searching for the pattern of care
To search for the pattern of care in a given community of MCS, we can request an expert’s opinion or employ topic modeling techniques such as the latent Dirichlet allocation.
41
To get started, we suggest utilizing simple tools like a word cloud
42
(e.g. see https://www.wordclouds.com/ or https://pypi.org/project/wordcloud/) to help contextualize the distribution of words in the descriptions of MCS. As we will demonstrate later, the most frequent words tend to reveal the pattern of care. Another simple technique that we could employ involves introducing auxiliary nodes into the network (e.g. medical diagnoses) and then infer the pattern of care based on the meaning of these new nodes. One other benefit of auxiliary nodes is that we may be able to uncover transitive relationships that were not previously noticeable. For example, in the original network, we expect services j and k to belong in the same community only if
Visualizing the community
In this article, we propose using radar charts to visualize communities of services in matrix
Scatter plots tend to show more distinct communities when matrix
The values of the first eigenvector of matrix
The second eigenvector of matrix
We will demonstrate how to apply these visualization tools in the “Application” section and Appendix 1 of this article.
Other useful techniques for classifying MCS
Other useful techniques for classifying the communities of MCS include the centroid method (a hierarchical clustering technique) and k-mean (a non-hierarchical clustering technique). The k-mean method is particularly appealing given its tendency to work well in many applications. Although, from several experiments that we ran, we found the latter approach not to work as well, especially when a priori number of clusters k exaggerated the actual number of clusters in the data. One of the reasons of such a poor performance of the k-mean technique in the classification of MCS is because our matrix
Application
In this section, we demonstrate how to apply our proposed network algorithms using the data from an ED of a hospital in New York State. We show more details in Appendix 1.
Our data
We obtained a sample of de-identified patient visits
Nodes of the network
We use CPT codes as the main nodes in the network and ICD-9-CM codes as the secondary nodes that we employ to infer the pattern of care. For the reader not familiar with CPT, this coding system is arranged into distinct sections of medical services by physician specialties, body system, or other well-defined criteria. Within each section, codes are arranged in numerical or alphanumerical order. A valid CPT code is five characters long.
45
Typically, the first two characters of such a code are enough to reveal a broader meaning of the type of service that was provided. To minimize the sparsity and noise in the data, we only use the first two characters of a CPT code to label nodes in our network. For example, CPT code
Creating an indicator matrix
We create the indicator matrix
The setup of matrix
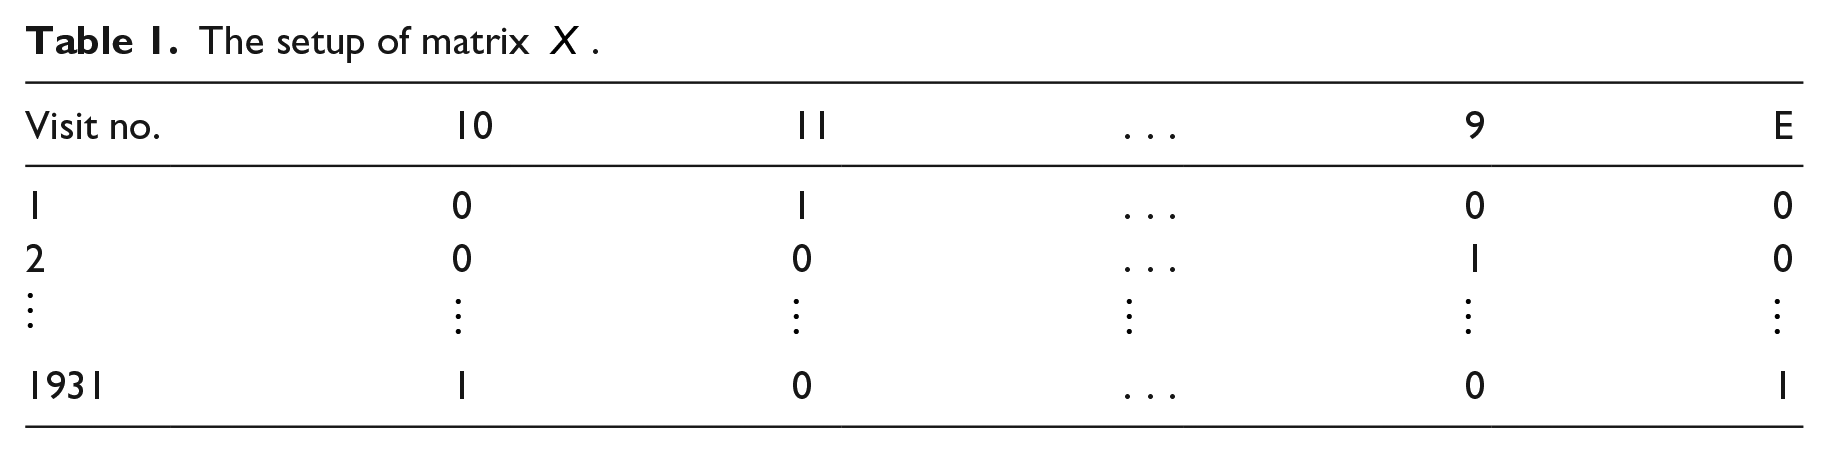
The first column of Table 1 identifies the patient visit number. The rest of the columns represent the nodes in the network. The two numerical characters in the heading on this table relate to CPT codes, and they represent primary nodes in the network. The single characters in the heading relate to ICD-9-CM codes and they represent secondary nodes in the network.
Creating matrices
,
, and
We create matrix
We search for the context of a given community by evaluating the pattern of words in the descriptions of CPT and ICD-9-CM labels. Whenever possible, we suggest that clinical experts be involved in helping identify unusual communities of services or those communities that relate to known medical protocols. In this article, we relied on our background in health information management to describe communities resulting from our analysis.
Results obtained by applying Algorithm 1
In Figure 3, we present an є-neighborhood graph that we created by applying Algorithm 1 with
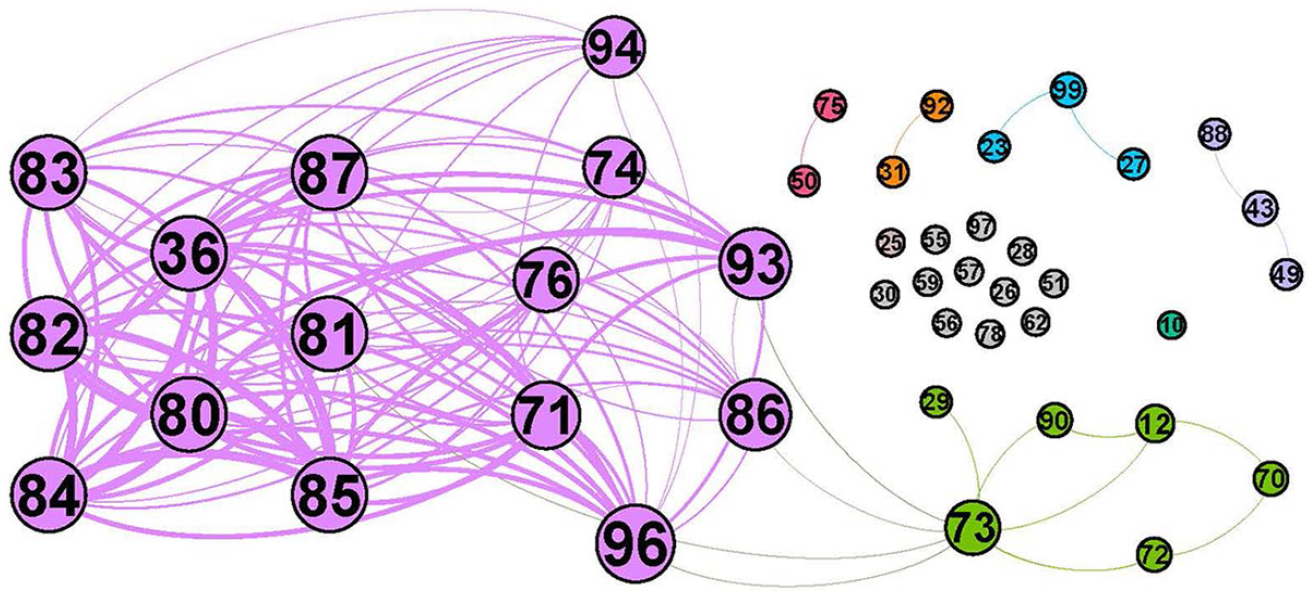
A network of MCS when only CPT nodes are considered.
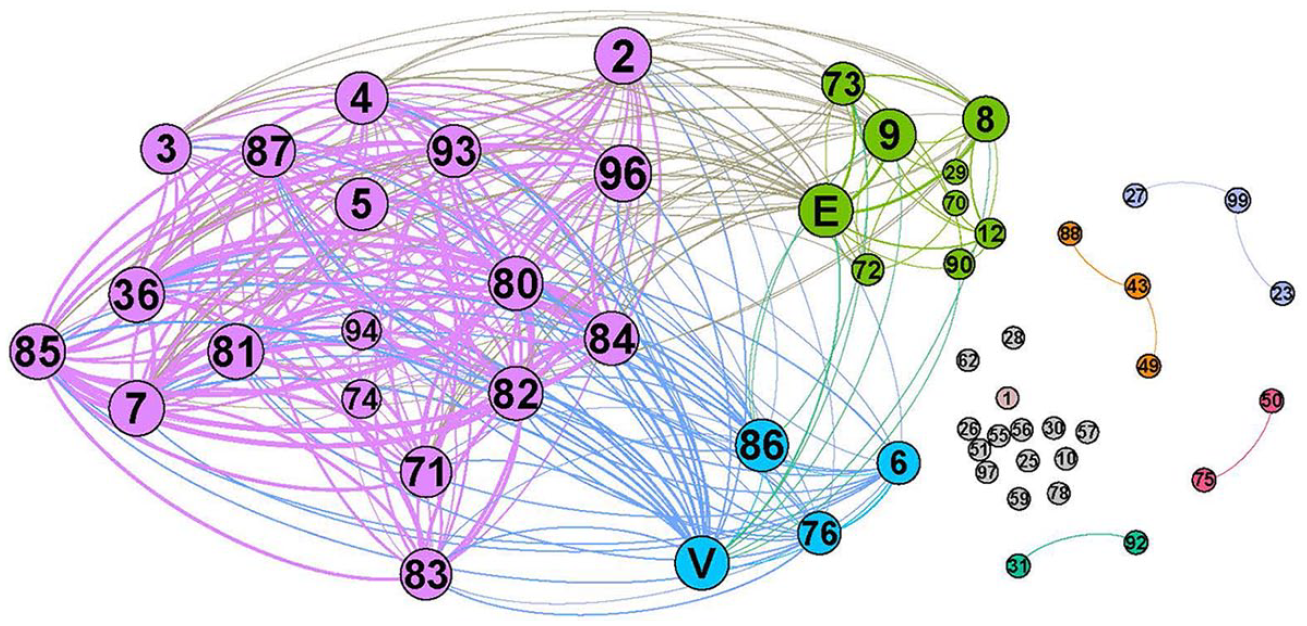
A network of MCS when both CPT and ICD-9-CM nodes are used. CPT nodes, labeled using two numerical digits, represent MCS. ICD-9-CM nodes, labeled using a single alphanumeric character, broadly present medical diagnoses under treatment.
In both Figures 3 and 4, a different color identifies a different community. The bigger the node, the more frequent the label. Also, the thicker the edge, the more related the linked nodes are. To interpret each community, we apply the Wordcloud method 42 on the descriptions of both the CPT and ICD-9-CM nodes, as exemplified in Figure 5. In this figure, we attempt to identify the pattern of care in the communities portrayed in Figure 3.
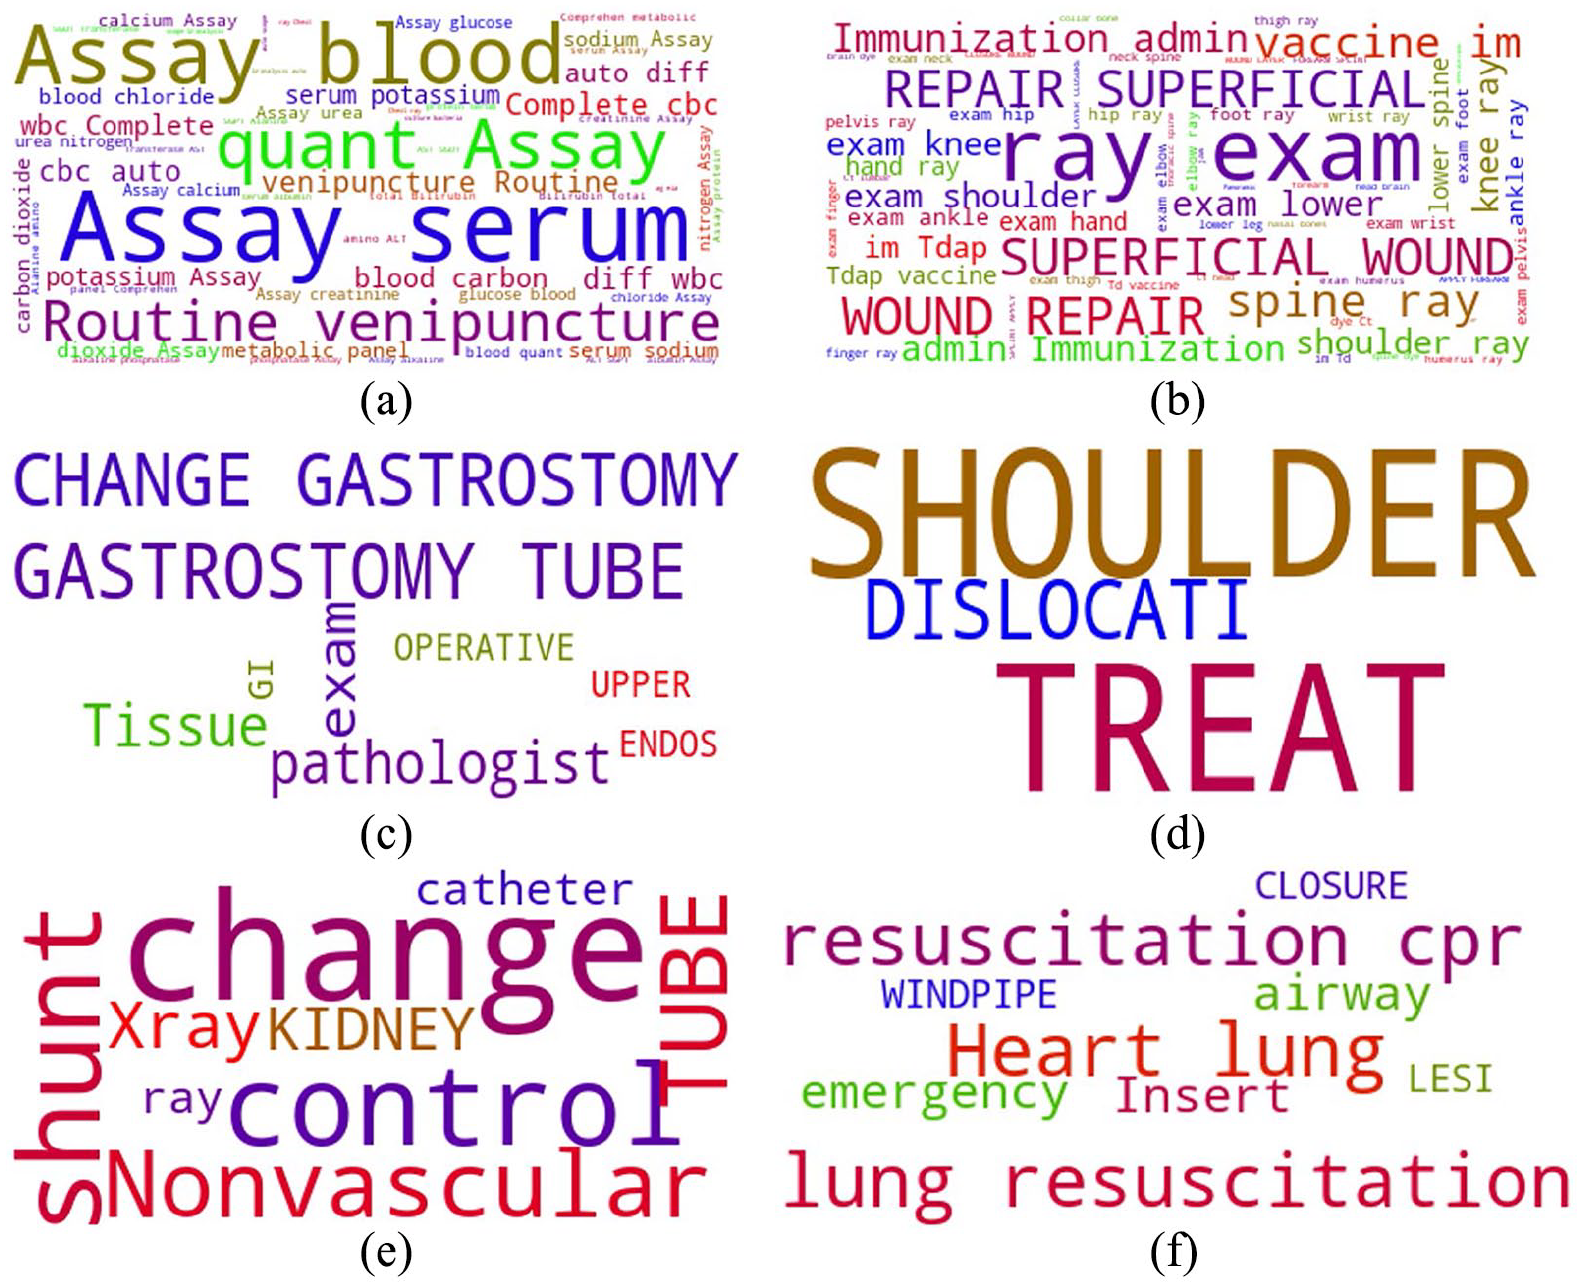
Pattern of care related to the network in Figure 3—(a) {36, 80, 81, . . .}: Lab tests. (b) {73, 12, 29, . . .}: Care of injuries. (c) {43, 49, 88}: Gastrointestinal care. (d) {99, 27, 23}: Care of shoulder conditions. (e) {50, 75}: Nephrostomy care. (f) {31, 92}: Care of cardiac arrest.
To interpret the communities in Figure 4, we can also apply the option of the Wordcloud technique. But, we also have an option of inferring the context of each community using the description of the related ICD-9-CM nodes. Hence, we can deduce that the largest community in this figure likely relates to MCS for medical or non-injury conditions given the context of ICD-9-CM nodes in this community (e.g. labels 2, 3, 4, 5, and 7). For example, node
Smaller communities in Figure 4, with two or three linked nodes, do not have any ICD-9-CM nodes associated with them. So, we can apply the Wordcloud technique to the descriptions of the related CPT nodes to deduct the pattern of care. The unlinked CPT nodes (i.e. 10, 25, 26, 28, 30, etc.) do not exhibit any pattern of care. We consider them rare MCS.
Results obtained by applying Algorithm 2
In this section, we present results from our PCA-based algorithm. In typical applications of PCA, a scatter plot of the components of the principal score matrix
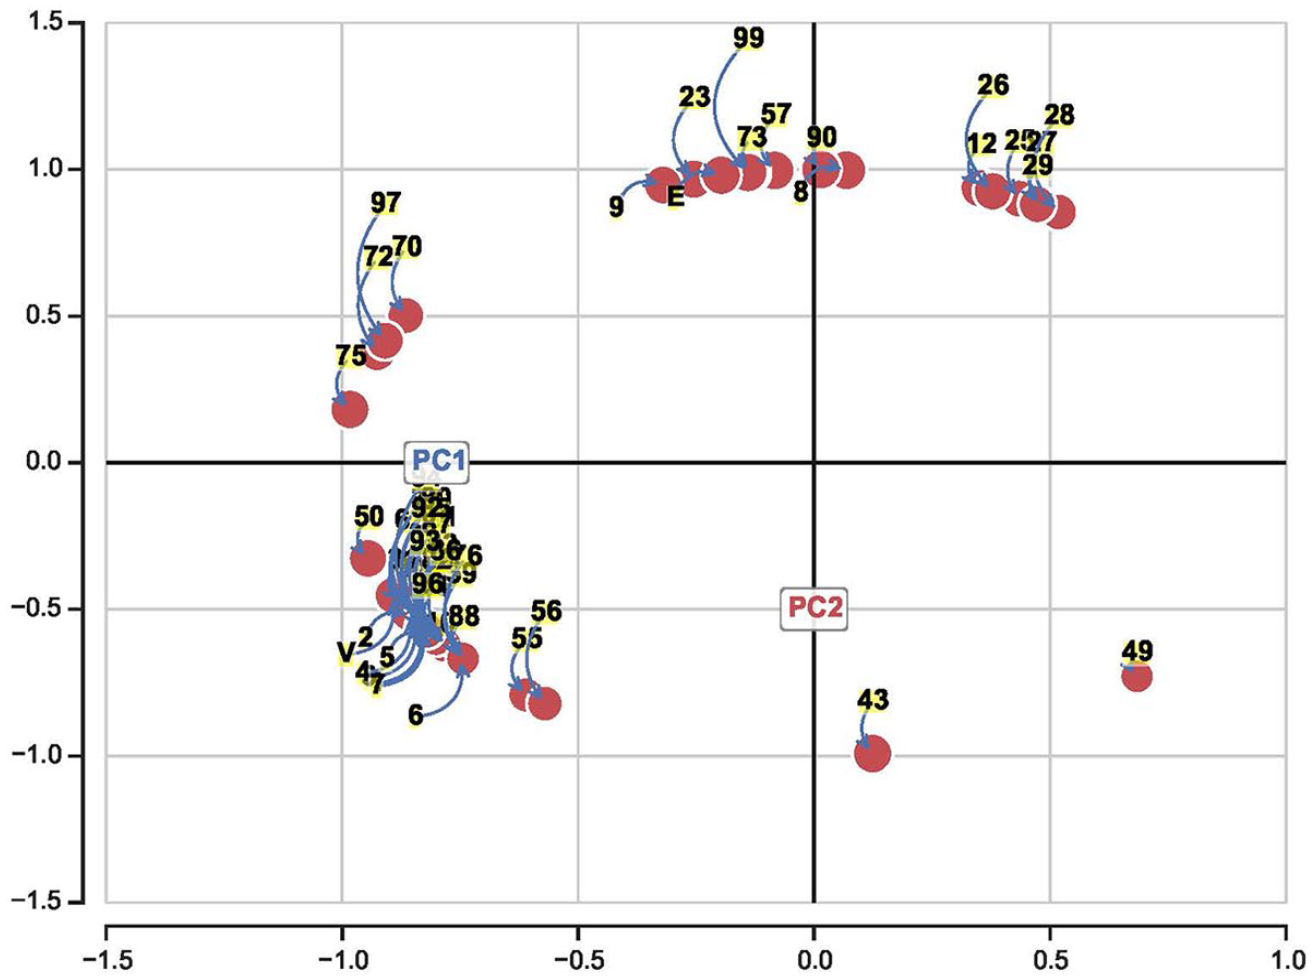
A scatter plot of the normalized PC1 and PC2 of matrix R, where matrix
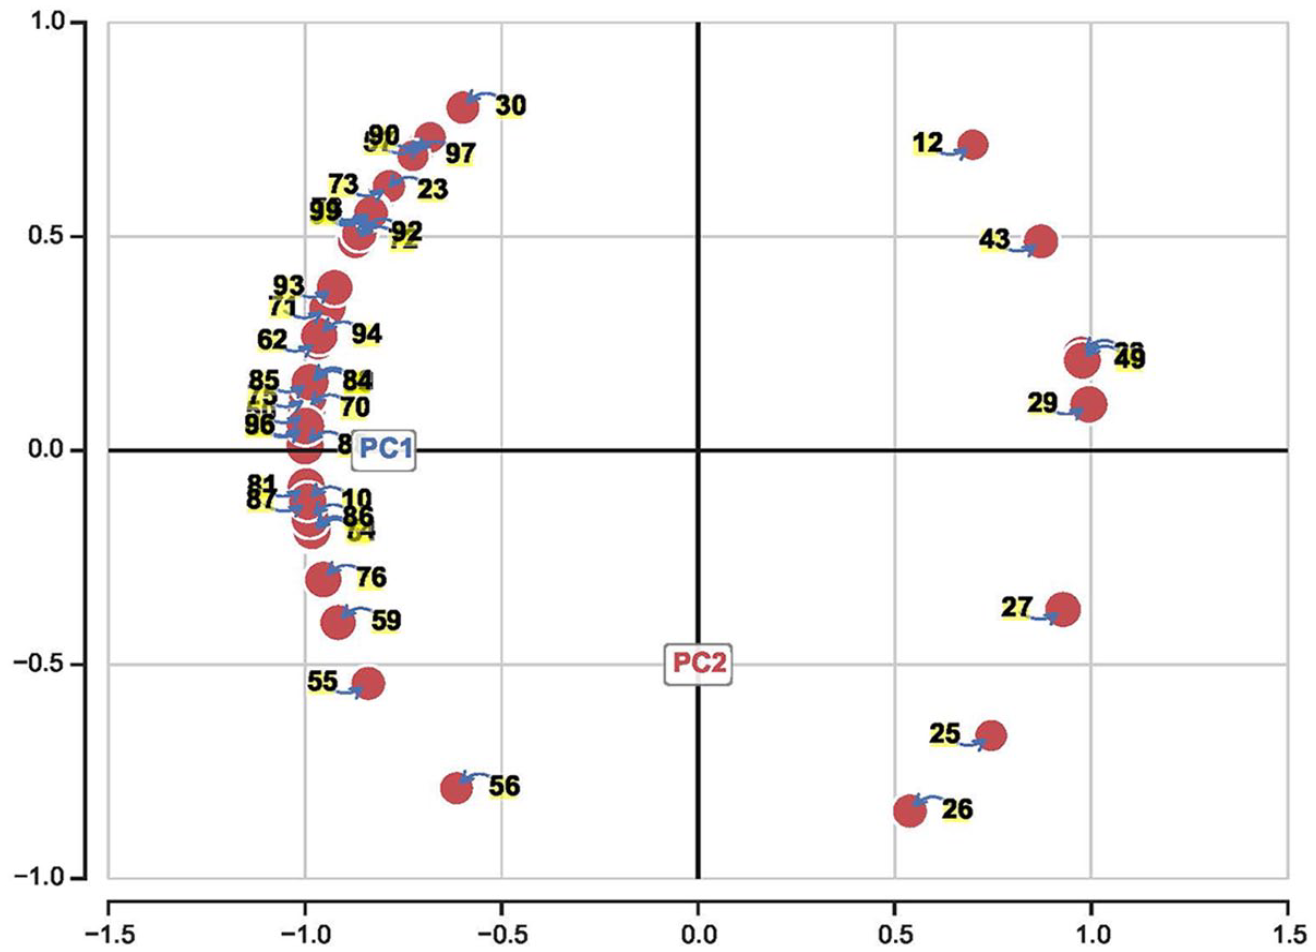
A scatter plot of the normalized PC1 and PC2 of matrix R, where matrix
A similar analysis can be carried out to detect the pattern of care in the communities of Figure 7.
From our experience, scatter plots from matrix
In addition to attempting to detect communities of MCS using scatter plots, we also suggest employing radar charts. To demonstrate this idea, we have plotted a few components of matrix
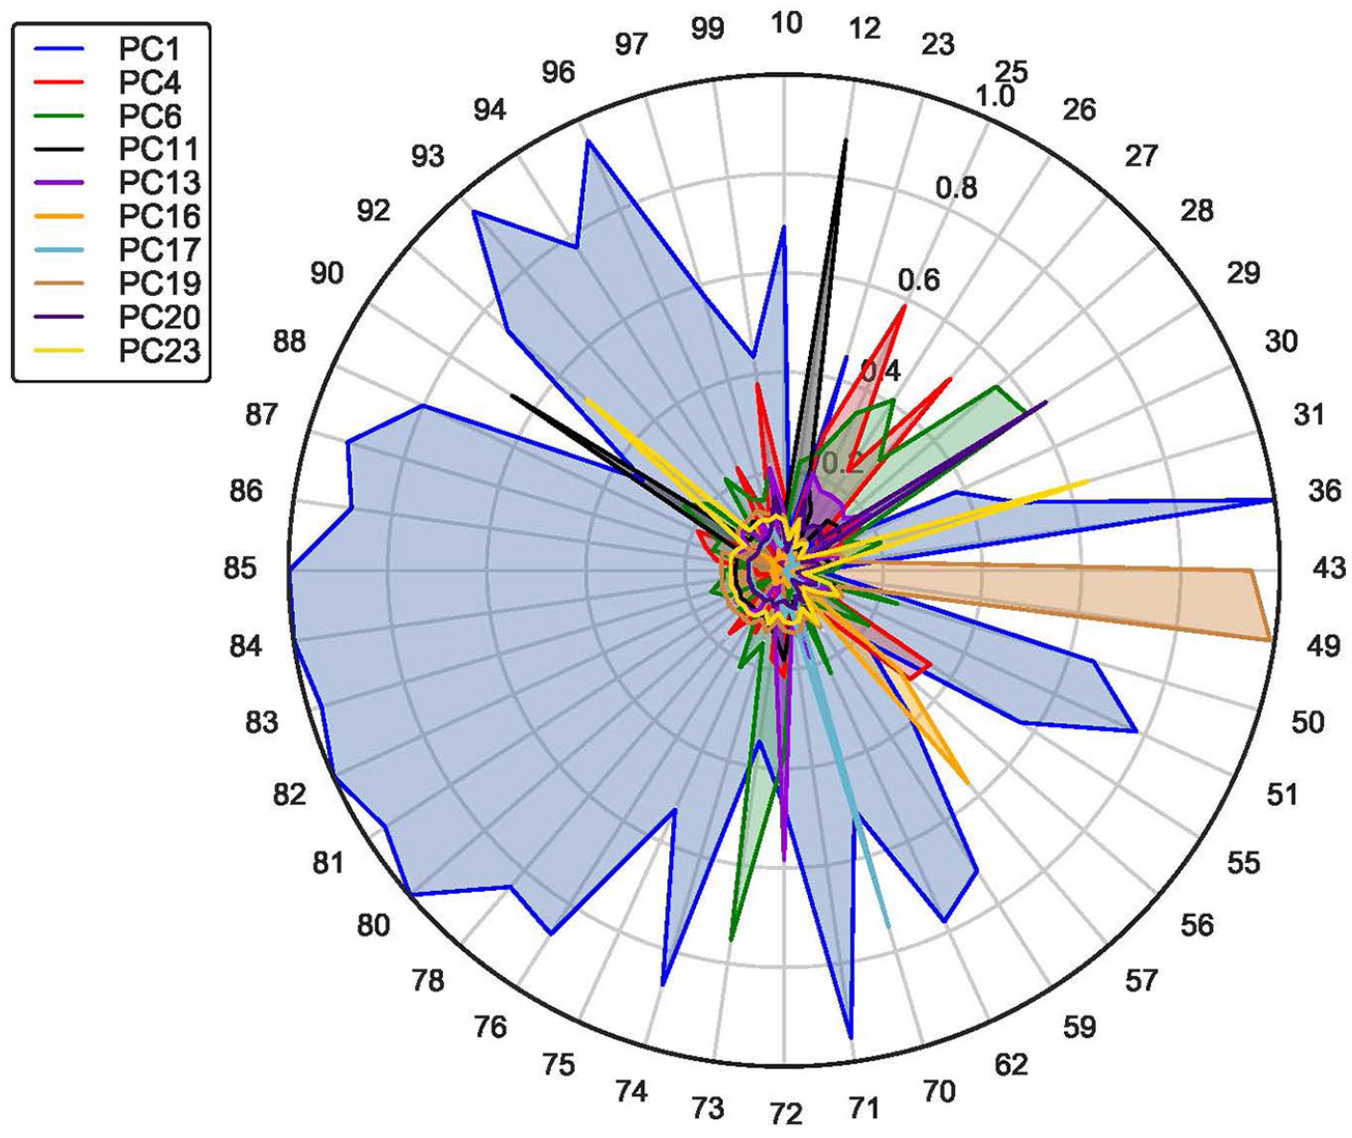
Radar charts portraying a few components of matrix
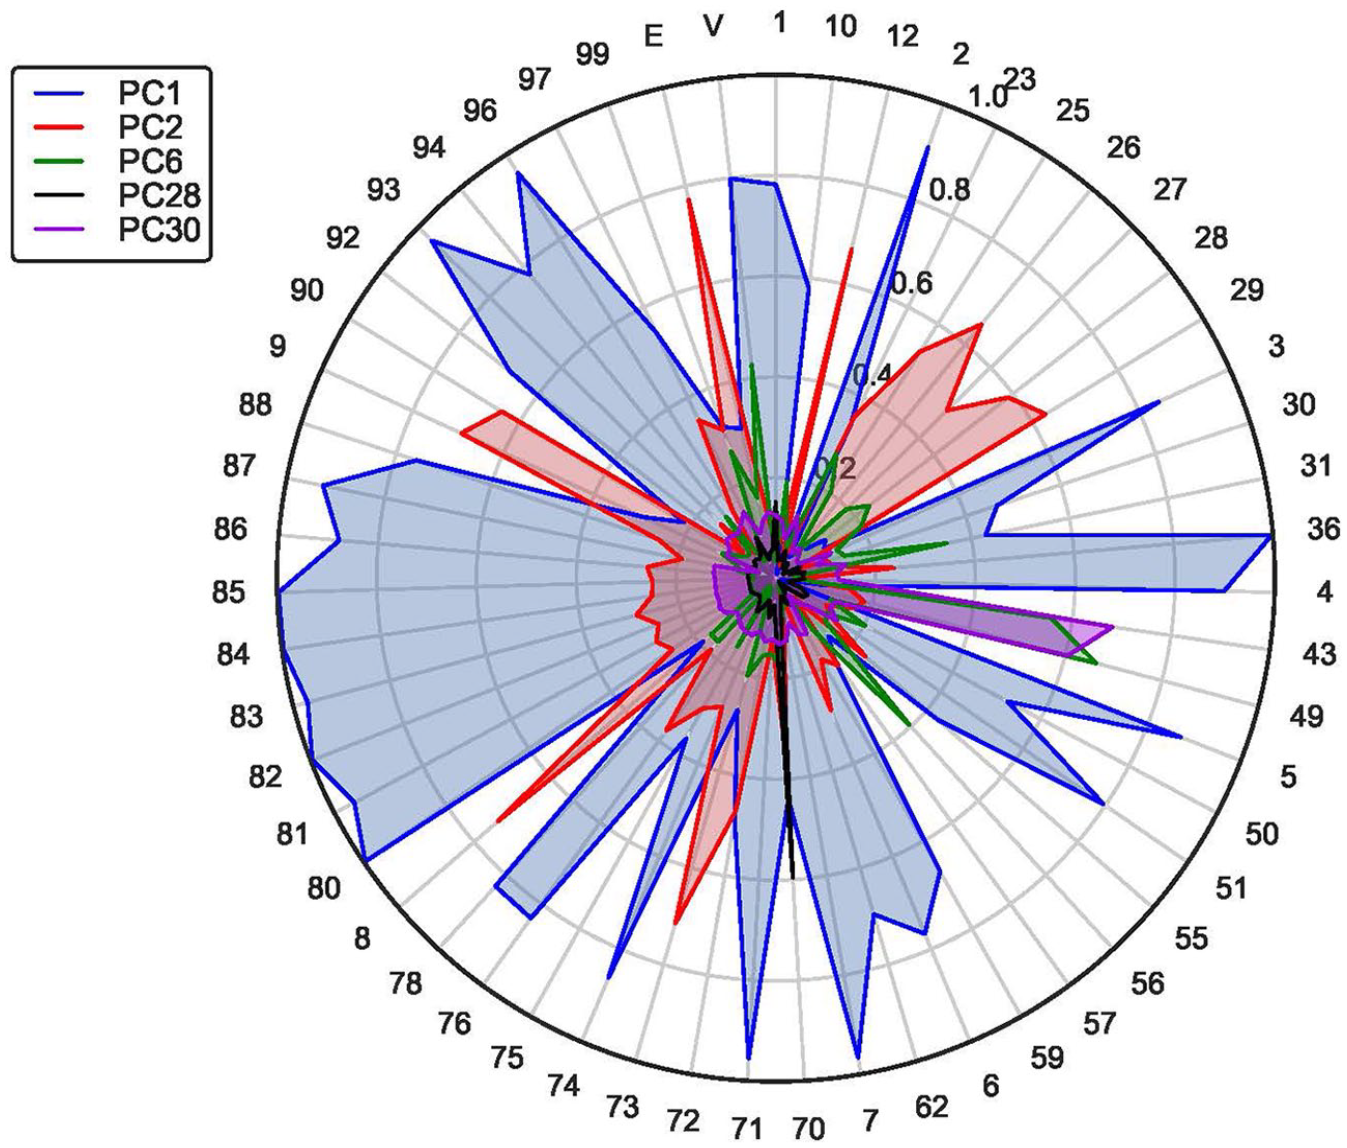
Radar charts portraying a few components of matrix
To visualize the communities in the radar charts, we color-code the components. Each distinct color represents a particular community. When the components overlap, the highest loading takes precedence. The interpretation of the pattern of care would be as before. For example, regarding Figure 8, after applying the Wordcloud technique to the descriptions of the nodes of PC1, we deduce that this community incorporates diagnostic MCS for labs. Likewise, after applying the same technique, we conclude that PC11 relates to MCS for lacerations. Our conclusion can be justified by the fact that node 12 relates to suture repair, and node 90 relates to prophylactic immunization. Both PC4 and PC6 in Figure 8 relate to the care for the musculoskeletal injuries, whereas PC19 relates to MCS for gastrointestinal conditions. Other components of Figure 8 can be interpreted using the same approach.
Regarding Figure 9, we can conclude that PC1 incorporates MCS for treating or diagnosing injuries, since attributes 8, 9, and E tend to be the first characters of ICD-9-CM codes that represent injuries. Likewise, given that attributes V, 1, 2, 3, 4, 5, 6, and 7 tend to be the first characters of ICD-9-CM codes for medical conditions, we can deduce that PC2 relates to the diagnostic or therapeutic MCS for medical conditions.
We want to emphasize that the components of Figure 9 (e.g. PC1) are not related in any way to the components in Figure 8 (e.g. PC1) since different data sets were used to derive them. The simply share the same generic names as discussed earlier.
Remark 1
Unlike in traditional scatter diagrams, where only two components are typically visualized at a time, radar charts allow for the visualization of several components at once. Indeed, we can plot all qualifying components of matrix
Practical implications of our research
Our research builds on existing SNA and PCA mathematical theories and introduces new algorithms to help health care practitioners visualize communities of MCS and assess the pattern of care. One practical implication is that by knowing typical patterns of care, health care managers may be able to use this information to better coordinate and schedule resources to provide needed services. The latter effort may contribute to the efficiency of medical care delivery. Another practical implication is that clinical experts may be able to confirm adherence to existing protocols of medical care. For example, if services
Besides the application in health care settings, our algorithms could also be applied to the creation and analysis of any network using an indicator or incidence matrix of interest. We particularly believe that our approach of generating matrix
Limitations and future research
Our research was limited to a network of MCS from a single medical facility. As a result, we are unable to generalize our findings regarding particular communities of services. For future research, we would like to extend our work to multiple facilities and assess similarities in the clinical protocols. In addition, we intend to evaluate the effects of the communities of MCS on quality outcomes and medical costs. On the technical level, we plan to investigate the parity between Algorithm 2 and spectral clustering algorithms that use k-mean. Our preliminary results indicate that the number of communities from Algorithm 2 could serve as the input number of k-clusters in spectral clustering algorithms.
For the researcher interested in expanding this work, a convenient problem to work on relates to how adjacency matrices of MCS converted into distance matrices affect relationships in the network. From the experiments that we ran, with limited data available to us, we have found that relationships do change, but have not yet established theoretical reasons or assessed practical implications of the resulting communities.
Conclusion
In this research, we introduced techniques for constructing a network of MCS by creating an indicator matrix and then converting it into a weighted adjacency matrix. From there, we developed algorithms to generate a neighborhood graph and a loading matrix to allow for the detection of communities of services. To interpret the context of each community, we proposed applying a Wordcloud technique to find the pattern of care in the descriptions of MCS in the network. Another pattern detection technique that we suggested was adding secondary nodes into the network and then conjecturing the meaning of a community from the descriptions of these new nodes. We demonstrated how to implement our algorithms using the data from an ED in New York State. From this ED example, we showed how to generate and visualize communities of services using radar and scatter diagrams. The findings from this study indicate that our algorithms could potentially help clinical experts detect deviation from either existing protocols of care or administrative norms.
Footnotes
Appendix 1
In this appendix, we present a detailed example of how to apply our proposed SNA and PCA algorithms. We still use the same data from an ED of a hospital in New York State, but this time consider a smaller network to generate matrices that can fit on a single page. Accordingly, we only select the first character of CPT codes to label main nodes. As before, we select the first character of ICD-9-CM codes to label secondary nodes. We pad CPT nodes with zeros to distinguish them from ICD-9-CM nodes. For example, the first character of a CPT code 21010 is 2, and we pad it as
From this matrix
Declaration of conflicting interests
The author(s) declared no potential conflicts of interest with respect to the research, authorship, and/or publication of this article.
Funding
The author(s) received no financial support for the research, authorship, and/or publication of this article.