
Abstract
Coronary artery disease is one of the most prevalent chronic pathologies in the modern world, leading to the deaths of thousands of people, both in the United States and in Europe. This article reports the use of data mining techniques to analyse a population of 10,265 people who were evaluated by the Department of Advanced Biomedical Sciences for myocardial ischaemia. Overall, 22 features are extracted, and linear discriminant analysis is implemented twice through both the Knime analytics platform and R statistical programming language to classify patients as either normal or pathological. The former of these analyses includes only classification, while the latter method includes principal component analysis before classification to create new features. The classification accuracies obtained for these methods were 84.5 and 86.0 per cent, respectively, with a specificity over 97 per cent and a sensitivity between 62 and 66 per cent. This article presents a practical implementation of traditional data mining techniques that can be used to help clinicians in decision-making; moreover, principal component analysis is used as an algorithm for feature reduction.
Keywords
Introduction
The prevalence of chronic diseases has increased due to poor eating habits, sedentary lifestyles, and the progression of ageing, thereby presenting an increasing burden upon individuals. 1 According to the Organization for Economic Cooperation and Development, chronic diseases account for major causes of deaths and health problems: 60 per cent (about 35 million) of the world’s population is estimated to die due to chronic diseases. This epidemiological phenomenon has serious repercussions on life expectancy and its quality, thereby incurring an increasing economic burden upon healthcare systems and societies. 2 The rise of chronic diseases, alongside the need to improve the effectiveness, equity, and sustainability of healthcare systems, has required innovation among care services.3–5 Many approaches have been proposed for the treatment and management of chronic diseases,6,7 and innovative methodologies have been introduced to reduce waste in healthcare processes8–10 and support decision-makers in the evaluation of technologies and in the choice of appropriate therapies.11,12 Healthcare is rapidly generating big data (so-called both for its volume and its complexity and range) that can be exploited to derive new knowledge regarding patient care, compliance, and various regulatory requirements. 13 Researchers addressing these issues with data in the health sector belong to the field of health informatics: it is described as the union of the healthcare, computational, and information sciences in the study of healthcare information. 14 It includes acquisition, storage, manipulation, and retrieval of data to enable healthcare suppliers to deliver better results. 15 This set of tools and procedures is well-known in literature as big data analytics. This field is growing and has the potential to provide useful insights for healthcare systems. Currently, big data analytics is used to predict clinical decisions made by physicians and the outcomes of clinical activity for conditions based on patient features. 16 Data mining provides a variety of techniques for interpreting medical big data that can be used in patient care. 17 It helps in the analysis of clinical data stored in a shared information system and aims at identifying effective, useful, and generalizable relationships therein by combing massive datasets to elucidate patterns that may otherwise be too subtle or complex for traditional analytical methods to detect. 18
There are several examples in the literature that encourage the application of data mining to different fields of medicine to discover hidden patterns or new information from clinical data.19,20 Specific applications of machine learning are present in radiology; for example, Romeo et al. 21 used texture analysis to characterize adrenal lesions. In neurology, data mining techniques were applied to data collected from Parkinson’s patients.22 –24 Other applications were developed for paediatric patients affected by developmental delays 25 and for orthopaedic patients to predict rehabilitation outcomes. 26 The support provided by data mining in healthcare must be taken into consideration not only for its assistance with clinical decision-making but also for its contribution to the assessment of physical and instrumental examinations performed for patient diagnoses. This evaluation allows health facilities to save money and avoid waste from the requisition of unnecessary patient examination.
Coronary artery disease
Coronary artery disease (CAD) is a multilevel process that originates from a combination of focal obstructive, diffuse, and microcirculatory alterations throughout the major coronary arteries supplying blood flow to the heart muscle. 27 CAD is one of the leading causes of death in the modern era, and according to the American Heart Association, 2300 Americans die because of cardiovascular diseases each day 28 – an average of one death every 38 s. Moreover, the European Heart Network stated in its report that CAD killed about 4 million people in Europe in 2017, constituting 45 per cent of all-cause mortality. 29 Due to the chronic nature of the disease and numerous consequential complications, there is a large volume of clinical data related not only to the number of patients but also to the number of variables per patient. Physicians have to interact with richer quantitative data that may contain a variety of instrumental parameters requisite for long-term data storage and biochemical data, such as total cholesterol, glycaemia, or hemoglobina glicada. 30 Cardiovascular disease management introduces a high number of variables per patient and necessitates the evaluation of large datasets to identify hidden patterns, compare information, and eventually make predictions. 31 Currently, there is enough awareness of both CAD pathology and data mining algorithms to strongly encourage the design and implementation of specific applications, as suggested by Chitra and Seenivasagam. 32
Data mining was feasible within the daily process in institution in which clinical and instrumental variables are systematically registered to conform the body of information available for each subject at the time of diagnostic test. Therefore, we support the notion that data mining techniques can be applied in any context where systematic recording of patient-pertinent information is conducted. Considering the large amount of data, machine learning would be advantageous for clinicians who would benefit from systems trained with millions of data, especially for risk stratification of patients with suspected CAD, avoiding further unnecessary diagnostic tests.
In this article, we tested the use of a data mining application for the classification of patient with suspected or known CAD. As such, a linear discriminant analysis (LDA) algorithm was applied to patients with CAD exploiting features describing their state of health, and these results were compared to those obtained by using artificial features computed through principal component analysis (PCA). Different scores were computed: precision, recall, sensitivity, specificity, error, and accuracy. The data were acquired from anonymized information of patients who underwent stress single-photon emission computed tomography myocardial perfusion imaging (MPI) at the University Hospital ‘Federico II’ of Naples, Italy.
The rest of the article is organized as follows. Section ‘Related work and aim’ reviews the literature describing data mining in cardiology and describes our contribution to the literature. Section ‘Materials’ introduces the dataset. Section ‘Methods’ discusses the tools and algorithms used. Our results are presented in section ‘Results’, and finally, discussion and conclusion are found in section ‘Discussion and conclusion’.
Related work and aim
We found different articles that exploited data mining to reveal in time the occurrence of heart disease in patients affected by CAD or to classify, according to diagnostic parameters, the level of clinical risk for patients. Some researchers focused only on the application of one algorithm, such as Shouman et al., 33 who applied k-nearest neighbour on a benchmark dataset, and Chaurasia, 34 who used different types of decision trees. Conversely, Motwani et al. 35 investigated the feasibility and accuracy of machine learning to predict 5-year all-cause mortality in patients undergoing coronary computed tomographic angiography (CCTA) and compared the performances to the existing clinical or CCTA metrics. Some classification procedures have been proposed by researchers that compare different techniques36 –39 or assess cardiovascular risk based on machine learning.40 –42 Another study investigated heart valve disease with the adaptive neuro-fuzzy inference system. 43 Weng et al. 40 illustrated a prospective cohort study in the United Kingdom related to the application of data mining on patients with cardiovascular pathology, while Rajkumar and Reena 44 conducted the classification of patients with heart diseases based on supervised machine learning algorithms, providing their accuracy, time taken to build the algorithm, and a comparison of the results. Soni et al. 45 compared different algorithms using artificial data of patients with heart disease made the same comparison using real data.
There are other studies in the literature that highlight the application of LDA: for example, Marcos et al. 46 used spectral features in nocturnal polysomnography; Luo et al. 47 included ultrasound (US) elastography features to detect thyroid nodules; and Yang et al. 48 predicted CAD through a combination of LDA and a fuzzy inference method that are described later in the ‘Discussion and conclusion’ section. Giri et al. 49 used different classifiers exploiting features extracted by PCA, yet they started from features related to heart rate signals. Here, the primary objective was to provide an automatic estimation of patient clinical outcomes to aid clinicians in their decision-making; moreover, the comparison detailed here enhances the importance of feature reduction, proving the equivalence of the two approaches.
As a result of these investigations, we found that many studies have been focused on the application of different data mining techniques in cardiology; moreover, PCA and LDA have been used for a wide range of disciplines and cardiac application.46,47 Nevertheless, no studies were found describing the application of the LDA and PCA algorithms to CAD – particularly, no comparison exists between LDA and the combination of LDA and PCA regarding CAD diagnosis. Moreover, Lakshmi et al. 50 showed that LDA analysis is among the most accurate strategies that can be used in the heart disease classification, and Marcos et al. 46 implemented the combination of PCA and LDA successfully.
In this work, we used supervised data mining techniques to analyse a cohort of 10,265 patients who underwent stress single-photon emission computed tomography MPI at the Department of Advanced Biomedical Sciences of the public University Hospital ‘Federico II’ of Naples. Note that cardiopathic patients are always characterized by conventional risk factors, that is, the presence of diabetes, family history of CAD, hypertension, and so on. 51 Therefore, the aim of this study is to classify a large dataset of patients with CAD as either healthy or presenting this pathology through LDA by using conventional risk factors (age, gender, history of CAD, diabetes, etc.), as suggested by Kurt et al., 52 who studied the classification of CAD by comparing different non-LDA algorithms. Here, the LDA algorithm was computed both on clinical features, provided and suggested by clinicians, and principal components (a linear combination of clinical features) obtained to reduce the previous number of features. These results were compared to highlight the effectiveness of the proposed methodology.
Materials
Population characteristics
The dataset includes 10,265 patients with suspected or known CAD that were evaluated for myocardial perfusion defect at the Department of Advanced Biomedical Sciences, University Hospital Federico II of Naples, between 2004 and 2017. As part of their initial check-up, clinicians collected information on traditional cardiovascular risk factors (age, gender, blood pressure, smoking history, serum cholesterol, family history of CAD, resting ECG characteristics, diabetes and its complications, ECG stress testing). A known history of systolic blood pressure greater than 140 mmHg or the use of antihypertensive medication implicated hypertension. Hypercholesterolemia was defined based on either a known history of dyslipidaemia or treatment with cholesterol-lowering medication. A previous diagnosis of diabetes or treatment with oral hypoglycaemic drugs or insulin classified patients as diabetic. Only first-degree relatives were considered to assess a positive family history of CAD. Key population characteristics are presented in Table 1, with means and standard deviations. Risk factor occurrences are presented in Table 2.
Population characteristics.
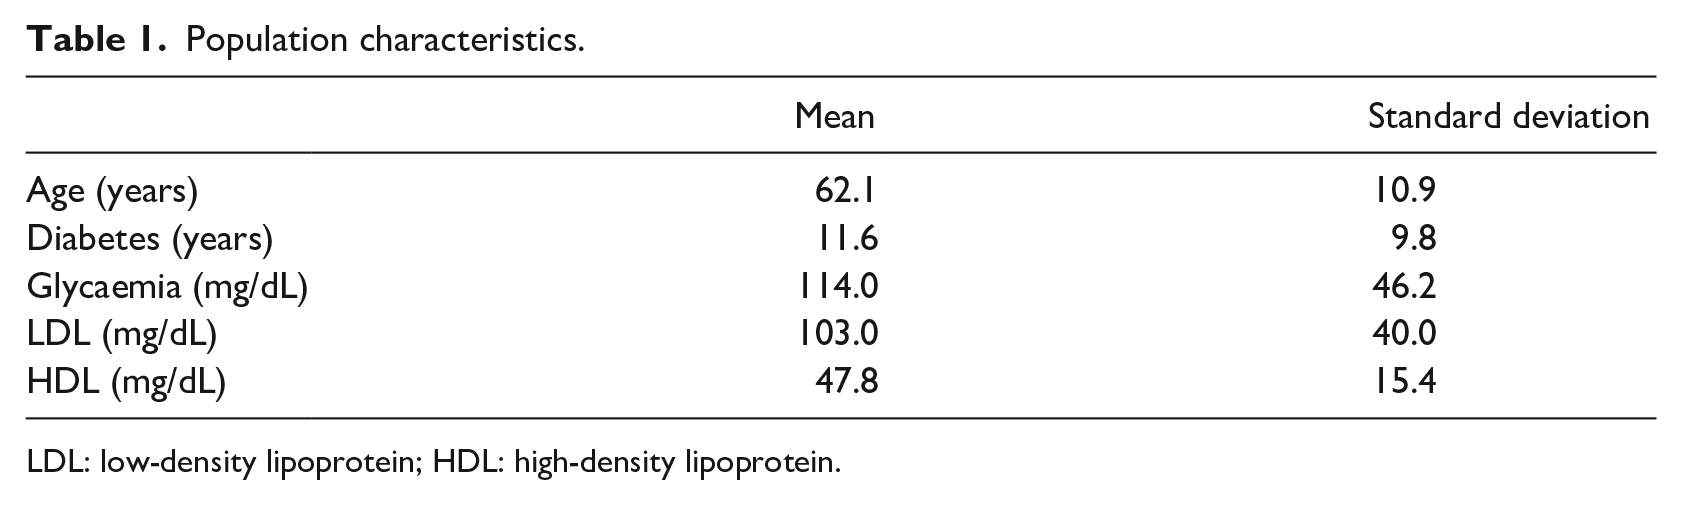
LDL: low-density lipoprotein; HDL: high-density lipoprotein.
Population characteristics: occurrences.
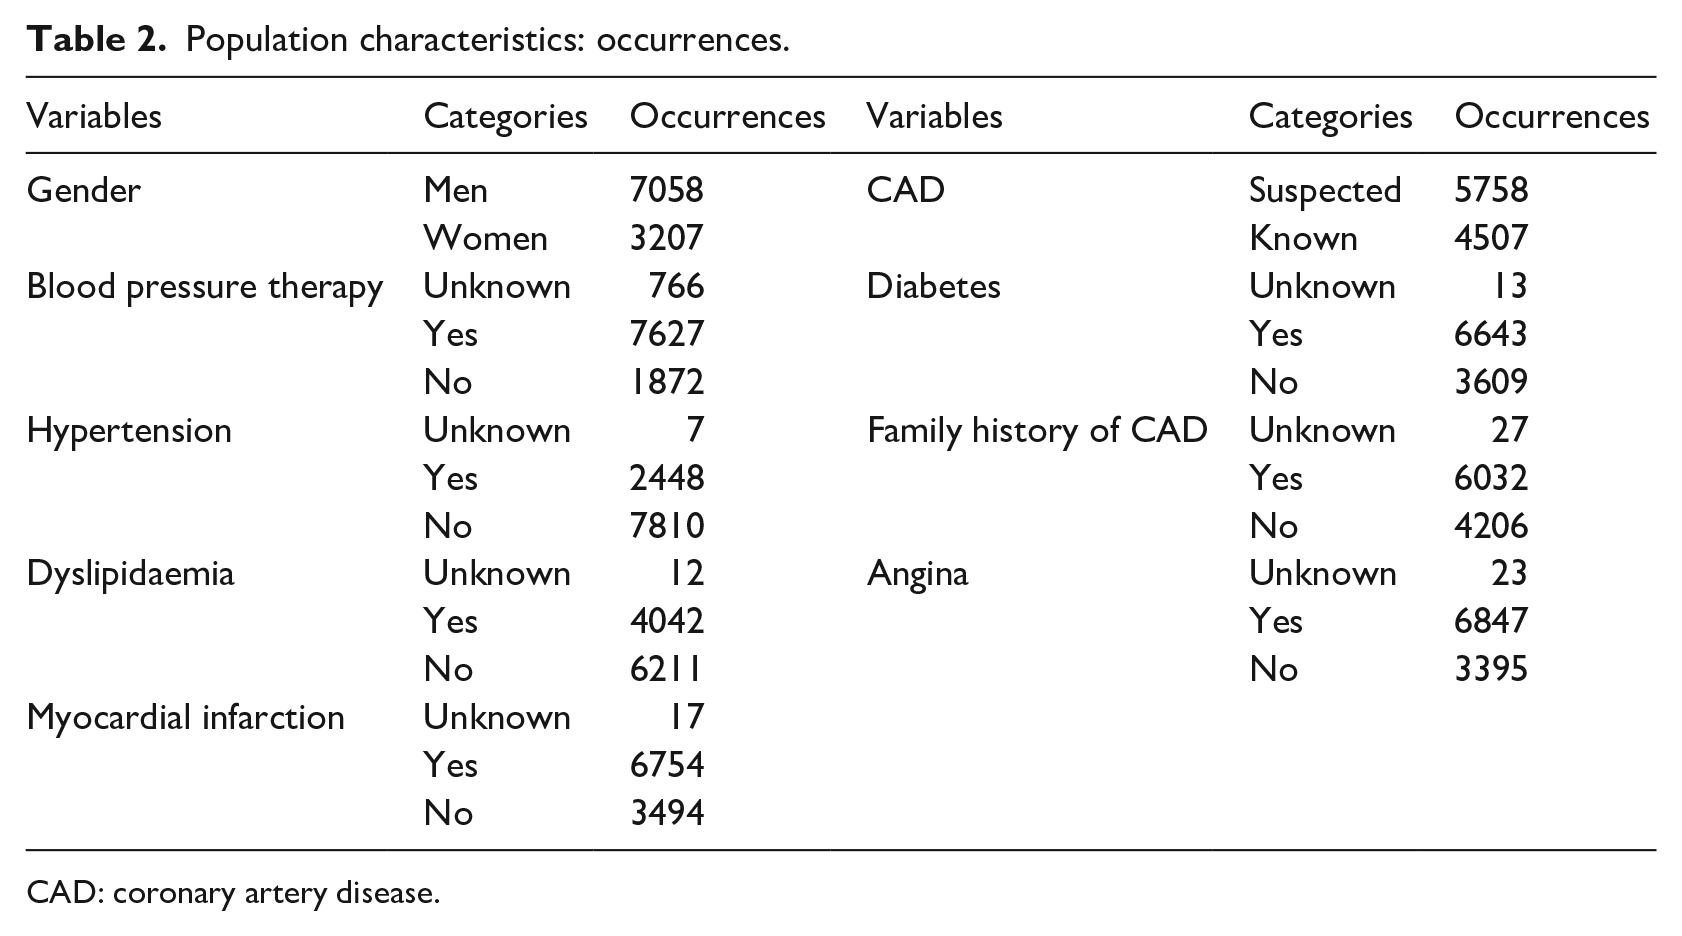
CAD: coronary artery disease.
Design of the dataset
The dataset was created using Excel by clinicians who have inserted patients one-by-one for 15 years. To enable the connection between the source of data and each possible software that can analyse data, we designed a database using PostgreSQL, a SQL Database Management System (DBMS) that allows to manage the relational database. It is well known that the integration between data mining systems and DBMS or spreadsheet visualization tools is fundamental in exploring databases. Holsheimer et al. 53 have showed that the use of an efficient relational DBMS can help with optimizing the identification of association rules.
Methods
The algorithm was implemented through the combination of the Knime analytics platform and R software.54,55
Tools
The extension of R programming language through packages was used: here, the MASS package was installed to use its ‘lda’ function. 56 In the literature, various tools are used for data analysis; our team used Knime analytics platform, whose utility is widely acknowledged in literature. 57 Knime Analytics Platform was created for the cheminformatics community, but it has been adapted over the years within other disciplines. 58 Moreover, the Weka data mining environment and additional R plugins offer access to a vast library of statistical routines. 59 It has been used in different research applications, such as in neurology, radiology, eye-related pathologies, and cardiotocography.60–63
PCA
PCA is a linear dimensionality reduction technique that can be used to reduce a large set of variables to a smaller set that still contains most of the original information. 64 It seeks a linear combination of variables such that the maximum variance can be extracted. PCA then removes this variance and seeks a second linear combination, which iteratively explains the maximum proportion of the remaining variance. This is called the principal axis method, which results in orthogonal (uncorrelated) factors. Moreover, it involves the computation of eigenvalues and eigenvectors of covariance matrices, followed by the sorting of these eigenvectors in the descending order of their eigenvalues and, finally, the projection of the actual data into the directions of sorted eigenvectors.
LDA
LDA was introduced for the first time by Fisher 65 in 1936; today, it remains a well-established statistical-based pattern classification method. Regarding two-class problems, the LDA method identifies a projection vector to maximize between-class scatter matrix while minimizing within-class scatter matrix in the feature space. 66 The aim here is to find a linear function
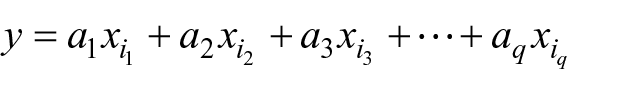
where

is a vector of coefficients that has to be determined, while

are the patients and

are the features.
To estimate the mean and variance in the dataset, the following assumptions, related to the multivariate analysis of variance, are necessary:
Normality: independent variables are normal for each level of the grouping variable;
Independence: the sampling is assumed to be random, and a sample’s score on one variable is assumed to be independent of scores on that variable for all other participants;
Collinearity: a high correlation between variables can decrease the predictive power.
Evaluation metrics
The following scores, identified as significant by the literature,67,68 were used:
Accuracy: the ratio between correct predictions and total number of records;
Error: the ratio between wrong predictions and total number of records;
Recall: the number of positive patterns that are correctly classified;
Precision: the number of positive patterns correctly predicted from the total predicted patterns in a positive class;
Sensitivity: true positive rate, it assesses the effectiveness of the algorithm on a single class (the positive one);
Specificity: true negative rate, it assesses the effectiveness of the algorithm on a single class (the negative one).
Results
Data pre-processing
Evidently, our dataset underwent feature selection – a critical pre-processing step in machine learning that is effective in reducing dimensionality, removing irrelevant data, increasing learning accuracy, and improving result comprehensibility. To reconcile the high presence of missing values in the present work, empty fields were substituted with the mean values of those analysed through a node called ‘missing values’. The selection of the most significant features was made through the calculation of a matrix of correlation among variables through the nodes ‘linear correlation’ and ‘correlation filter’: a threshold was chosen to exclude those that were too correlated and did not add information to the algorithms, as mentioned in the ‘Methods’ section. In conclusion, the algorithm included the class and the 22 variables.
Scores
The present dataset was divided into two parts: the model was fitted on a training set and the results were obtained on a test set. The variables were used to obtain the results presented in the first row of Table 3. Starting from the same variables, PCA was applied to identify 10 principal components. After excluding the 22 old features, principal components were used to perform the same previous classification, and the results are reported in the second row of Table 3.
Scores.
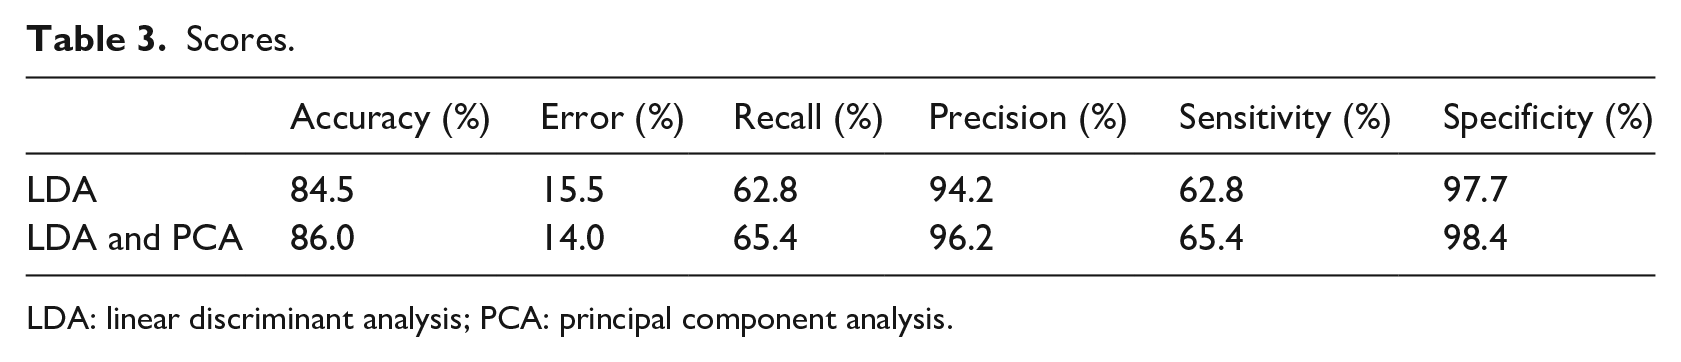
LDA: linear discriminant analysis; PCA: principal component analysis.
The obtained classification accuracy was 84.5 per cent using only LDA and 86.0 per cent using the combination of LDA and PCA. Recall and sensitivity did not show high percentages (below 70%), while specificity and precision had better results – 94.2 and 97.7 per cent, respectively, from only LDA, and 96.2 and 98.4 per cent, respectively, from combined LDA and PCA.
Discussion and conclusion
We acquired clinical and instrumental data from patients admitted to the Department of Advanced Biomedical Sciences at the University Hospital of Naples ‘Federico II’. Clinicians then identified some variables as useful, and the data were pre-processed as described. This analysis was implemented in two separate stages. LDA was first applied alone to classify the patients into two groups: healthy and pathological. Then, PCA and LDA were used together to reduce the number of features and reclassify the patients. Actually, there are too many variables involved when assessing the health status of a patient with cardiac issue; thus, the application of PCA allowed a summarization in a limited number of attributes. The key scores used (accuracy, error, precision, recall, sensitivity, and specificity) were found to improve under the combined PCA and LDA approach.
Extant studies in literature describe additional applications of LDA. Marcos et al. 46 showed an accuracy of 93 per cent using spectral features in their signal analysis (nocturnal polysomnography); Luo et al. 47 analysed US elastography features to classify thyroid nodules and obtained a discriminant score of 86 per cent; and Yang et al. 48 combined a fuzzy inference method and LDA to predict CAD with an accuracy of 80.2 per cent. Since a comparison between different applications is not always fair and possible, it is necessary to stress that our results are perfectly in accordance with literature describing the prospective applications of LDA. The power of this algorithm is also demonstrated when compared to the work of Kurt et al., 50 who attempted to classify patients both with and without CAD. Their accuracy here was below 80 per cent for each trial, and their numbers of both patients and features were limited. The results from this analysis are strongly correlated with the quality of the data, with scores decreasing where data quality is poor. Improving the scores obtained with the LDA and PCA algorithms would encourage its use in health facilities to support clinicians with decision-making. Nevertheless, Jaarsma et al. 69 conducted a meta-analysis to determine the diagnostic accuracy of the three most commonly used non-invasive MPI modalities, single-photon emission computed tomography, cardiac magnetic resonance, and positron emission tomography perfusion imaging for the diagnosis of obstructive CAD. They, respectively, obtained a sensitivity of 88, 89, and 84 per cent and a specificity of 61, 76, and 81 per cent. Therefore, the machine learning would allow clinicians to obtain comparable to those obtained through the daily clinical practice, despite using only anamnestic variables and none of those obtained through instrumental exams. Not only is this method likely to apply to patients’ diagnoses but it also supports clinicians in the formulation of prognoses through numerical predictive algorithms. The possibility to predict diagnosis from a few variables (perhaps restricted to anamnestic ones) would enable health facilities to spend less money on expensive exams, while nonetheless obtaining reliable diagnoses. Moreover, not only does the analytic platform provide simpler data analysis but it also requires less time to perform this analysis, as there is little demand for programming experience. Clearly, one limitation of the study was the quality of data. Another limitation stems from the quality of the pre-processing pipeline. The addition of further pre-processing tools may benefit the reported methodology; a wrapper method could increase our scores, as could cross-validation (either leave-one-out or K-fold). Indeed, it may be possible in the future to use other methods to analyse these data and apply the same methodology to other clinical fields, thereby improving scores that could be obtained through the implementation of LDA combined with PCA. Following our implementation, PCA deserves further investigation: its use allows for a significant reduction of features while still obtaining an equal or higher set of scores. This notion implicates the method for better management of large quantities of data and faster analyses. PCA, as future development, could be applied in other healthcare contexts to reduce the number of features, while providing ‘new ones’ (principal components) that are as valid as original ones.
Footnotes
Acknowledgements
The authors wish to thank Alec Shawn for his contribute as regards “grammar and spell check”. This work has been realized thanks to the collaboration of the Department of Advanced Biomedical Sciences of the University Hospital “Federico II” of Naples. The authors wish to thank Sabrina De Vita, Francesca D’Agostino, Giuseppina Toscano and Tania Di Monda for their valuable contribution to the implementation of data mining algorithm during their MS thesis. The work has been partially carried out under TablHealth [CUP B49J17000720008] project and AK12 s.r.l.”
Declaration of conflicting interests
The author(s) declared no potential conflicts of interest with respect to the research, authorship, and/or publication of this article.
Funding
The author(s) received no financial support for the research, authorship, and/or publication of this article.