
Abstract
This study aims to introduce as proof of concept a combination model for classification of prostate cancer using deep learning approaches. We utilized patients with prostate cancer who underwent surgical treatment representing the various conditions of disease progression. All possible combinations of significant variables from logistic regression and correlation analyses were determined from study data sets. The combination possibility and deep learning model was developed to predict these combinations that represented clinically meaningful patient’s subgroups. The observed relative frequencies of different tumor stages and Gleason score Gls changes from biopsy to prostatectomy were available for each group. Deep learning models and seven machine learning approaches were compared for the classification performance of Gleason score changes and pT2 stage. Deep models achieved the highest F1 scores by pT2 tumors (0.849) and Gls change (0.574). Combination possibility and deep learning model is a useful decision-aided tool for prostate cancer and to group patients with prostate cancer into clinically meaningful groups.
Keywords
Introduction
Prostate cancer (PCa) is one of the most diagnosed malignancies in men and the third reason for cancer-associated death in the United States. 1 Most patients with clinically organ-confined PCa are treated with radical prostatectomy (RPE) or radiotherapy, which provides excellent cancer control. 2 However, there is no consensus regarding the optimal management of locally advanced PCa. 2 The prediction of the pathologic stage of PCa before an intervention enables improved patient counseling and clinical decision making for treatment planning and risk stratification for novel clinical trials for those patients with more advanced and aggressive PCa. Recent studies have published algorithms and nomograms predicting the pathologic stage of patients with clinically localized PCa or Gleason score upgrading.3–10 However, these prediction models are not frequently used due to limitations in usability and applied computational approaches. The recent advance in artificial intelligence (AI) and computational capabilities facilitates nowadays robust pattern recognitions and data structure determination in large data sets, imaging, and genetics. Although the application of AI in medicine remains in its early stages, the integration of AI in medicine is opening a new avenue in disease care management. In the past, some studies have introduced different prediction models for advanced PCa using conventional machine learning.11–13 The multi-layer neural networks approach, also called as a deep neural network, is one of the deep learning approaches, and it has demonstrated very accurate results in recognizing images and determining genetic variations. Whether the deep neural network approach is applicable in developing prediction models for PCa is not clear. This study will stress this question and introduce a proof of concept for utilizing deep learning approaches to predict pathologic outcomes. Here, we are going to develop a prediction model for pathologic outcomes using preoperative data, unsupervised clustering, followed by supervised machine learning, and deep learning approaches. We aim to support the clinical decision by providing decision-aiding tools which can learn how to predict the outcome on changing and different data sets with high accuracy.
Material and methods
The development procedure of the classification model for PCa consists briefly of four steps (Figure 1). First, we utilized four different data sets representing the different conditions of data acquisitions in epidemiologic studies: prospective data acquisition and storage in an institutional data set, retrospective data acquisition and storage in an institutional data set, the single source information system,14,15 and a national epidemiologic cancer registry. In this way, we limited the risk of selection bias that can occur in each of these data sets. We then extracted data related to clinicopathological data before and after the removal of the prostate as a consequence of PCa for each patient. The second step performs multinomial multivariate regression analyses and Spearman correlation on variables to determine the associations between preoperative parameters and tumor progression. The third step determines the number of all possible combinations of these variables in silico and identifies these combinations in our data set. The data sets will then be unsupervised clustered by the number of combinations seen on the real data sets. The final step aims at the development of optimal deep neural network models to predict the cluster “the new class” by an arbitrary definition of the dimensions of hidden layers of neural networks. Furthermore, we assumed that the aggressiveness of the tumor is independent of age at diagnosis and race. Therefore, these features (i.e. age and race) were defined as noisy features for the deep neural network. Both these features were not considered for the combination and clustering analyses.
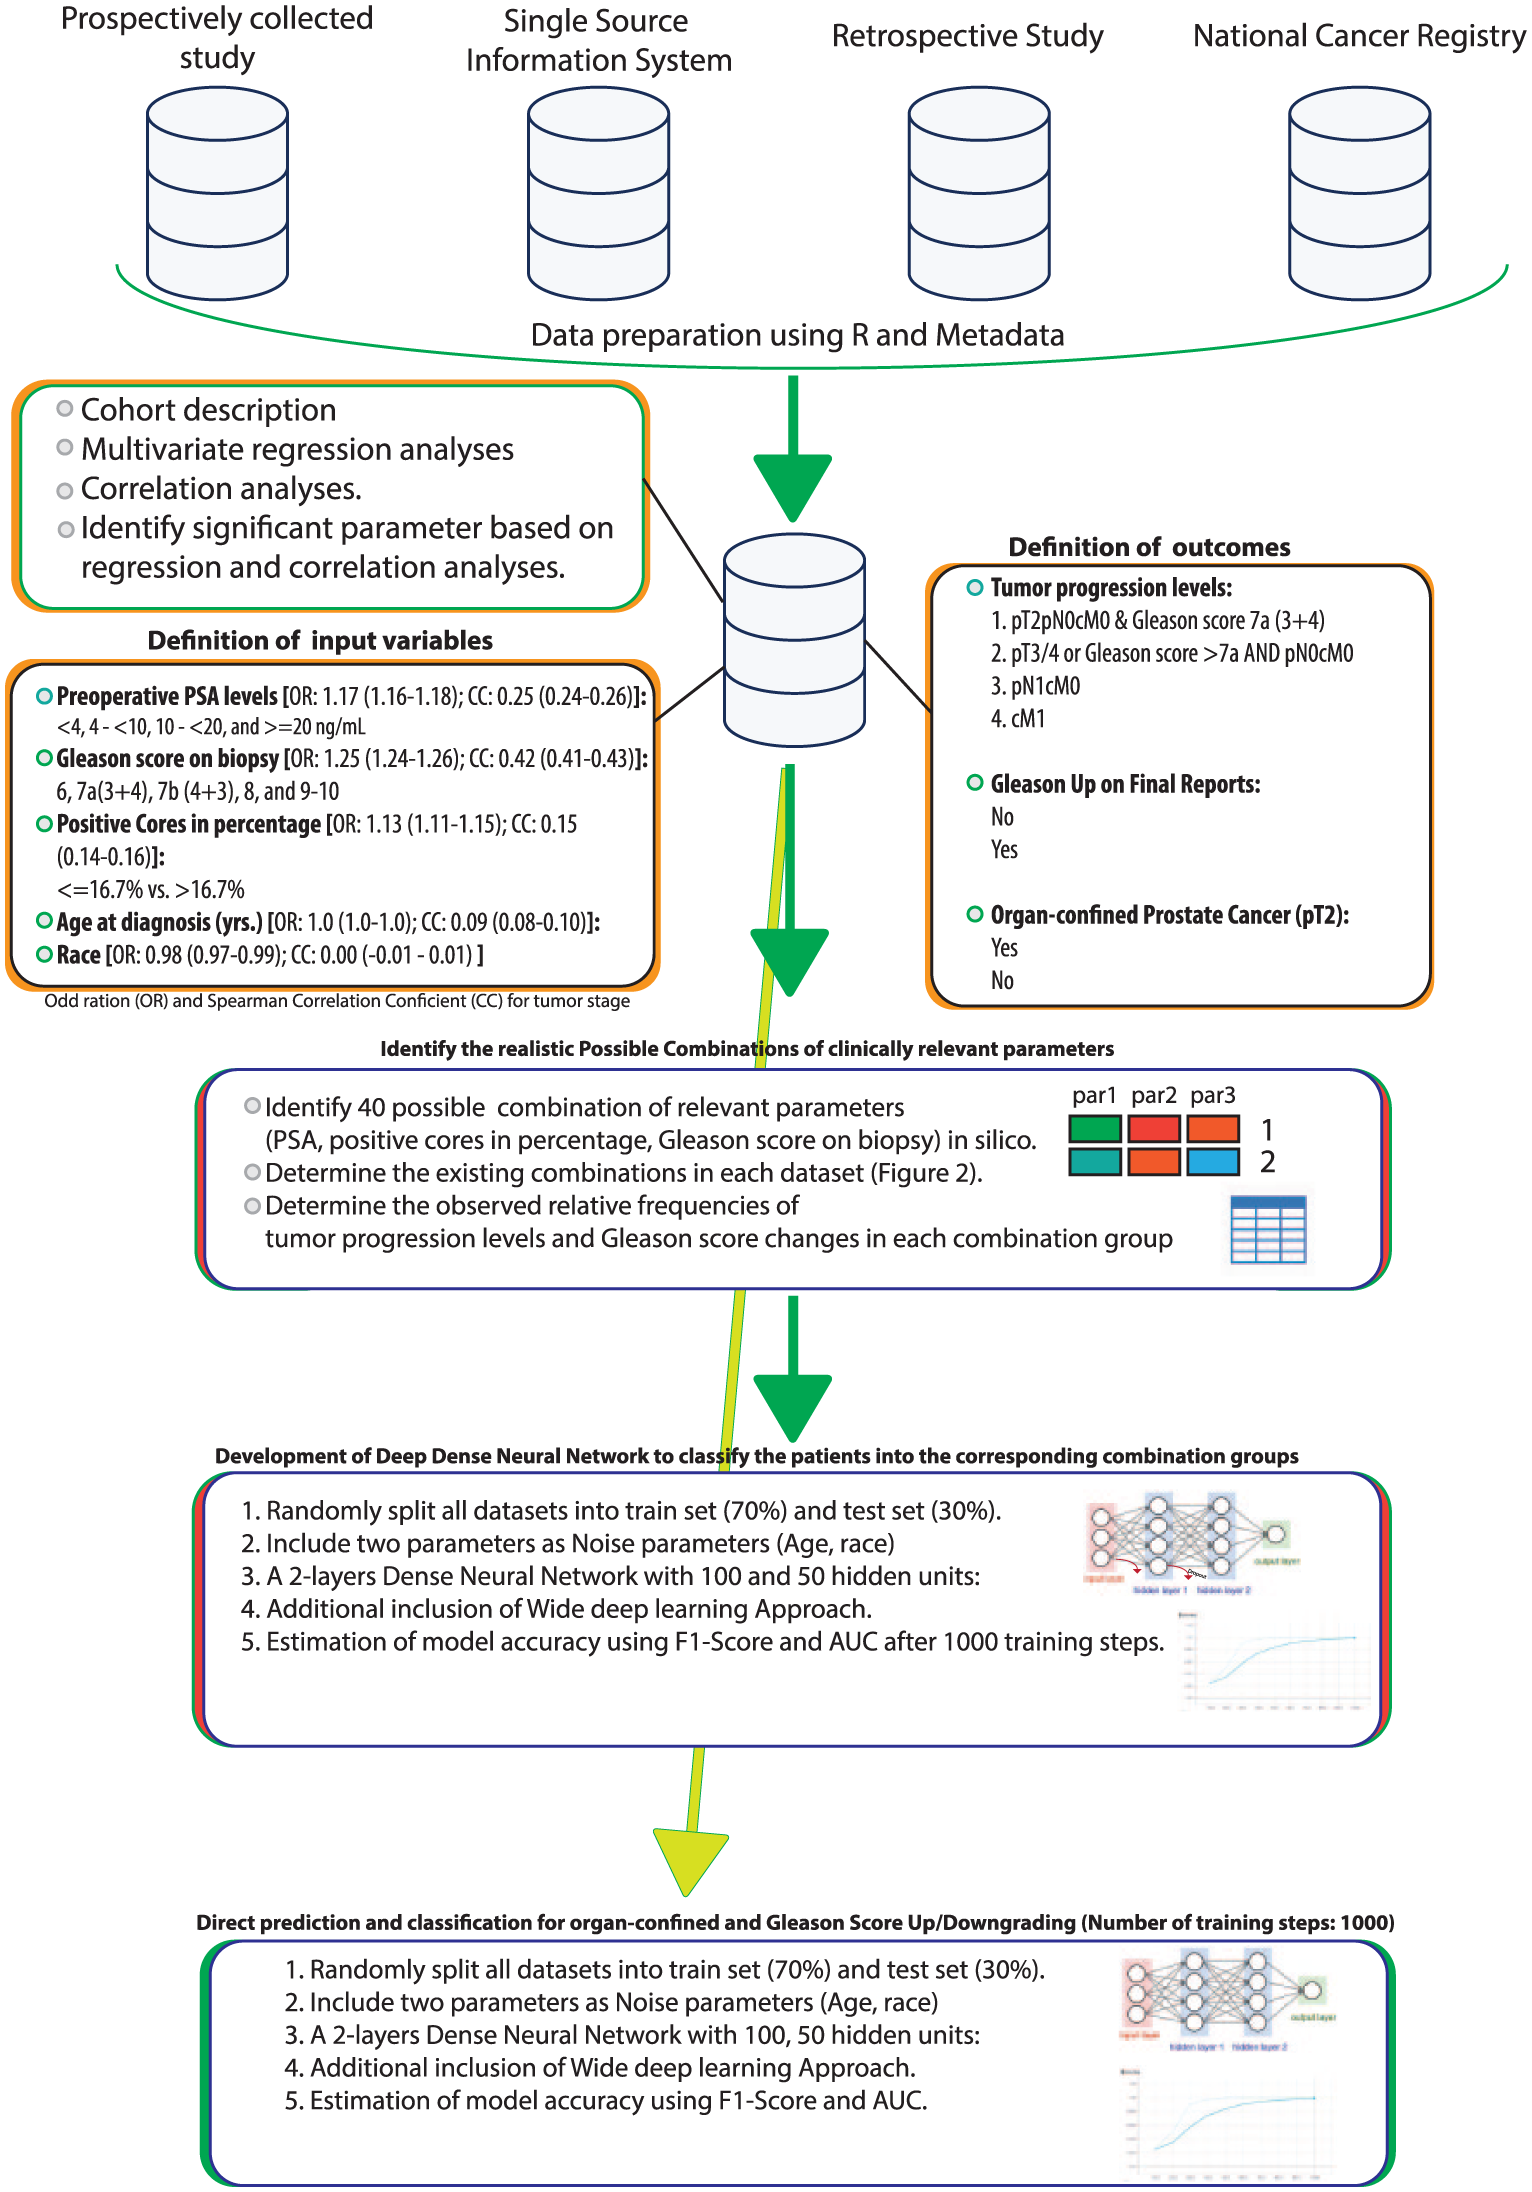
The workflow of the combination and deep model for prostate cancer.
Variable definition
Table 1 lists the variables considered for this study. Patient information included race (i.e. White, Black, others), age at diagnosis (years), preoperative serum prostate-specific antigen (PSA) level (ng/mL) as continuous and categorized variables (<4, 4–10, 10.1–20, >20 ng/mL), pathological tumor stage (pT2, pT3a, pT3b, pT4), pathological node stage (pN0, pN1), clinical metastasis stage (cM0, cM1), pathological Gleason score 16 on biopsy and on prostatectomy specimens (6 vs 7a (3 + 4) vs 7b (4 + 3) vs 8 vs 9–10), number of positive cores at biopsy, and the total number of biopsy cores. The Gleason score was divided according to the recommendation of International Society of Urological Pathology. The parameter “Age at diagnosis” was dichotomized using the median split. We calculated the ratio of positive cores to the total number of biopsy cores taken by the prostate biopsy. The ratio of positive cores was categorized by considering the 25th percentile as a cutoff. Patients were divided into four groups as outcome groups by PSA, the TNM stage, and the pathologic final Gleason score status: patients with pT2pN0cM0 PCa and PSA levels < 10 ng/mL and final Gleason score ⩽ 7a; patients with final Gleason score > 7a or pT3a/b or pT4 or PSA ⩾ 10 ng/mL and no evidence of metastasis; patients with regional lymph node metastasis; and patients with distant metastases. The data set was pseudonymized during the whole processing steps.
The variable definition.
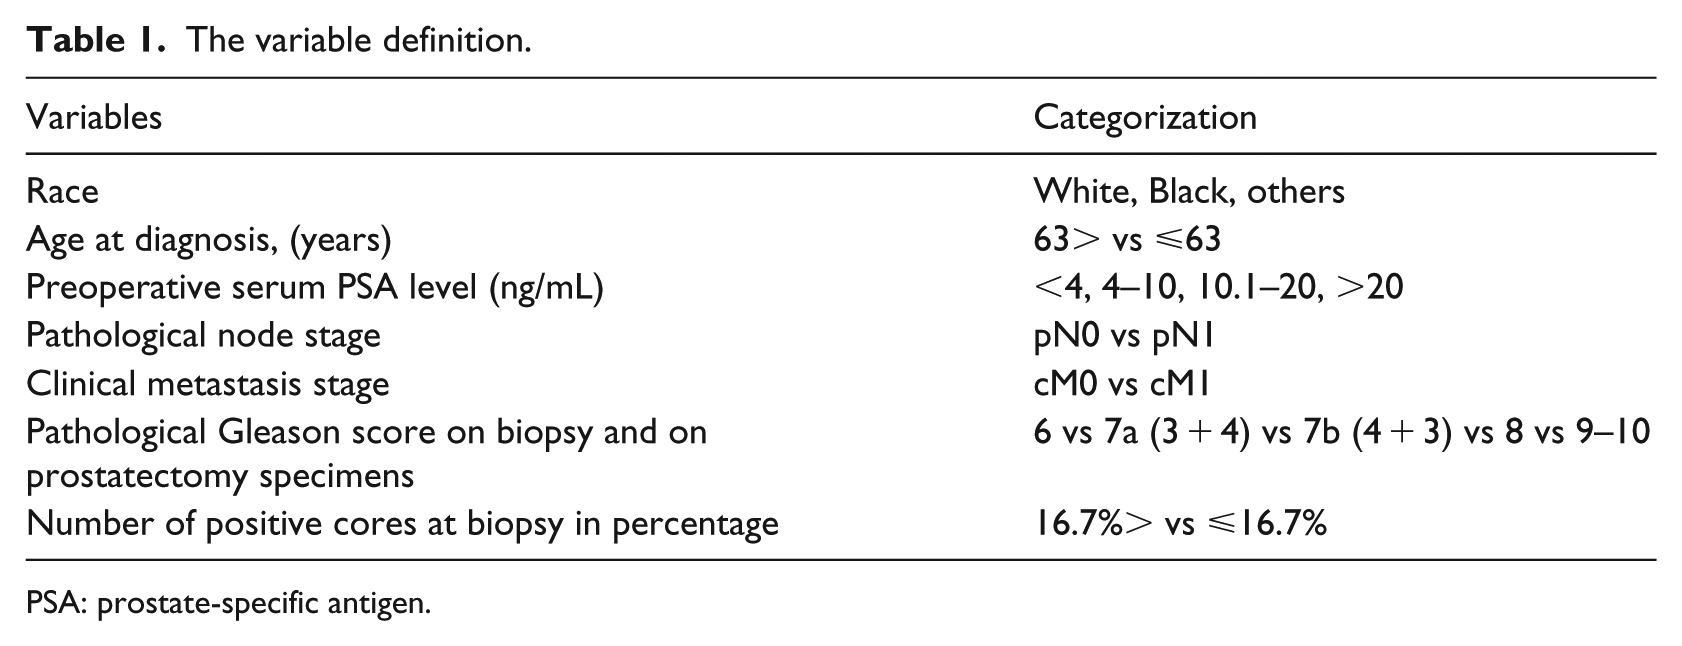
PSA: prostate-specific antigen.
Data extraction
Data acquisition was performed according to the precepts of the Helsinki Declaration and German data privacy regulation.
Prospectively collected data
We utilized clinicopathological prospectively collected data of 533 patients from a recent study, evaluating the variation of the tumor location between men diagnosed at initial biopsy and those diagnosed at repeat biopsy. 17 The required data were extracted from an Excel spreadsheet and stored in comma-separated file format (CSV). The data processing is then performed using the R Console (R Foundation for Statistical Computing, Vienna, Austria) and a general metadata which facilitates data merging with the following data set.
Extraction from the electronic health record
We applied the biopsy report generator introduced by Breil et al. 18 and the final pathology report developed by Eminaga et al. 19 to directly extract the clinicopathological data from Hospital Information System (HIS). The required data were then stored in CSV file format and processed using a proper metadata and the R Console. Data from biopsy and pathology reports were merged by patient identity number (PID), which was removed from the merged data.
Retrospective data
Retrospectively collected data of 455 patients who underwent total removal of the prostate in the University Hospital of Cologne in the period between 2004 and 2008 were considered. The data were stored by database storage software (Microsoft Access) and extracted by Structured Query Language (SQL) queries. The extracted data were stored in CSV file format and processed in R Console.
National registry data
The Surveillance Epidemiology and End Results (SEER) 18 registries were used for this study. SEER consists of population-based cancer registries, representing approximately 28 percent of the US population, and provides data related to basic demographics, tumor site, histology, stage, grade, and treatments performed. The study included only men ⩾35 years of age diagnosed between 2004 and 2014 with histologically confirmed adenocarcinoma (International Classification of Diseases for Oncology, third edition, code 8140) of the prostate (site code 61.9). All cases (n = 44,321) were staged based on the American Joint Committee on Cancer (AJCC) Cancer Staging Manual, sixth edition, with either radiographic or pathologic confirmation of metastatic disease. 20 Cases diagnosed by autopsy or death certificate only were excluded. Following SEER coding guidelines, data regarding age, race, Gleason score on biopsy and prostatectomy specimens, and pathologic AJCC-based T, N stages, and the clinical M stage were acquired at the time of diagnosis. Information about the pathological AJCC T stage was derived from RPE. Information about the pathologic AJCC N stage was derived from any microscopic assessment of regional nodes with RPE/prostate biopsy or from autopsies in men who had been diagnosed with PCa before death (CS lymph nodes eval codes 2 or 3). The PSA measurement corresponded to the highest PSA value recorded before diagnostic prostate biopsy or treatment. The population was divided by race into White, African American, and others or unknown. Cases with total removal of the prostate (surgery site codes 50 or 70) were identified. Other forms of local therapy, including incomplete removal of the prostate (surgery site code 30), focal therapy (FT; e.g. cryotherapy, laser, hyperthermia; surgery site codes 10–17 or 24–26), or transurethral resection of the prostate (TURP; surgery site codes 19–26) were excluded. Patients with unknown therapy were also excluded. The extracted data were transferred and processed using the proper metadata using R Console.
Data analyses
After data preparation, we performed multinomial multivariate regression analyses and Spearman correlation coefficients to evaluate the odds ratios of selected variables (i.e. PSA; Gls at biopsy, race, and age at diagnosis; ratios of positive/negative cores) for different tumor stages and their correlation to tumor progression. The q value (false discovery rate (FDR)-adjusted p value) was estimated for comparative analyses. All statistical tests were two-sided, and the level of statistical significance was set at q ⩽ 0.05.
We calculated the number of all possible combinations of significant and categorized variables using the following equation
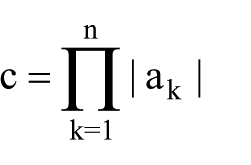
where c is the number of combination possibilities, k is the index of variable a, n denotes the total number of variables, and|ak| is the number of features for each variable. After that, we determined the existing (real) combinations in our data set by applying the duplication removal algorithm to identify realistic combination possibilities. After that, the data set was unsupervised clustered using the hierarchical clustering on the significant categorized variables. We repeated the duplication removal algorithm to verify that the data set is correctly clustered into the realistic combination possibilities. All analyses were performed with the R statistical package system (R Foundation for Statistical Computing).
Development of prediction models
We trained three models to predict the correct cluster for each patient in our data set: a wide model, which is a linear model with a wide set of sparse and crossed feature column as already described by Cheng et al.; 21 a deep feed-forward neural network; and a model combining the wide and deep neural network. For the wide model, the crossed feature columns were between categorized PSA levels and the categorized parameter for ratios of positive cores and between categorized PSA levels and the Gleason score on biopsy. In this way, wide models with crossed feature columns enable memorizing sparse interactions between features effectively. 21 For the deep model, we arbitrary defined different hidden units for deep neural networks; each hidden unit has two neural layers. The dropout regularization technique with a dropout rate of 0.2 was utilized to reduce the risk of overfitting 22 by randomly selecting nodes to be dropped out with a given probability (in our study: 20%) of each weight update cycle. A centered bias variable is estimated for each cluster. The optimization algorithm “Adaptive Moment Estimation” (Adam) was used to compute adaptive learning rates for each parameter, thereby optimizing the neural network models. We preferred Adam due to its popularity in the field of deep learning and because Adam achieved better results in short training period compared to other approaches. 23 For the model optimization, we defined an initial learning rate of 0.001, a beta1 value of 0.9, beta2 value of 0.999, epsilon of value 1e-09. Rectified linear unit (ReLU) activation function was used to regulate the firing rate of neurons in the layer. For each analysis, a training set (70%) and a test set (30%) were randomly generated from the study data set by considering that the overall distribution of endpoints has met between train and test sets (Supplemental Table 1). All models were trained on the training set and evaluated on the test set. The training set was shuffled by each training step, and the batch size was defined as the number of training cases. The training steps were limited to 1000 steps to avoid the overfitting risks of these models. Through the evaluation (validation) process, prediction and classification accuracies, as well as precision, were quantified with the area under the curve (AUC), classification accuracy, precision, recall and F-measure (F1 score). Input data have all significant variables identified by the data analyses’ section. Furthermore, age at diagnosis and race were added as noise parameters into our input data to reduce the overfitting risks of our models, since the predictive value of these parameters for advanced PCa and Gls upgrading is controversial.
Moreover, we evaluated the analyses between deep neural networks and wide-deep neural networks model, random forest analyses, adapted boost, naïve Bayes and k-nearest neighbor’s algorithm, multivariate logistic regression analyses, classification tree and supported vector machine. Here, a training set was generated from SEER data sets; a test set was generated from SEER data sets. For comparison analyses, we classified the study cohort by presence of organ-confined PCa (pT2) or Gls upgrading status.
We utilized Python 2.7 (Python Software Foundation, Wilmington, USA), and Tensorflow (Google Inc., Mountain View, USA) for developing the models. All analyses were performed on a processor Intel i7 with RAM 32 GB and GPU NVIDIA™ GeForce GTX 1080 Ti with 11 GB VRAM.
Results
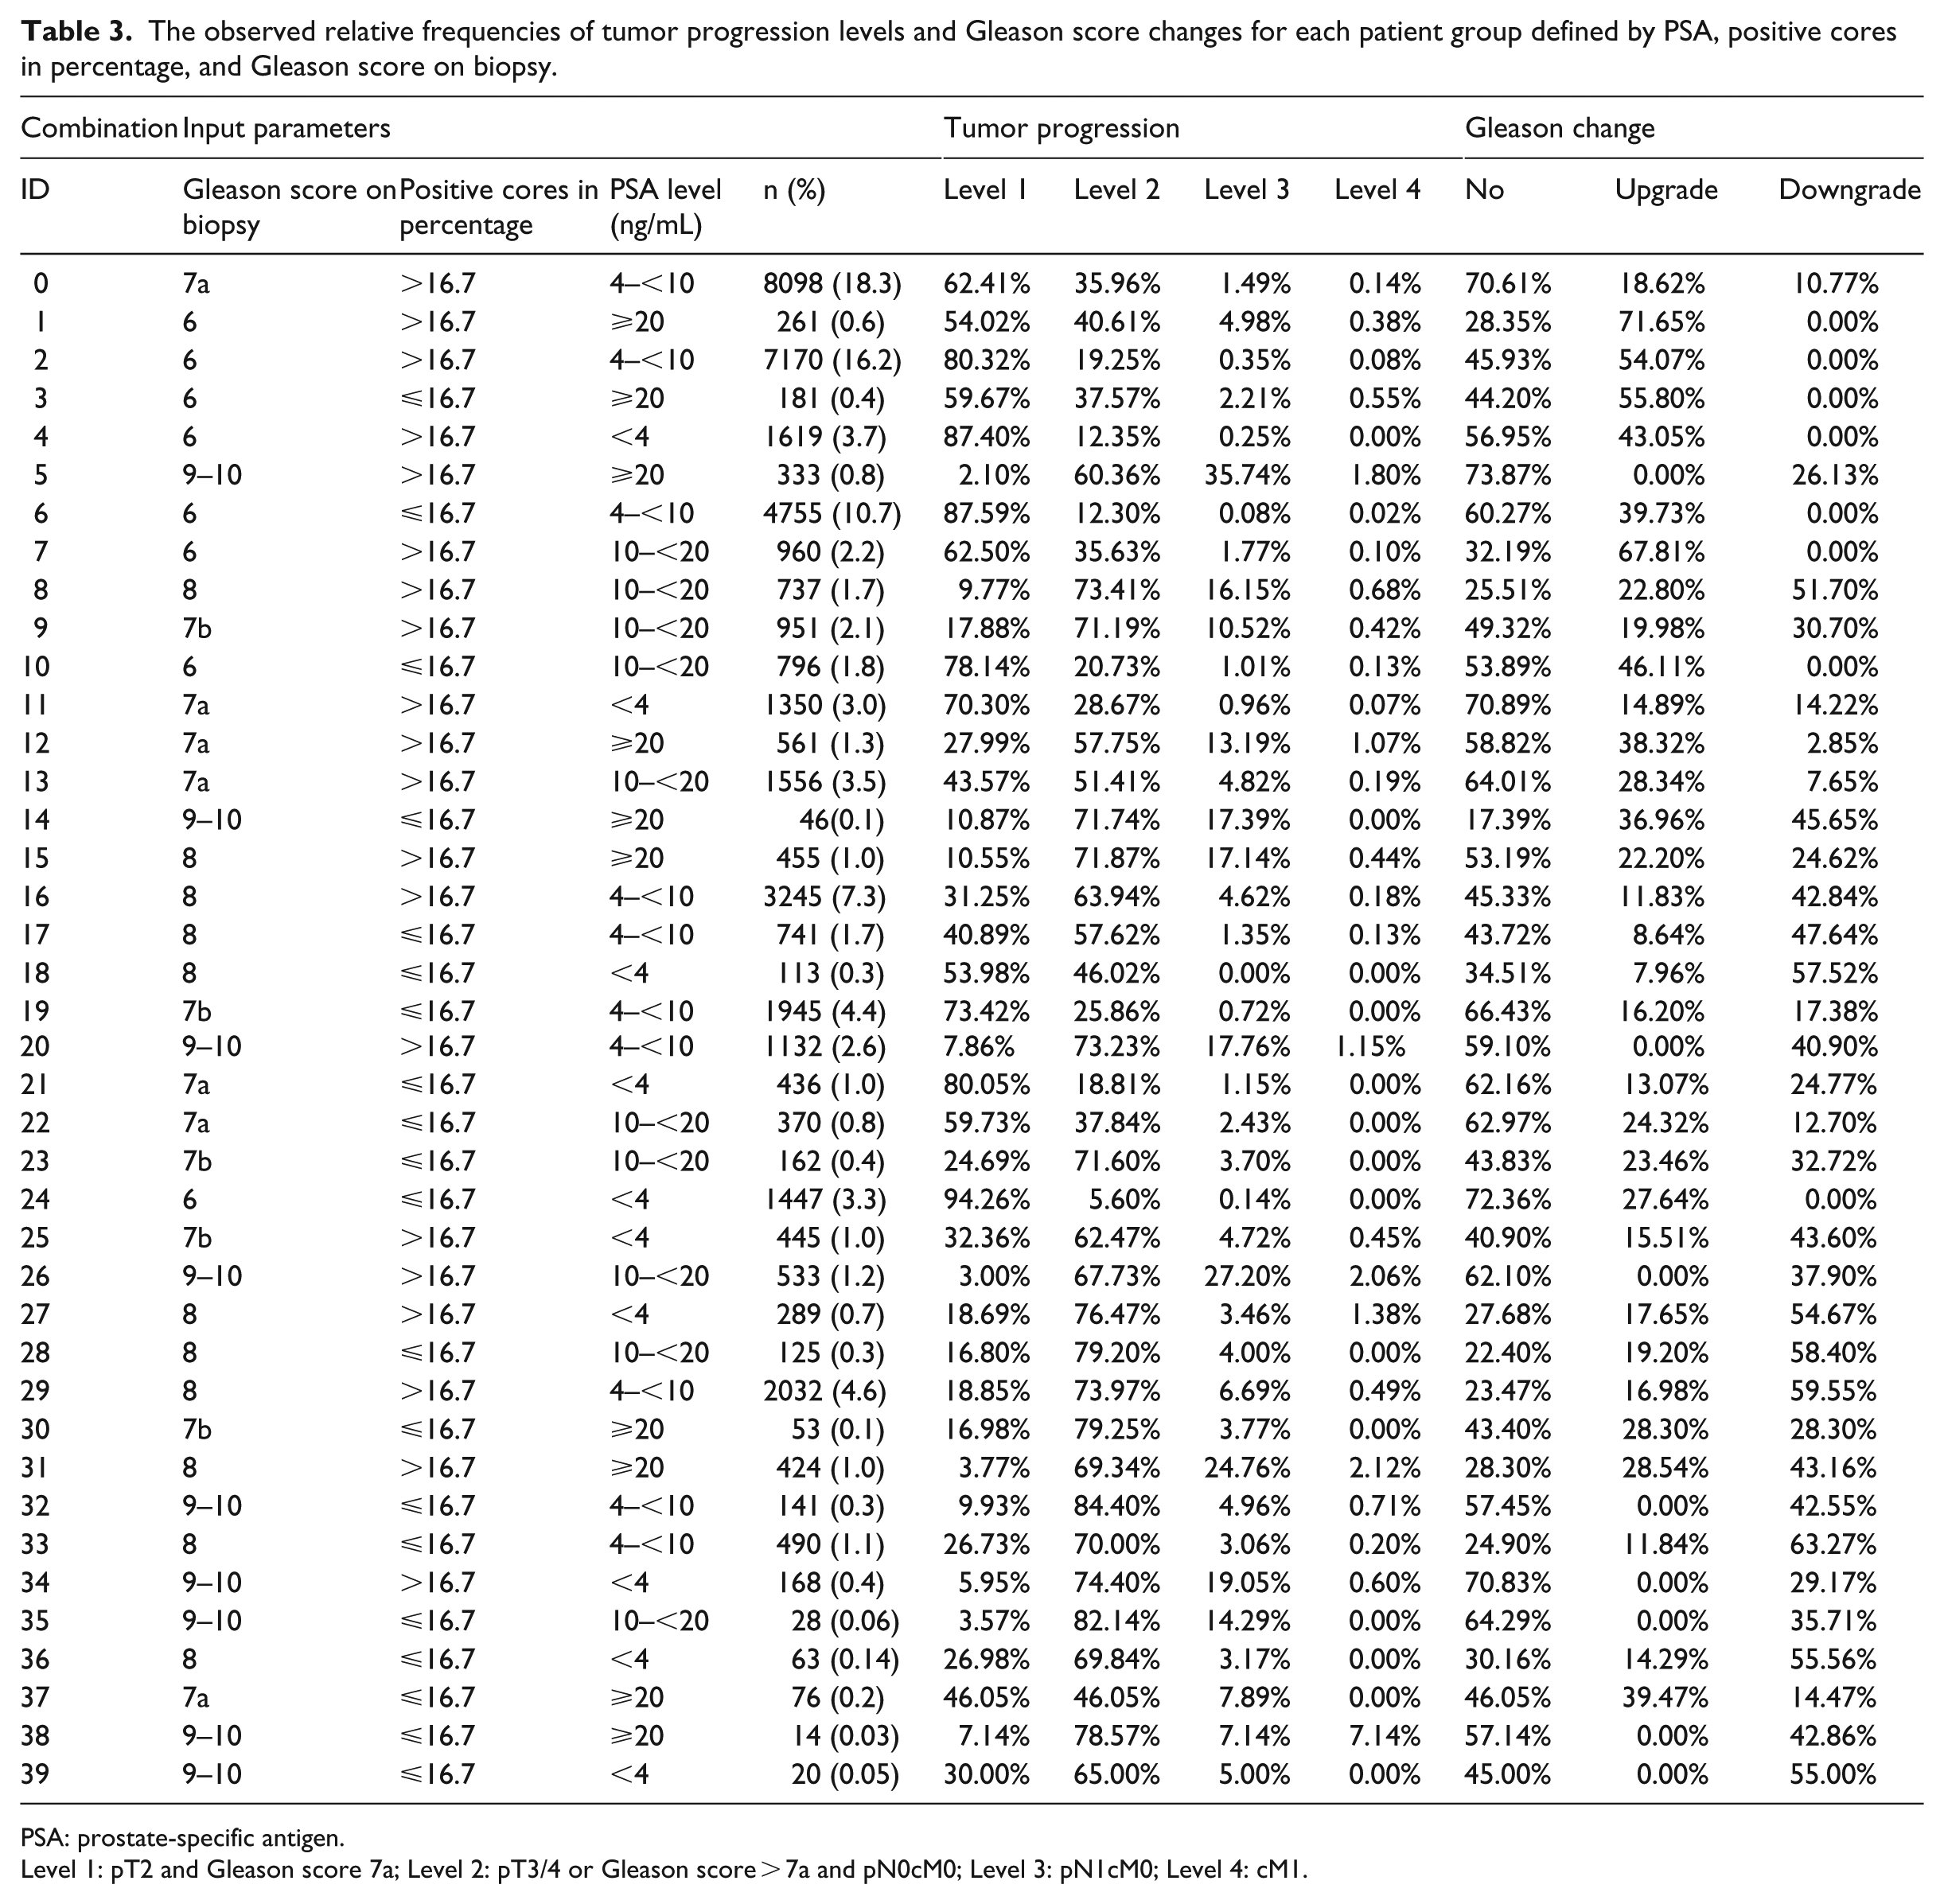
Table 2 shows an overview of the relevant clinicopathological information from each of the four different data sets. Overall, the median age at diagnosis was 63 years (interquartile range (IQR): 57–67 years). In total, 65 percent of men who underwent RPE had PSA levels between 4 and 10 ng/mL. The median biopsy cores were 12 (IQR: 12–12), and the 25th percentile of positive cores was 2. The 25th percentile of the positive cores ratio was 16.7 percent. A total of 70 percent of cases had positive cores in more than 16.7 percent of total biopsy cores. After surgery, 59.7 percent of men had locally advanced PCa. Loco-regional lymph node metastases were observed in 6.2 percent of cases. Only 99 (0.04%) men who underwent RPE had distant metastases. In the multivariate multinomial regression analyses and correlation analyses, categorized PSA levels, Gls by prostate biopsy, and categorized positive/negative cores given in percentage were identified as significant parameters. However, age at diagnosis and race were not the significant predictors in multivariate multinomial regression and correlation analyses. In silico, we identified 40 combination possibilities of these significant parameters. In Muenster’s data set, we determined 38 possibilities for combining the significant parameters, whereas the Cologne’s data set had 30 combination possibilities. The SEER database included data covering all combination possibilities. Figure 2 shows the Venn diagrams for intersections between these data sets. Table 3 shows the observed relative frequencies of different tumor progression levels and the Gleason upgrading for each possible combination (cluster). We found that certain clusters are remarkably associated with increased risk for advanced tumors or Gls scores upgrading in the prostatectomy pathology report.
The cohort characteristics.
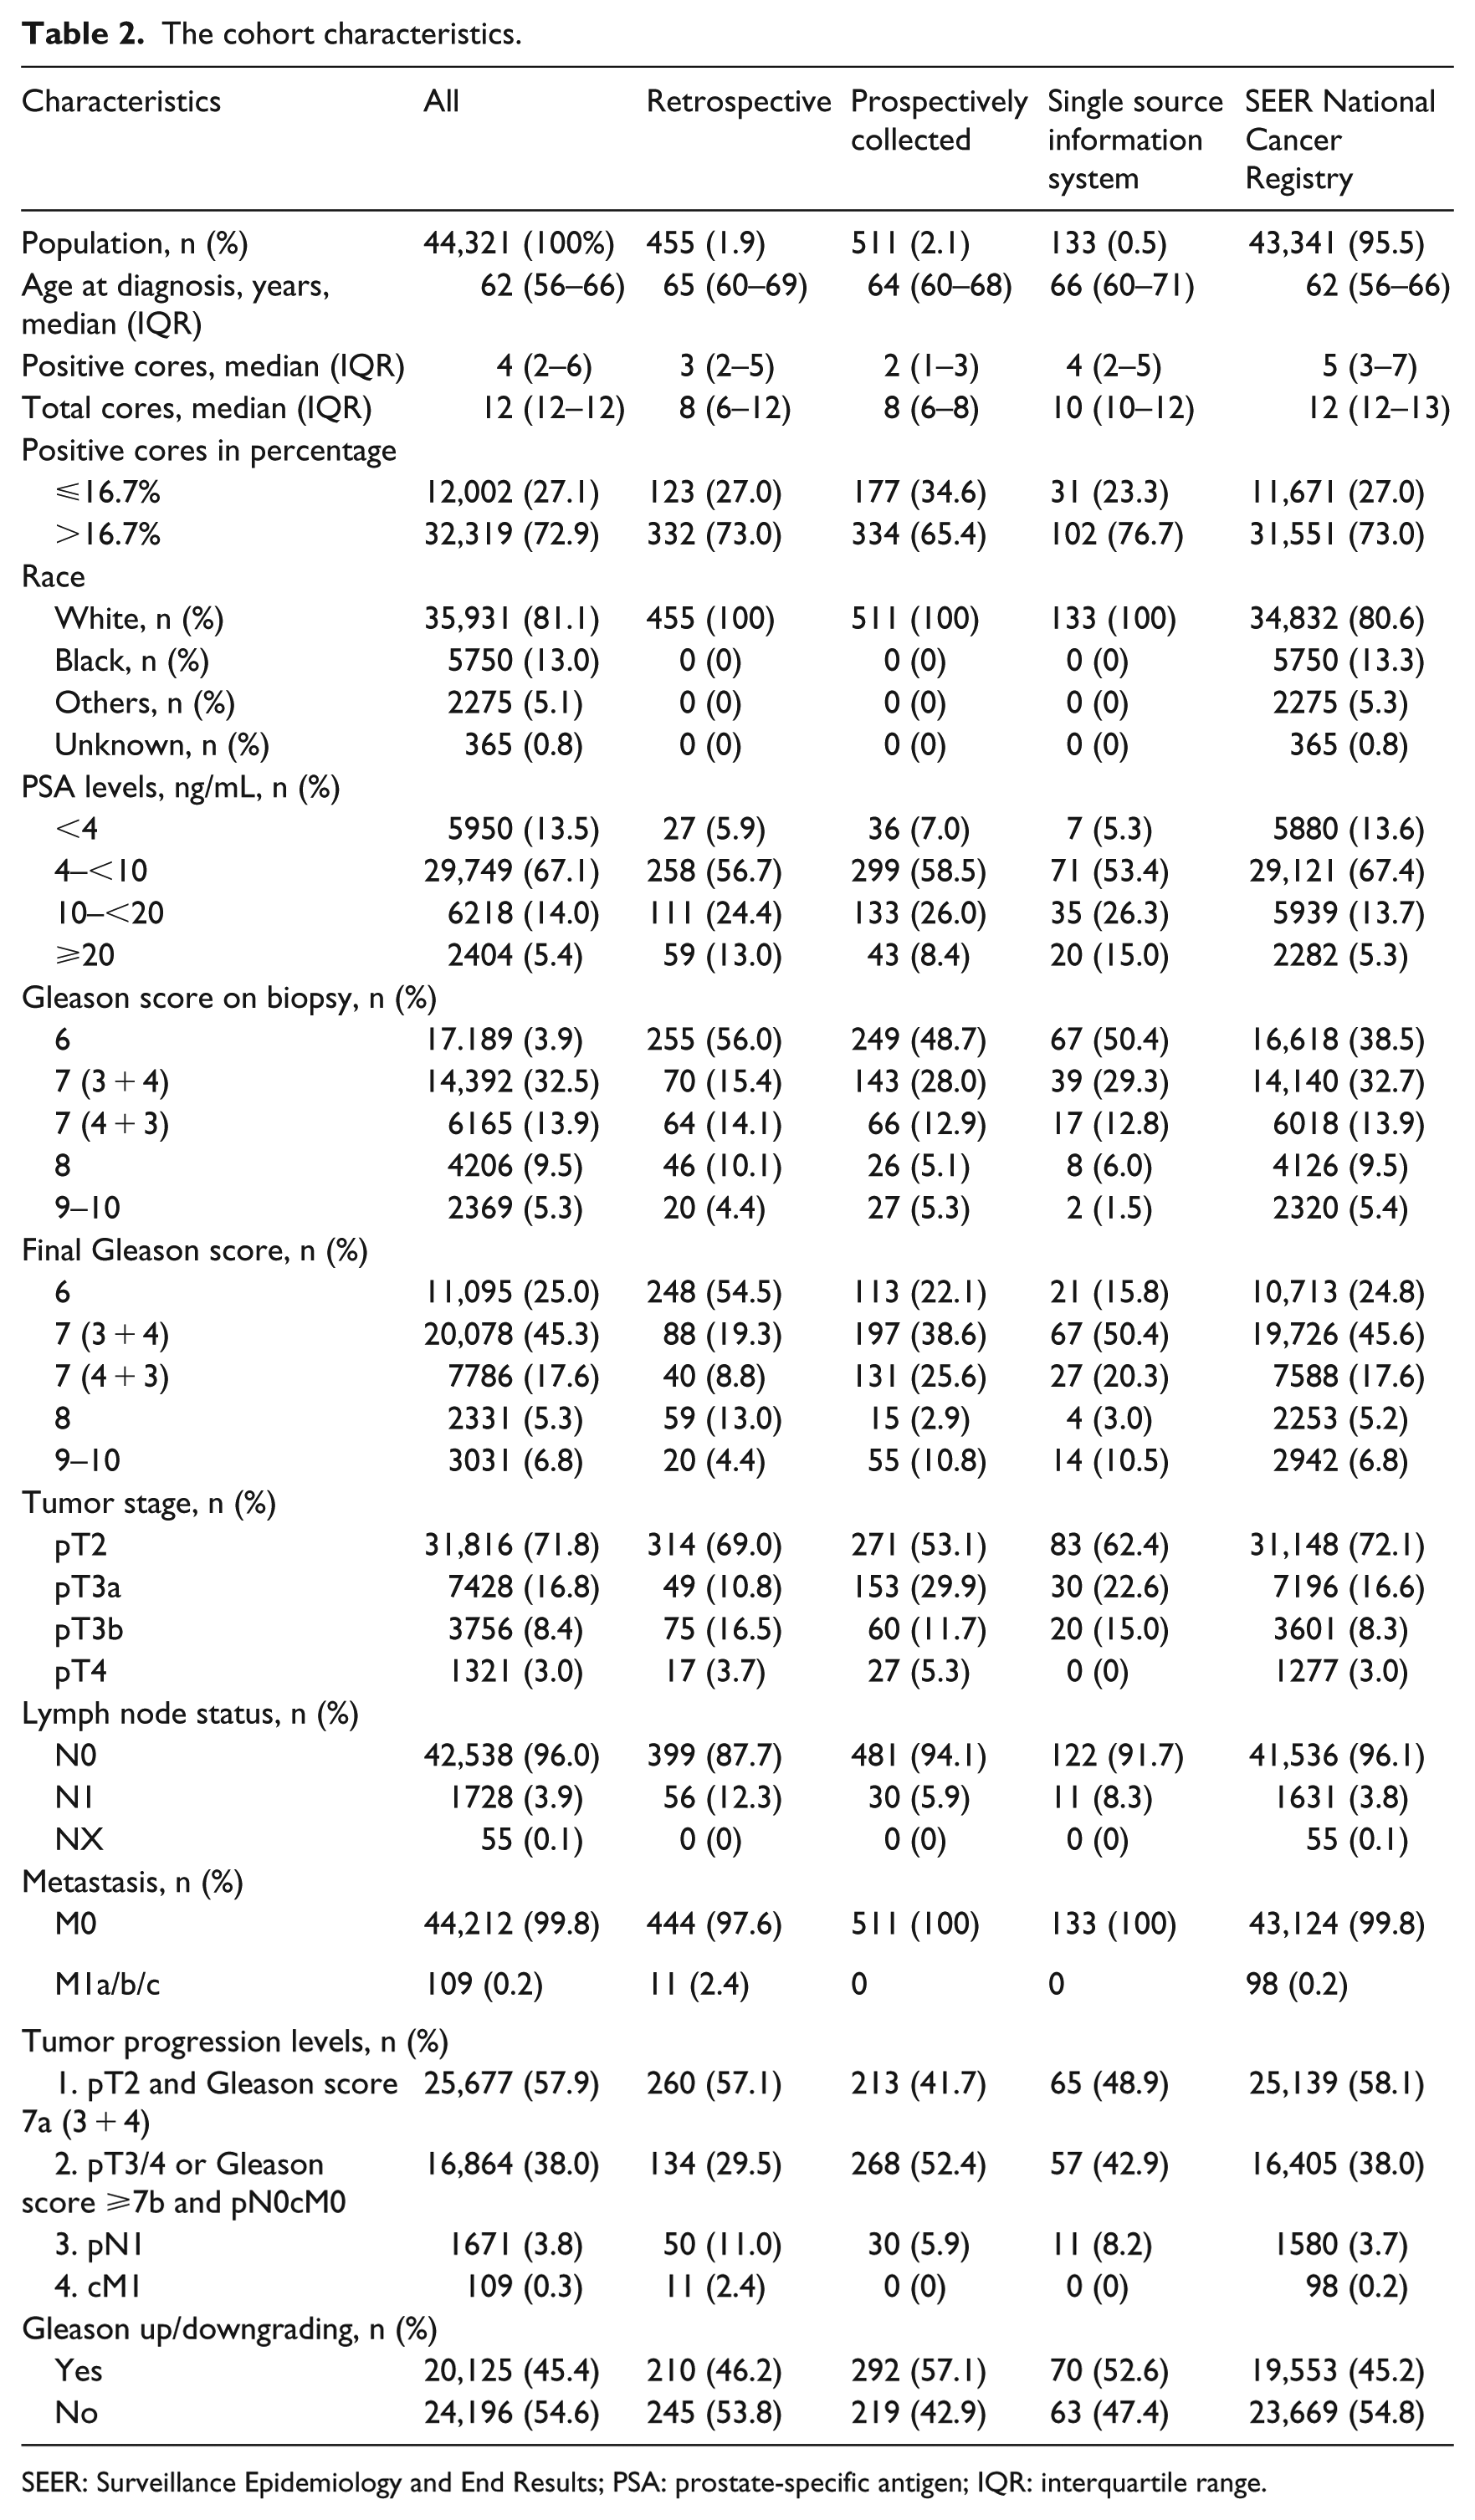
SEER: Surveillance Epidemiology and End Results; PSA: prostate-specific antigen; IQR: interquartile range.
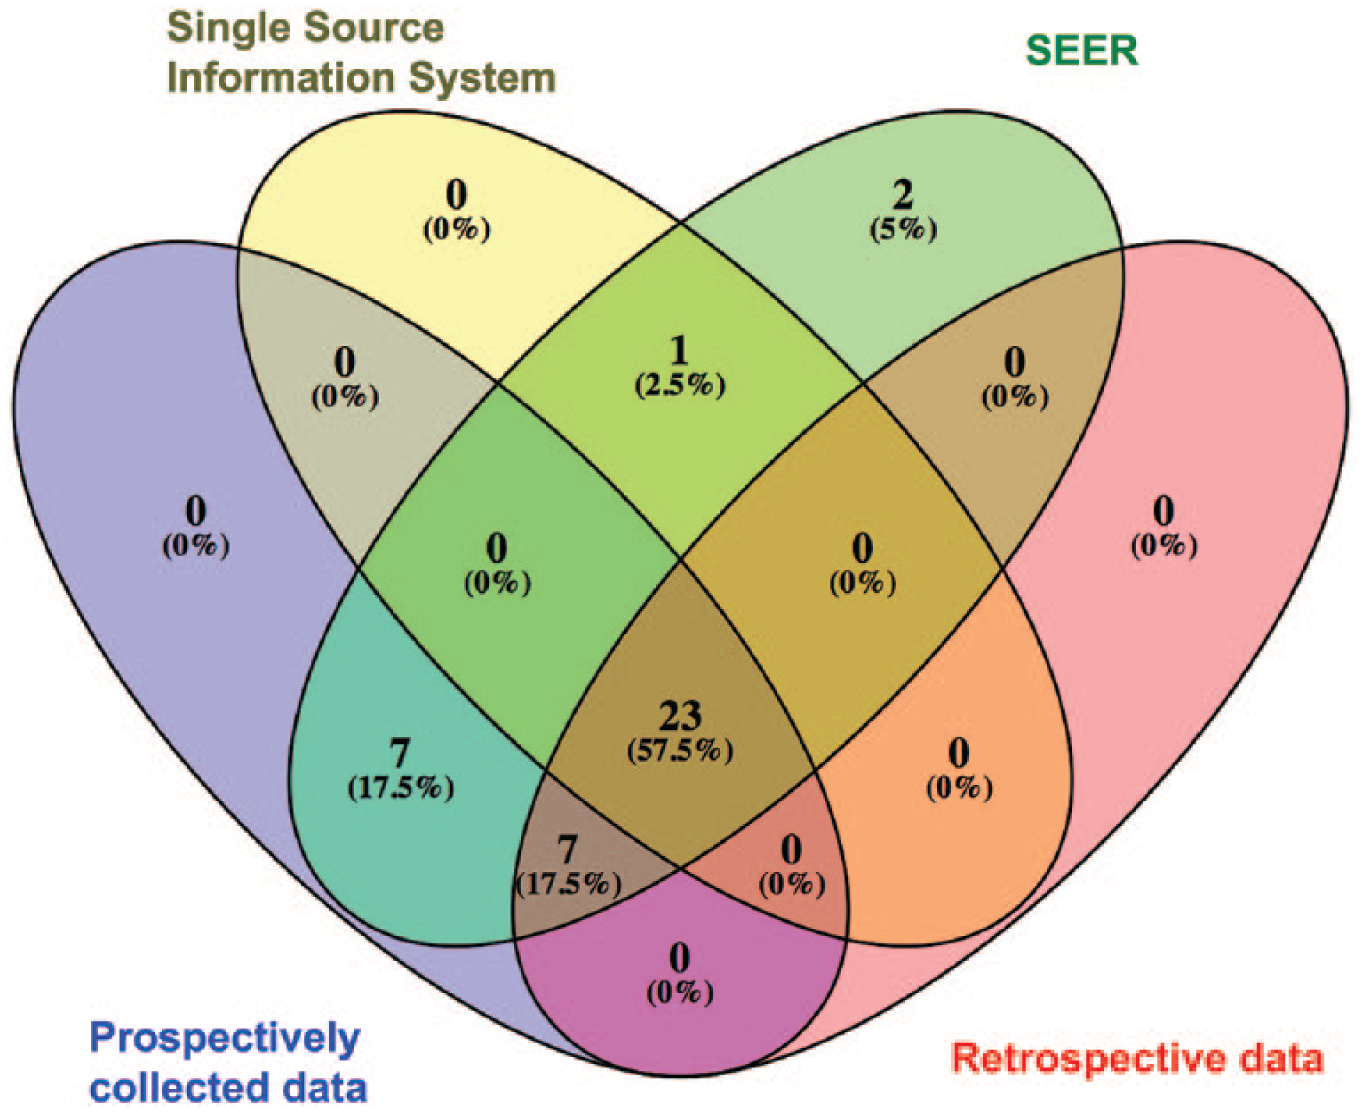
Venn diagram representing the number and portions of possible combinations between four data sets.
The observed relative frequencies of tumor progression levels and Gleason score changes for each patient group defined by PSA, positive cores in percentage, and Gleason score on biopsy.
PSA: prostate-specific antigen.
Level 1: pT2 and Gleason score 7a; Level 2: pT3/4 or Gleason score > 7a and pN0cM0; Level 3: pN1cM0; Level 4: cM1.
The deep neural models recognized the corresponding cluster for each case with 100 percent accuracy, when age at diagnosis, race, categorized preoperative PSA levels and Gls score, and the percent of positive cores as Boolean parameter were considered as input data. Figure 3 exhibits the training progression for each model. The training duration varied between different deep neural models. The wide and deep neural network model achieved similar results, but with prolonged training periods.
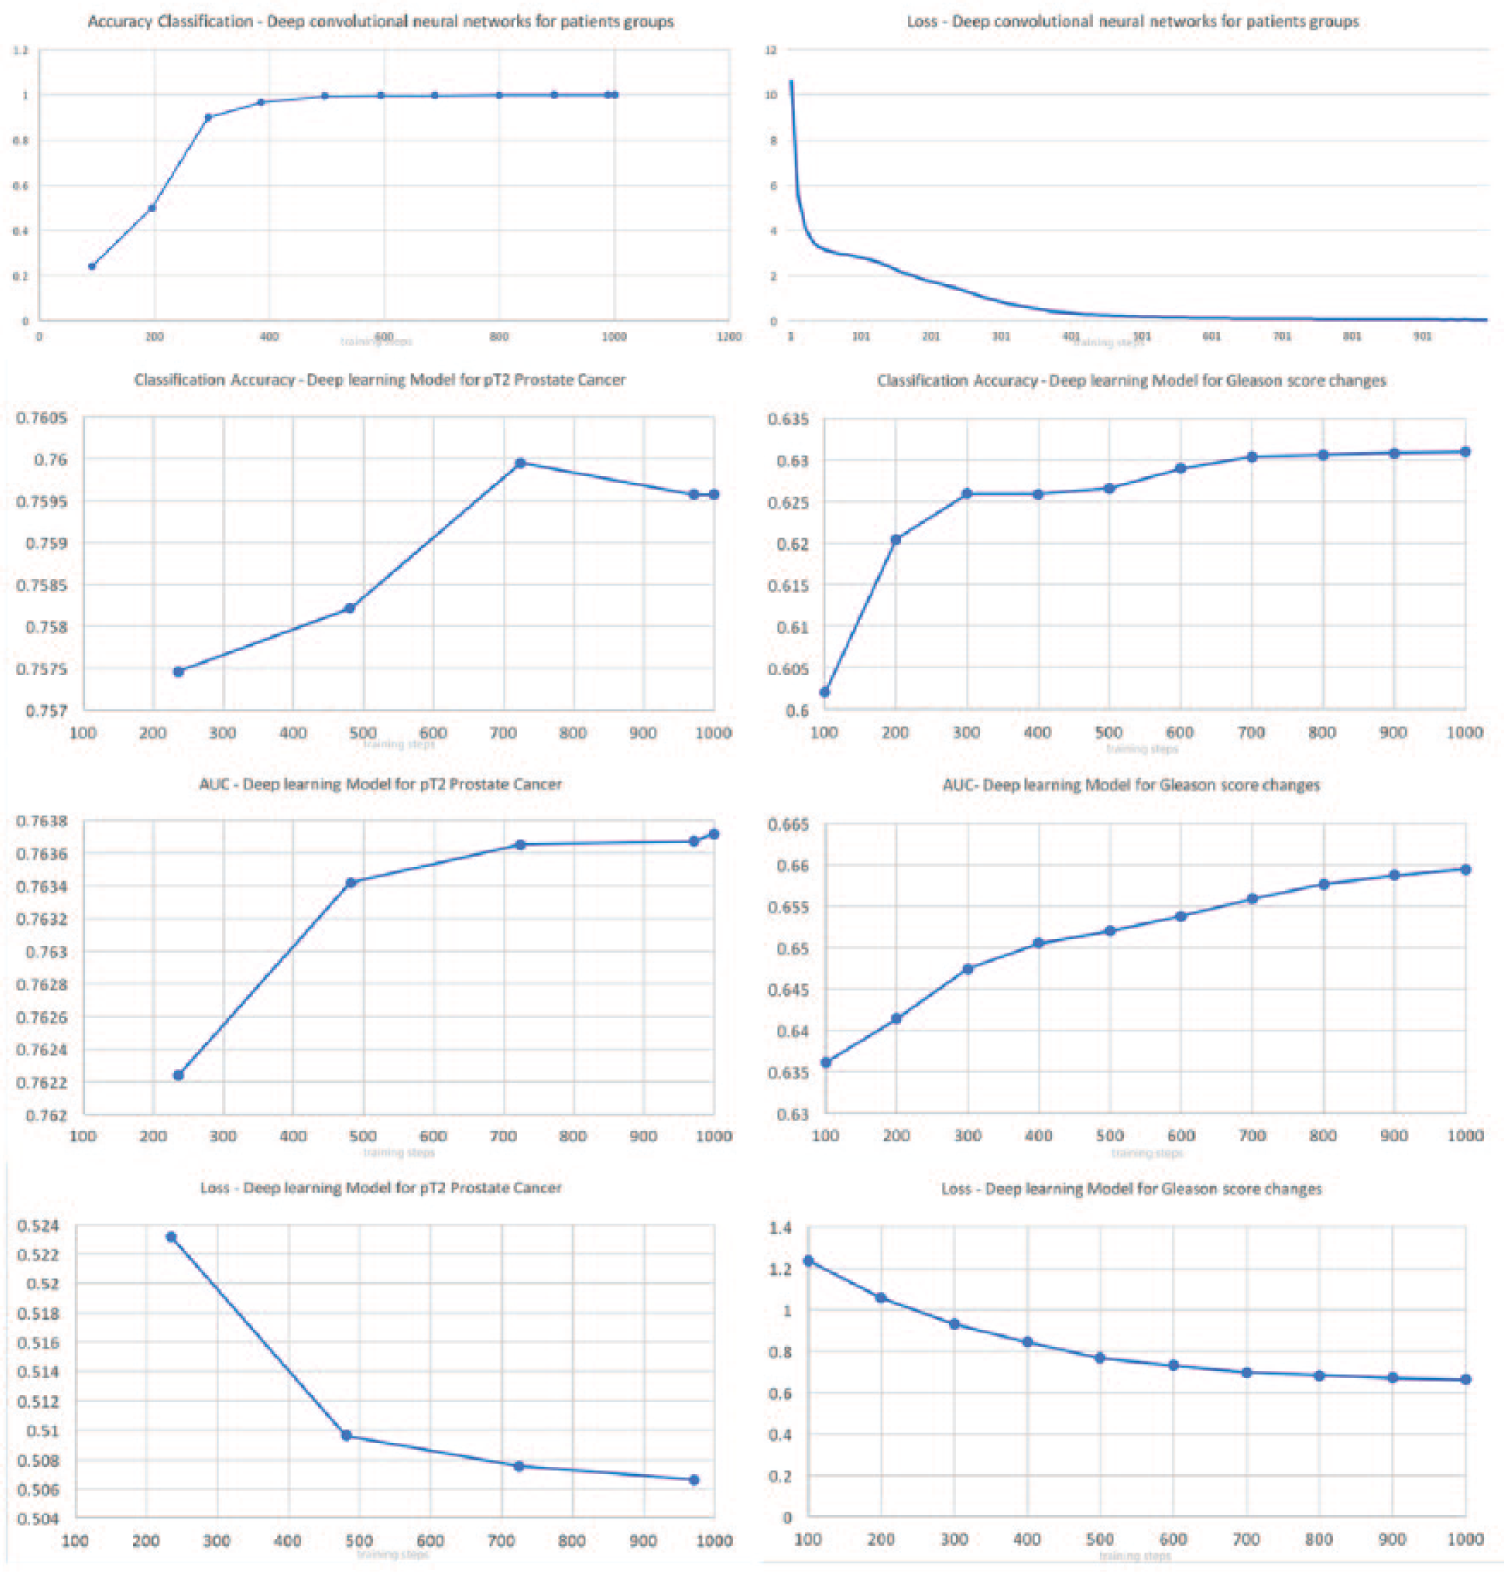
Diagrams illustrating the classification accuracy (CA), area under the curve (AUC), loss function during training episodes (training steps) for deep models for classification of organ-confined prostate cancer or identification of cases with Gleason score change.
Table 4 shows the results of the classification performance of different machine learning approaches. The deep models achieved higher accuracy than other approaches. By comparison analyses, the deep models achieved higher accuracies than other approaches. The deep models achieved the best F1 scores to classify patients by presence of pT2 tumors (0.850) and Gls changes (0.574) followed by the logistic regression (0.752 for pT2 tumors; 0.532 for Gls changes) and naïve Bayes for pT2 tumors (0.748) and random forest classification for Gls changes (0.530).
The model performances for prediction of pT2 prostate cancer and Gleason score changes.
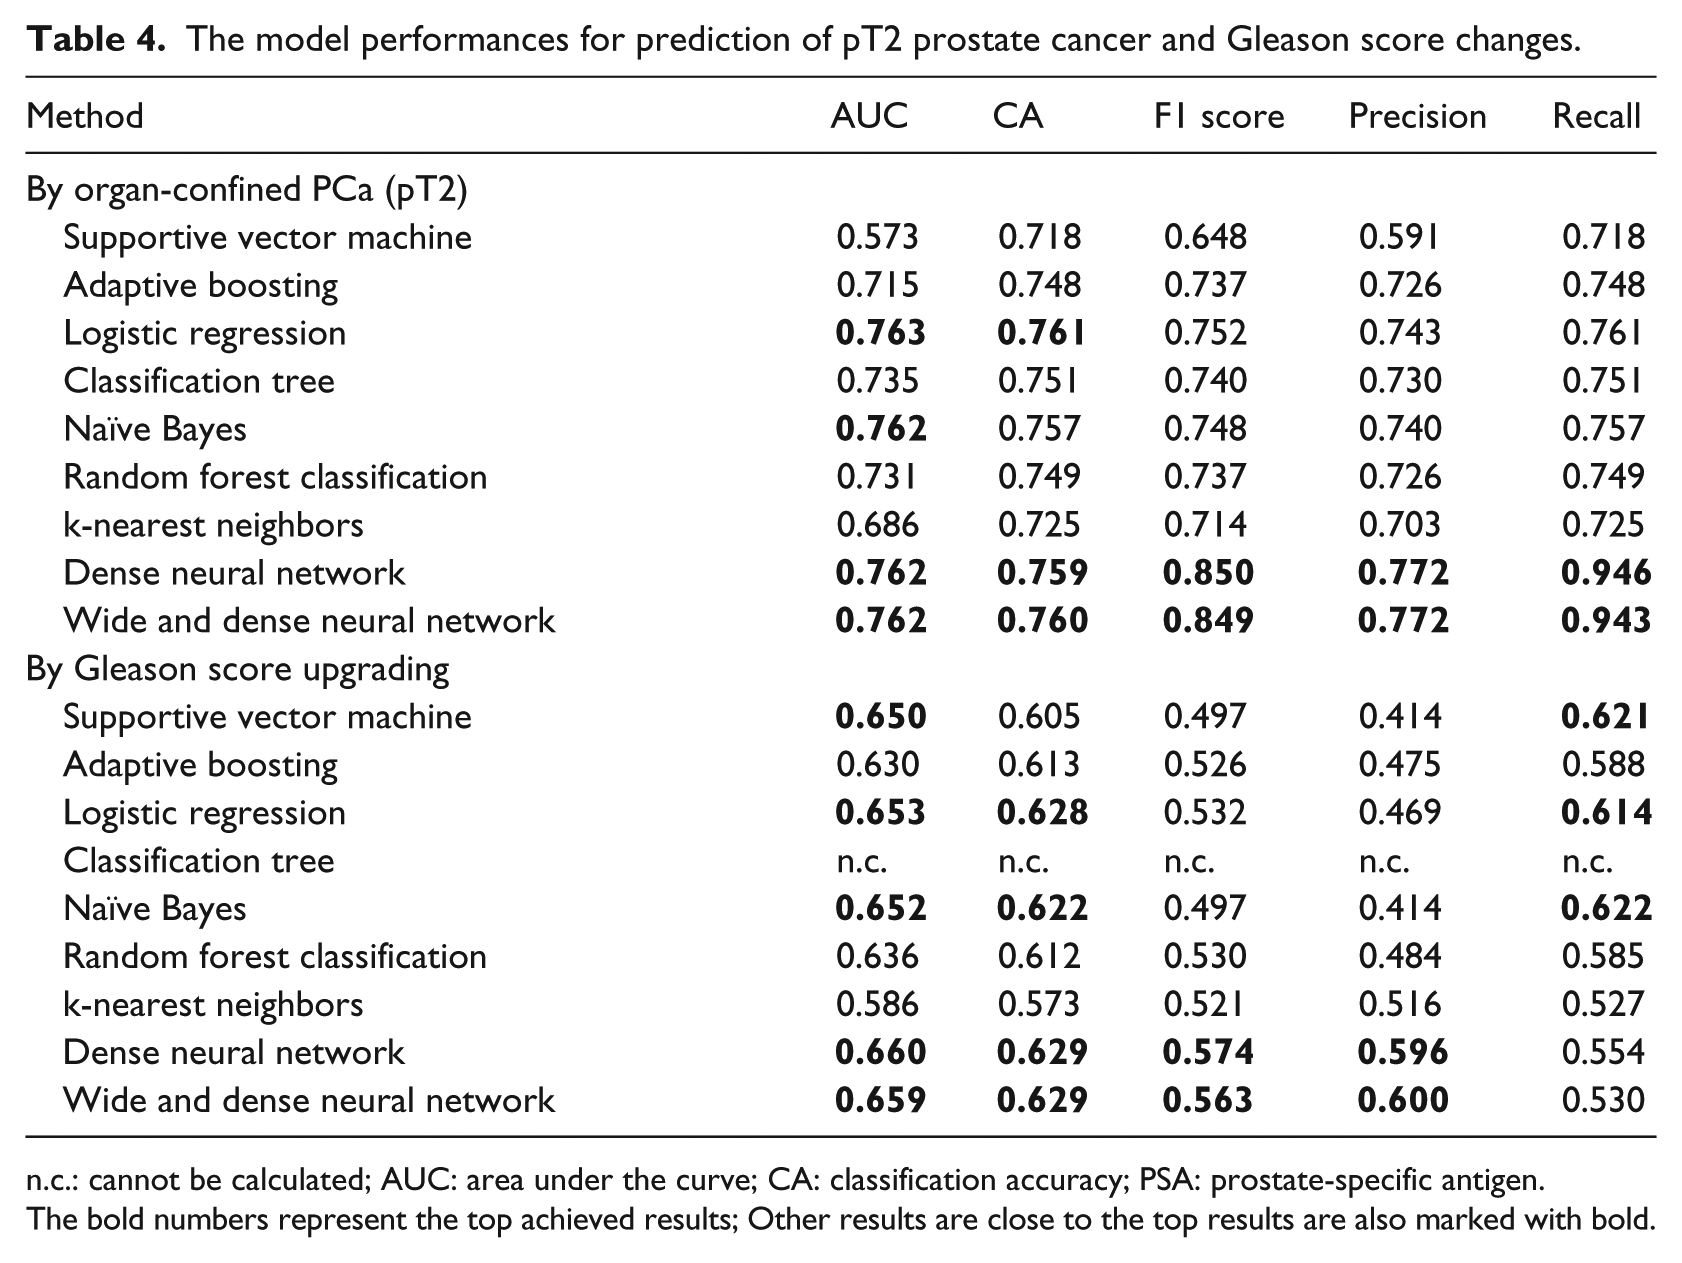
n.c.: cannot be calculated; AUC: area under the curve; CA: classification accuracy; PSA: prostate-specific antigen.
The bold numbers represent the top achieved results; Other results are close to the top results are also marked with bold.
Discussion
The current model can successfully identify subsets of patients with high risk for advanced PCa or risk for Gls upgrading with high accuracy. Moreover, the current model can be fed with data from different data sources (retrospective, prospectively collected, single source information system, and cancer registry), representing real situations of data mining in clinical research. The introduced model is feasible to manage and reuse these data after applying metadata. Deep learning approach has received further attention in recent years after its successful application in image and object recognition and has been used nowadays for different research and commercial purposes. 24 However, our work bridges the gap of utilizing the deep learning approach in classifying patients with cancer according to their preoperative features to determine the observed relative frequency of outcomes. We preferred categorizing our input parameters to identify all possible combination of these parameters with each other. In clinical routine, the categorization of clinical data for risk estimation has been proven as a successful and decision-friendly tactic to help physicians in classifying patients for treatment planning, for instance, the AJCC TNM staging system; 25 the D’Amico 26 classification, which categorized PSA to <4, 4–10, 10–20, and >20 ng/mL; or the recommended Gleason grouping (6, 7a, 7b, 8, 9–10). 27 Furthermore, we could determine a cutoff for the ratio of positive biopsy cores in our data sets. This cutoff of 16.7 percent reflected the number of positive cores defined by Epstein criteria for insignificant PCa in our data set (two positive cores) 28 and was used for the selection of patients for active surveillance.29,30 We identified similar benefits of categorization of input parameters to simplify the construction of the proposed model. However, the definition of thresholds for input parameters should be carefully considered and should be clinically meaningful. Some approaches have been introduced, including Youden index, median, percentile, and selection of cutoff with high sensitivity or high specificity or optimal AUC.31,32 We emphasize first to apply well-accepted cutoffs of input parameters for reproducibility and to avoid misinterpretation of results from the model. When no well-accepted cutoffs were found in the literature, then using abovementioned statistical approaches can be helpful to determine the cutoff.
We applied the parameter selection to build the combination model by weighing the clinical meaning and association between the input and outcome data. Our approach enables further the extension of the combination possibility and deep learning model (CDLM) by weighing the information sources according to their importance (e.g. age or race have a lesser information weight than Gleason score or PSA), since the predictive value of age at diagnosis and race for advanced tumor and Gls upgrading is depending on Gls scores as shown by recent studies.33–35
We preferred the neural network over conditional algorithms for the classification system developed from the parameter combination due to the high scalability and easier extensibility of the neural network. The depth of input parameters (subcategories) should be considered when developing a combination and deep neural network model. The depth of input parameters defines the number of possible combinations of input parameters. However, these combinations and outcome must be clinically realistic. For instance, the presence of lymph node metastases is unusual in patients with organ-confined PCas having Gls 6 and PSA levels below 10.36,37
The possible combination reflects different clinical scenarios observed in clinical routine. The clinical outcome is a consequence of the combination of different pathologic features seen in patients. For instance, only four (0.08%) of the patients having preoperative Gleason score 6, a percentage of positive cores ⩽ 16.67 percent and a PSA level between 4 and <10 ng/mL had lymph node metastases; when the percentage of positive cores is >16.7 percent, the frequency of cases with lymph node metastases increases to 0.35 percent. When only the preoperative PSA level is changed to 10–<20 ng/mL, the frequency of lymph node metastases increases to 1 percent. When both features (i.e. PSA: 10–<20 ng/mL and >16.7% positive cores) are altered, the frequency of lymph node metastases increases to 1.77 percent. When the PSA level is changed to a level >20 ng/mL, the frequency of lymph node metastases increases to 4.98 percent. This observation explains one of the reasons of considering PSA >10 ng/mL and setting the maximal number of positive cores to two positive cores as eligibility criteria for active surveillance in very low-risk patients and considering PSA levels >20 ng/mL as indication for metastases screening. 2
Previous work and prediction models were mostly based on regression models or support vector machine.38–58 In contrast, our work introduced the prediction model, which has first utilized the deep neural network with two layers for the prediction model development for PCa.
Our model, which is based on multilayer dense neural network, can predict organ-confined PCa with AUC of 76.2 percent or F1 score 84.9 percent higher than the current Partin’s nomogram (a well-known nomogram in PCa) for organ-confined PCa with 70.4 percent (AUC). 59 In conclusion, we believe that prediction models based on multilayer dense neural network can perform better than conventional machine learning approaches.
We found that the classification accuracy of the deep learning models is equal to the highest classification accuracy of other machine learning approaches as given in Table 4. When we focus on the evaluation parameters, the deep learning models showed the best results in classification performance measured by F1 score, recall, and precision, implicating the possible strength of the deep learning model in the prediction of cancer outcomes. Table 5 lists some previous models with the classification accuracy performance and their methods.6–10 Due to the fact that all previous models have been tested on different data sets and it is insufficient to conduct a comparison analysis based on the results from these papers, we explicitly avoided any comparison analysis with previous models. In our opinion, it is essential to provide a validation set that can be used for comparison analysis between different models. However, this problem remains outside the scope of this article that evaluated the performance of different machine learning methods for the outcome prediction in PCa.
An overview of the previous prediction models for organ-confined prostate cancer and Gleason score upgrading and their performance.
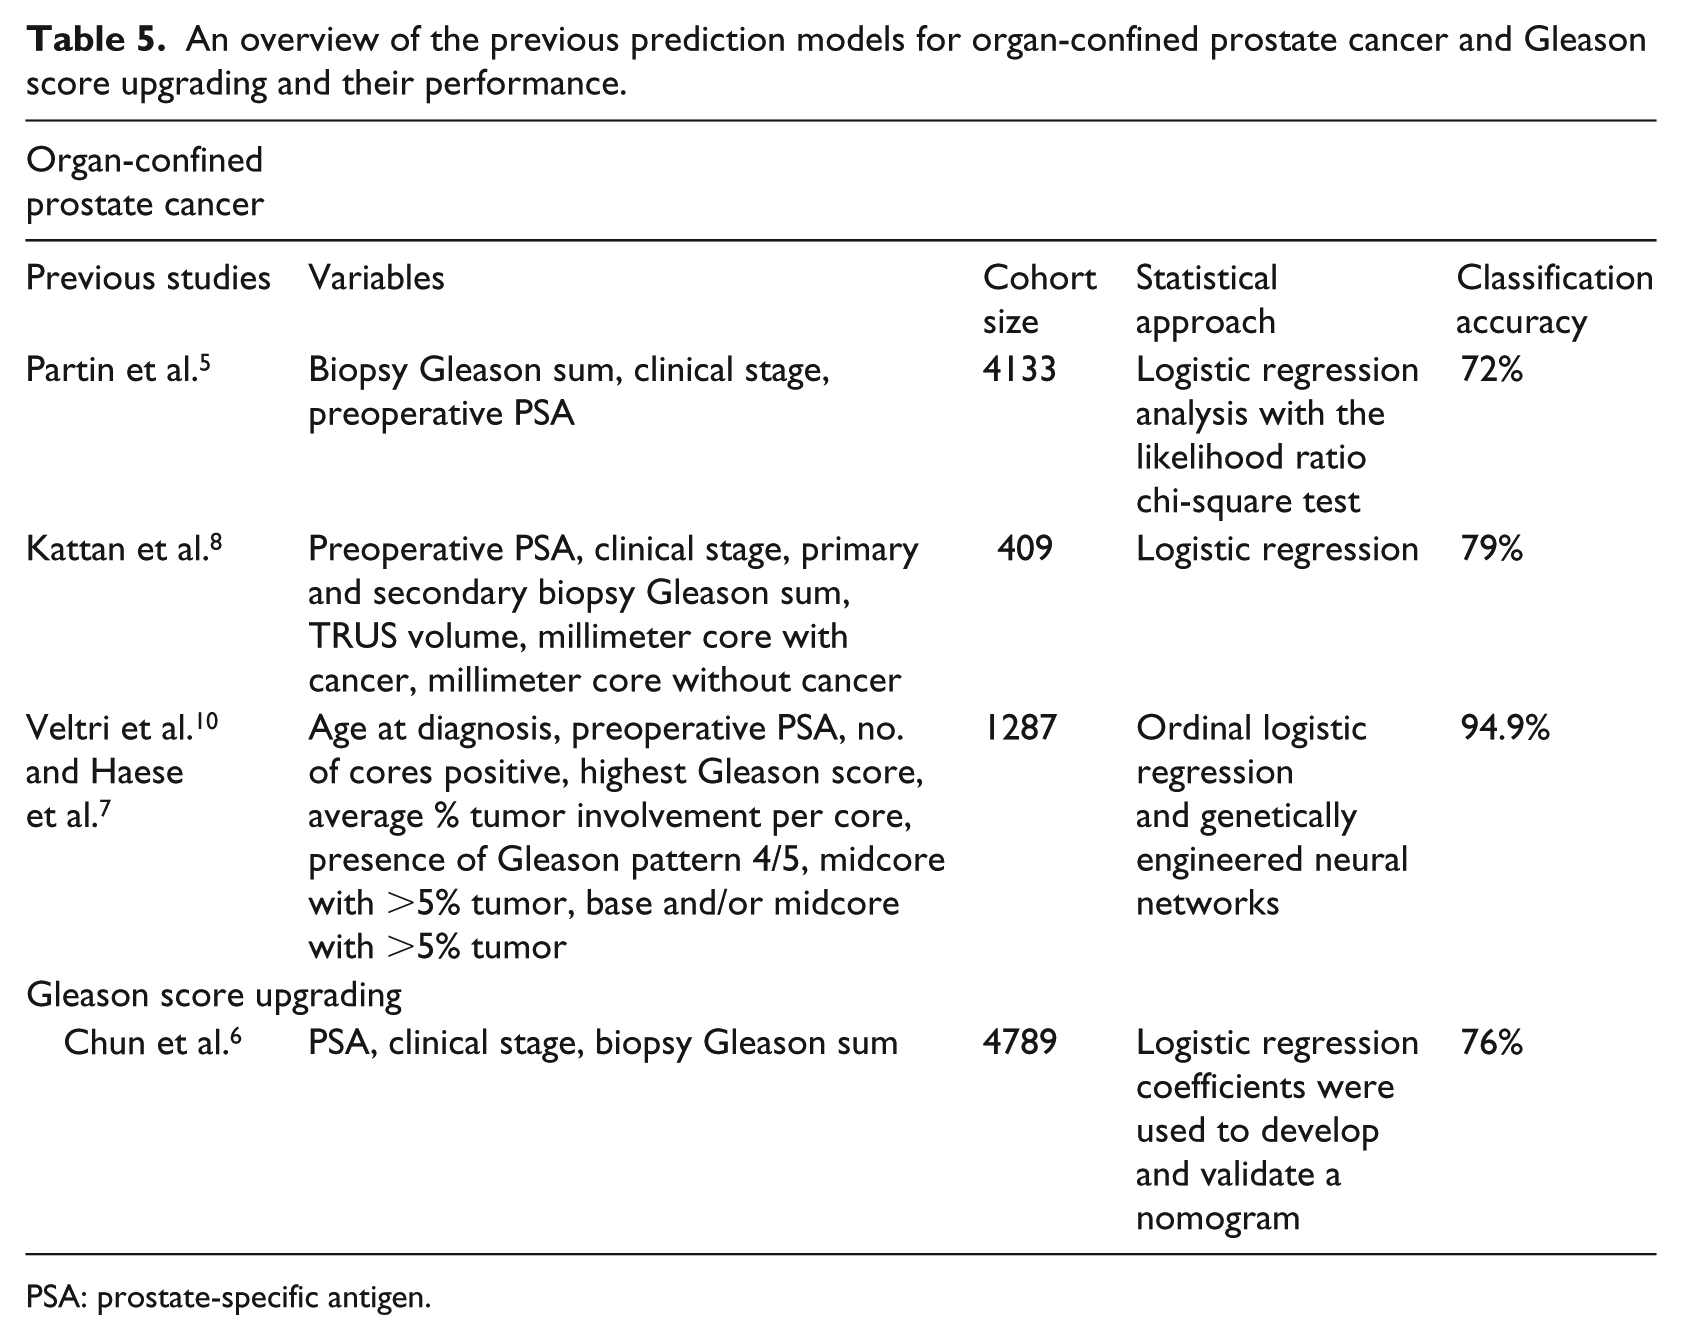
PSA: prostate-specific antigen.
The inclusion of different data sources is essential to building an accurate deep model that can identify all possible combinations of clinical parameters. Our results show that a single institutional data set cannot cover all possible combinations of featured parameters. Therefore, more than one data set or national cancer registries are required to complete or verify all possible combinations.
In summary, this study utilized for the first time the multilayer dense neural network in predicting pathologic outcomes for PCa and introduced a novel model called “combination and deep model” that allows identifying subsets of patients and corresponding observed relative frequencies. Moreover, we confirm through comparison analyses the accuracy of deep learning approach in predicting outcome using the preoperative parameters to predict the outcome. We underline the importance of clinical knowledge for developing the deep learning approach and validating the results of the deep learning models. We recommend utilizing more than one data set to train the deep models that cover all possible combinations of clinical features to predict outcomes and to provide clinically reasonable results. We included data resources representing different data acquisition scenarios and integrated them into our models after data preparation. We emphasize further that the selection of clinical features for the deep models should be available in clinical routine and must have a clinical implication. Our combination and deep model is a helpful decision-aided tool for urologists to optimize the treatment strategy by classifying the patients into different groups representing different risk constellations. Our novel model can be implemented in clinical routine by a smartphone app as a decision-aided tool for risk assessment for PCa. However, further study will be necessary to evaluate the acceptance of CDLM by physicians.
This study inherits some limitations that warrant mentioning. First, the pathologic evaluation was made by several pathologists and inherits the inter- and intra-observer variation. Second, there was a lack of information regarding patient comorbidities and the use of additional treatments (including radiation, systemic, salvage, and hormone therapies). Furthermore, documentation errors or misdiagnosis of metastatic disease may exist in SEER. However, SEER is the only comprehensive population-based database in the United States and represents an ideal approach to study the tumor progression in a large population with PCa, especially in recent time periods. Another limitation is that our classification model is focused only on patients who were treated by RPE. However, using these cases enabled the comparison between preoperative and final pathologic conditions.
Future work
Our future work will be focused on developing a complete model covering most of the preoperative parameters (e.g. magnetic resonance imaging (MRI) of the prostate and histology imaging) to improve our classification models for final pathologic outcomes in PCa. Moreover, we aim to improve the current risk classification system for PCa with the help of the combination and deep models.
Supplemental Material
Supplement_Table_1 – Supplemental material for Combination possibility and deep learning model as clinical decision-aided approach for prostate cancer
Supplemental material, Supplement_Table_1 for Combination possibility and deep learning model as clinical decision-aided approach for prostate cancer by Okyaz Eminaga, Omran Al-Hamad, Martin Boegemann, Bernhard Breil and Axel Semjonow in Health Informatics Journal
Footnotes
Declaration of conflicting interests
The author(s) declared no potential conflicts of interest with respect to the research, authorship, and/or publication of this article.
Funding
The author(s) disclosed receipt of the following financial support for the research, authorship, and/or publication of this article: O.E. is supported by Dr Werner Jack Staedt Foundation.
Supplemental material
Supplemental material for this article is available online.
References
Supplementary Material
Please find the following supplemental material available below.
For Open Access articles published under a Creative Commons License, all supplemental material carries the same license as the article it is associated with.
For non-Open Access articles published, all supplemental material carries a non-exclusive license, and permission requests for re-use of supplemental material or any part of supplemental material shall be sent directly to the copyright owner as specified in the copyright notice associated with the article.